
Key Takeaways
-
OriginTrail (TRAC) has surged around 12% in a single day, drawing renewed attention to the token.
-
TRAC has broken out from an ascending triangle near $0.46 on the daily chart, signaling growing bullish momentum.
-
Similar breakout structures in July and October 2025 previously led to strong rallies of 63% and 113%.
-
Holding the $0.44–$0.46 zone as support will be crucial to keep the bullish fractal setup intact.
-
If the pattern plays out, TRAC could attempt a move toward its long-term ascending resistance above $1.00.
OriginTrail, the decentralized knowledge graph protocol, is stepping back into the spotlight as its native token TRAC records a strong 12% daily surge. Beyond the price jump, the real signal is coming from the charts, where a familiar fractal breakout structure is starting to emerge on the daily timeframe, hinting that a larger upside move could be forming.
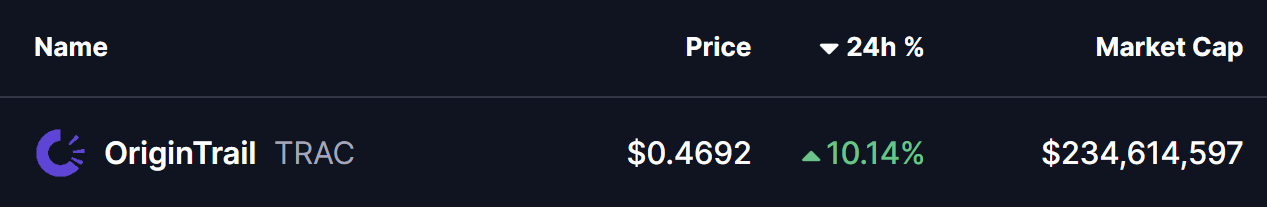
Source: Coinmarketcap
Fractal Breakout Hints at Potential Upside Move
On the daily chart, TRAC has confirmed a breakout from an ascending triangle pattern near the $0.46 level. This breakout is particularly important as price is now trading just above the 200-day moving average, a level that has historically acted as a major trend-defining zone for TRAC.
What makes this setup more compelling is its similarity to previous breakout phases. In late July 2025, a comparable structure resulted in a 63% upside move after price held above its breakout base. Later, in early October 2025, TRAC broke out from a right-angled descending broadening wedge pattern. That move was followed by a reclaim of the 200-day moving average and ultimately led to a powerful 113% rally.
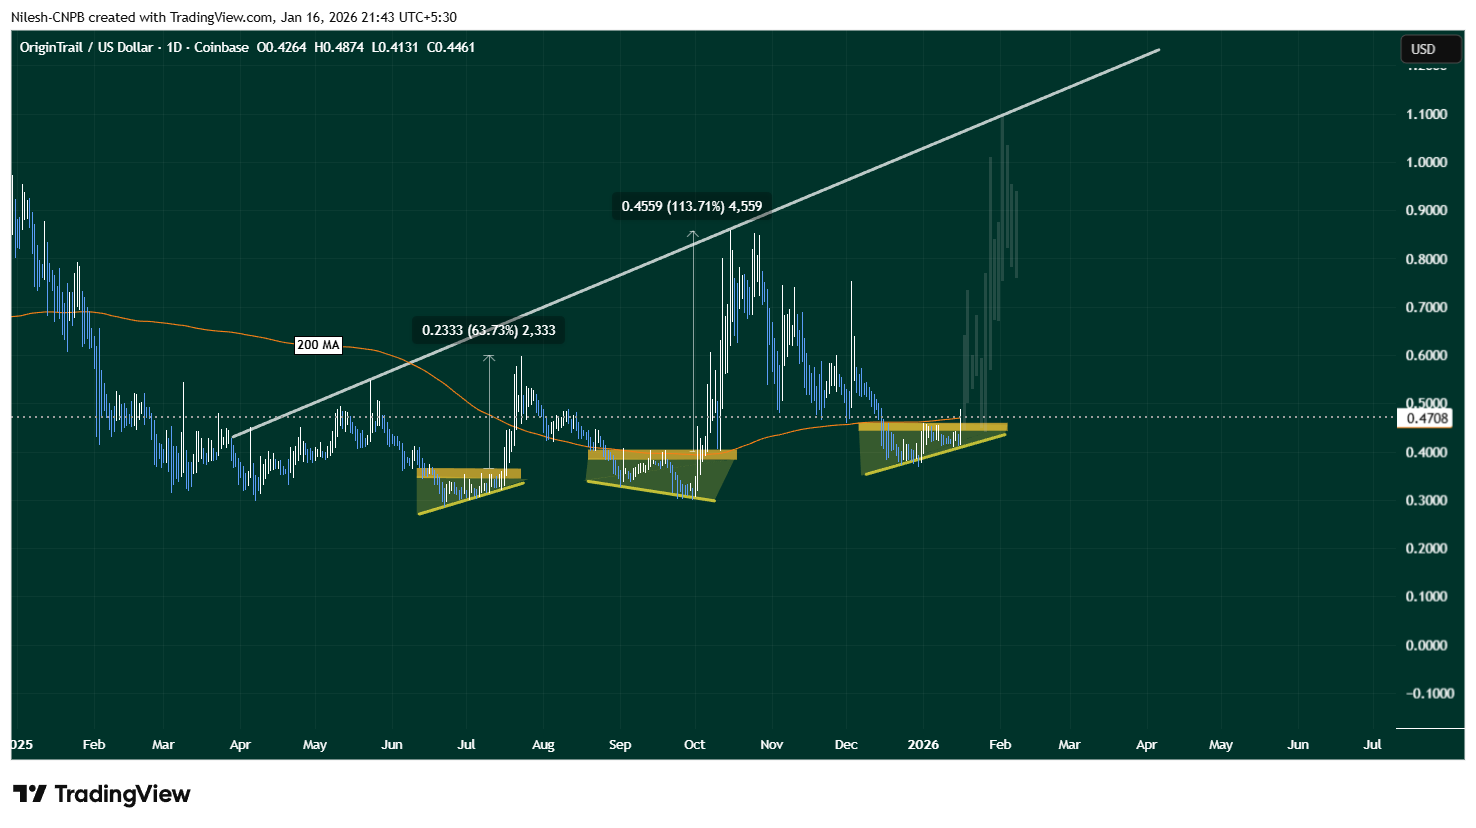
OriginTrail (TRAC) Daily Chart/Coinsprobe (Source: Tradingview)
The current setup shares key characteristics with those earlier moves. Price compression, a clean breakout, and interaction with the 200-day MA suggest that TRAC may once again be transitioning from consolidation into expansion.
What’s Next for TRAC?
If this fractal breakout plays out as expected, holding the $0.44–$0.46 zone as support will be crucial. A sustained hold above this range, along with continued strength above the 200-day moving average, could act as a launchpad for further upside.
In that scenario, TRAC may attempt a move toward its long-term ascending resistance trendline, which currently sits above the $1.00 level. A push toward that zone would align closely with the magnitude of prior fractal-driven rallies seen on the chart.
That said, fractal patterns are never guarantees. Broader market conditions, liquidity, and overall sentiment will continue to influence price action. A failure to hold the $0.44–$0.46 support zone or a rejection back below the 200-day moving average could invalidate the breakout and weaken the bullish fractal thesis.
Bottom Line
TRAC is showing early signs of another technically significant breakout, supported by historical fractal behavior and a reclaim of a key long-term moving average. If buyers can defend the current support zone, the chart suggests that OriginTrail may be positioning itself for a larger upside move in the weeks ahead.
Disclaimer: The views and analysis presented in this article are for informational purposes only and reflect the author’s perspective, not financial advice. Technical patterns and indicators discussed are subject to market volatility and may or may not yield the anticipated results. Investors are advised to exercise caution, conduct independent research, and make decisions aligned with their individual risk tolerance.
About Author: Nilesh Hembade is the Founder and Lead Author of Coinsprobe, with over 5 years of experience in the cryptocurrency and blockchain industry. Since launching Coinsprobe in 2023, he has been providing daily, research-driven insights through in-depth market analysis, on-chain data, and technical research.
Disclaimer: The information on this page may come from third parties and does not represent the views or opinions of Gate. The content displayed on this page is for reference only and does not constitute any financial, investment, or legal advice. Gate does not guarantee the accuracy or completeness of the information and shall not be liable for any losses arising from the use of this information. Virtual asset investments carry high risks and are subject to significant price volatility. You may lose all of your invested principal. Please fully understand the relevant risks and make prudent decisions based on your own financial situation and risk tolerance. For details, please refer to
Disclaimer.
Gerelateerde artikelen
Arthur Hayes:比特币长期目标价25万至75万美元,短期或跌破6万美元
Arthur Hayes在播客中表示,由于美联储未扩大流动性,他不会投入更多资金于比特币,预计中长期目标价在25万至75万美元。他警告若美伊冲突持续,比特币短期可能跌破6万美元。同时,Charles Schwab将推出比特币和以太坊现货交易。研究显示,比特币在重大冲击后表现优于黄金和标普500,目前价格回升至67300美元。
GateNews3u geleden
加密货币恐慌与贪婪指数今日升至 13,市场仍处极度恐慌状态
Gate News 消息,4 月 6 日,据 Alternative.me 数据显示,今日加密货币恐慌与贪婪指数升至 13,较昨日的 12 小幅上升 1 个点。尽管指数有所回升,但市场情绪仍处于「极度恐慌状态」。
GateNews3u geleden
Michael Saylor bác bỏ cảnh báo 'MSTR sụp đổ' của Schiff, chỉ ra lợi nhuận 36% hàng năm từ Bitcoin
Michael Saylor, CEO of MicroStrategy, defends the company's Bitcoin strategy against investor Peter Schiff's warning about MSTR stock. Despite losses, Saylor emphasizes Bitcoin's superior performance compared to gold and the S&P 500 since 2020.
TapChiBitcoin3u geleden
BTC 15分钟上涨0.79%:机构撤离与结构性资金流出主导盘面波动
2026-04-05 22:30 至 2026-04-05 22:45(UTC),BTC价格在67416.0至67986.7 USDT区间波动,15分钟内收益率达到+0.79%,振幅为0.85%。盘面快速异动引发市场关注,波动加剧但整体交易量未出现极端放大,情绪以谨慎和波动为主。
本次异动的主要驱动力是机构资金持续撤离以及大额资金向交易所外净流出。链上数据显示,24小时全网BTC净流出达-2,1
GateNews4u geleden
Bitcoin tends to outperform gold and stocks after global shocks, Mercado Bitcoin finds
Bitcoin BTC$67,345.02 tends to outperform traditional safe haven assets like gold in the two months following major global crises, according to new analysis from Brazilian crypto exchange Mercado Bitcoin.
The study, led by Rony Szuster, head of research at the Latin American crypto platform,
CoinDesk7u geleden
SHIB Holds Weak Range as Burn Rate Drops and Pressure Builds
Key Insights
SHIB remains within a long-standing descending channel, with price stuck in the lower range and unable to break persistent resistance levels.
The burn rate dropped sharply, removing a short-term support factor and reducing retail-driven momentum seen earlier during increased
CryptoNewsLand7u geleden
