
**Date: **Mon, Jan 05, 2026 | 07:55 AM GMT
As 2026 kicks off, the broader cryptocurrency market is showing renewed stability. Ethereum (ETH) is up around 4% on the week, and improving sentiment is gradually spreading across major altcoins — including Ethena (ENA).
ENA has already surged more than 14% on a weekly basis, but the more important development is unfolding beneath the surface. While short-term strength is encouraging, the bigger story lies in the structure forming on the chart. Recent price action suggests a meaningful shift in market behavior — one that could mark the early stages of a bullish continuation if key resistance levels are reclaimed.
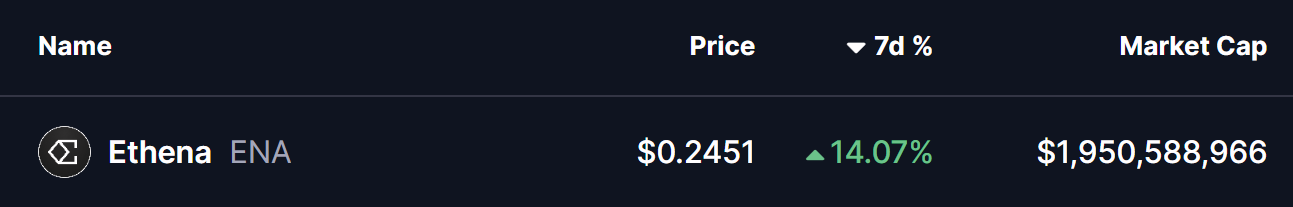
Source: Coinmarketcap
Rounding Bottom in Play
On the daily timeframe, ENA appears to be forming a rounding bottom pattern, a classic bullish reversal structure that typically develops after a prolonged corrective phase.
The setup began after ENA faced a firm rejection near the $0.3028–$0.2837 resistance zone late last month. That rejection triggered a sharp decline, dragging price down toward the $0.1935 area. Importantly, sellers failed to push price meaningfully lower from there, and strong demand emerged at those levels. Over time, ENA stabilized, volatility compressed, and price began to curl higher — completing the rounded base structure.
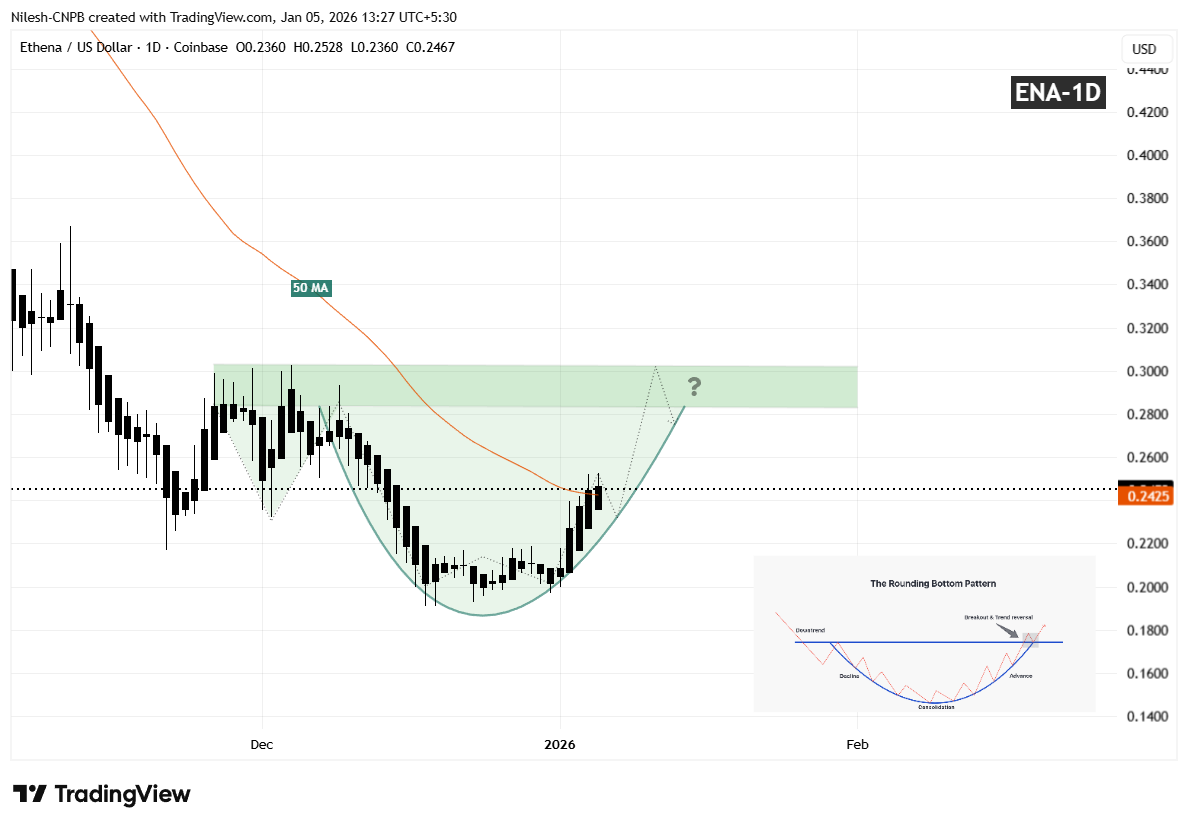
Ethena (ENA) Daily Chart/Coinsprobe (Source: Tradingview)
Since carving out that bottom, ENA has started to move higher in a smooth, rounded fashion, closely matching the textbook characteristics of a developing rounding bottom. The recent recovery has also brought price back toward the 50-day moving average near $0.2451, a level that previously acted as resistance and is now being tested as potential support.
What’s Next for ENA?
If ENA continues to hold above the 50-day MA, that level could act as a solid short-term base for further upside attempts. A clean and decisive breakout above the $0.3028–$0.2837 resistance zone, followed by sustained acceptance above it, would validate the entire reversal pattern and likely open the door for a broader bullish expansion phase.
Until such a breakout occurs, the pattern remains in development. Short-term consolidation or shallow pullbacks remain possible as price digests recent gains. However, as long as ENA continues to form higher lows above the established base, the broader bottoming structure remains intact and constructive.
For now, the chart suggests ENA is approaching a critical confirmation phase — one that could determine whether this recovery evolves into a sustained bullish trend as the new year unfolds.
Disclaimer: The views and analysis presented in this article are for informational purposes only and reflect the author’s perspective, not financial advice. Technical patterns and indicators discussed are subject to market volatility and may or may not yield the anticipated results. Investors are advised to exercise caution, conduct independent research, and make decisions aligned with their individual risk tolerance.
About Author: Nilesh Hembade is the Founder and Lead Author of Coinsprobe, with over 5 years of experience in the cryptocurrency and blockchain industry. Since launching Coinsprobe in 2023, he has been providing daily, research-driven insights through in-depth market analysis, on-chain data, and technical research.
Disclaimer: The information on this page may come from third parties and does not represent the views or opinions of Gate. The content displayed on this page is for reference only and does not constitute any financial, investment, or legal advice. Gate does not guarantee the accuracy or completeness of the information and shall not be liable for any losses arising from the use of this information. Virtual asset investments carry high risks and are subject to significant price volatility. You may lose all of your invested principal. Please fully understand the relevant risks and make prudent decisions based on your own financial situation and risk tolerance. For details, please refer to
Disclaimer.
Gerelateerde artikelen
AHR999 Index Falls Below 0.45 for First Time in 837 Days
Gate News bot message, The AHR999 Index has dropped below 0.45, marking the first occurrence in 837 days. This level was last observed in February 2026. Prior to that, the index reached this zone in October 2023, preceding the price movement from $28K to $72K. The source notes this is not a buy sign
GateNews1u geleden
XRP Supply Shift: Whales Add 200 Million Tokens as Price Eyes $1.50 - U.Today
XRP has seen a significant increase in whale activity, with 200 million XRP bought recently, while network activity and wallet numbers reach new highs. A "golden cross" signals potential price rises, as the SEC clarifies crypto asset regulations.
UToday3u geleden
比特幣跌破 7.1 萬美元、以太坊失守 $2200!全網 4 小時爆倉近 3 億,通膨、戰火、政治僵局「三殺」加密市場
加密市場在18日晚遭遇暴跌,比特幣跌破71,000美元,以太坊跌落2,200美元。導致原因包括美國PPI數據超出預期,降低了聯準會降息的可能性;中東戰火升級增加地緣政治風險;以及美國國會對加密法規的僵局。市場情緒因此受到重創,僅4小時內就有11萬人爆倉,損失達3億美元。
動區BlockTempo5u geleden
Here’s Where Gold Price Could Go After the FOMC Decision
Gold is in a bearish trend, forming a waterfall pattern with lower highs and lows. Watch the 4905 level; a break could lead to a drop toward 4841. Upcoming FOMC announcements may cause volatility, impacting price movements.
CaptainAltcoin5u geleden
某 CEX 调查:74%机构预计未来12个月加密市场将反弹,配置意愿持续增强
尽管加密市场自去年以来回调,最新调查显示机构投资者信心稳固,73%计划到2026年增加数字资产配置,74%预计未来12个月市场反弹。多数机构倾向通过受监管工具投资,同时关注市场监管清晰度与风险管理。
GateNews6u geleden
