
Date: Fri, Dec 26, 2025 | 06:30 PM GMT
The broader cryptocurrency market has been navigating a period of choppy and uncertain price action over the past several weeks, a phase that began after the sharp market-wide sell-off on October 10. During that correction, Ethereum (ETH) dropped nearly 28% over the last 60 days, applying sustained pressure across the altcoin sector — including ether.fi (ETHFI).
ETHFI has mirrored this weakness, sliding more than 31% over the same period. However, despite the sharp downtrend, recent price behavior suggests selling pressure may be easing. The token is now trading near a historically significant demand zone, where buyers have repeatedly stepped in before — raising the possibility that ETHFI could be approaching an inflection point.
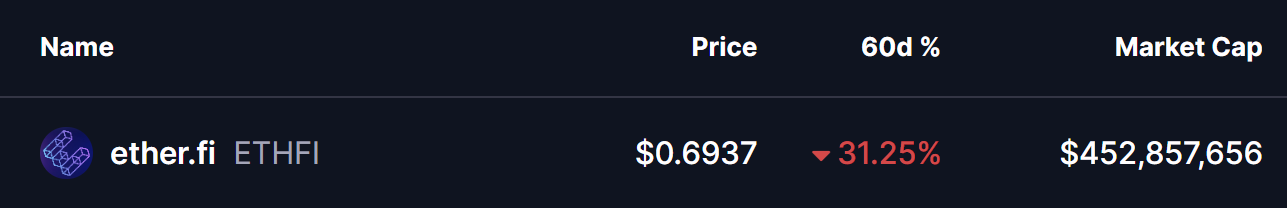
Source: Coinmarketcap
Double Bottom Pattern in Focus
On the daily timeframe, ETHFI appears to be forming a potential double-bottom structure — a classic reversal pattern that often signals exhaustion among sellers. The setup began after ETHFI was rejected from the $0.9233 resistance area, a move that triggered a sharp decline of nearly 28% and pushed price back toward the lower end of its range.
That sell-off dragged ETHFI into the $0.65 support zone, a level that has consistently acted as a strong demand area in the past. The chart now shows price revisiting this same region and stabilizing once again, suggesting buyers are actively defending it. The similarity between the first and second lows strengthens the case that a double-bottom base may be forming.
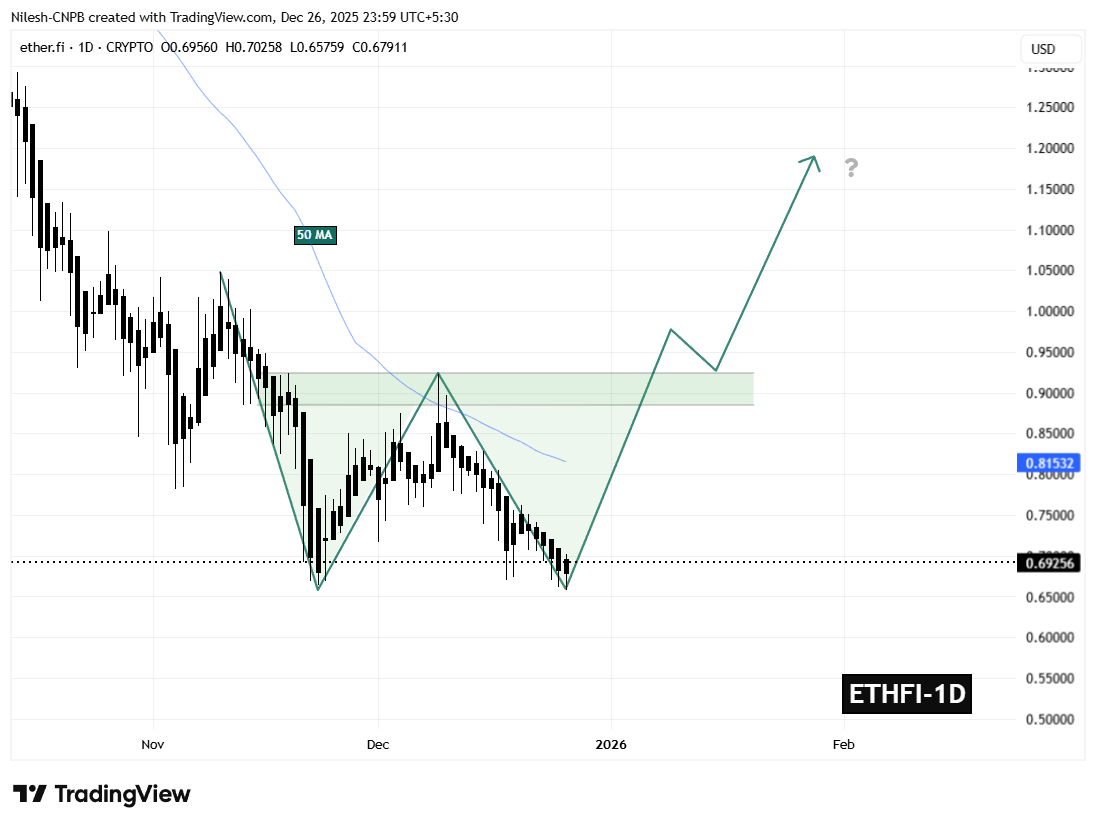
ETHFI Daily Chart/Coinsprobe (Source: Tradingview)
If this support continues to hold, the ongoing consolidation could mark the completion of the second bottom — a critical step in shifting momentum away from sellers and toward a potential trend reversal.
What’s Next for ETHFI?
The $0.65 support zone remains the most important level to monitor in the near term. As long as ETHFI holds above this area, the developing bullish structure remains valid and provides room for momentum to gradually rebuild.
On the upside, the first major challenge sits at the 50-day moving average near $0.8153. This level has repeatedly capped recovery attempts throughout the recent downtrend and now represents the initial test for buyers. A sustained move above this moving average would signal improving market structure and growing bullish confidence.
Beyond that, the $0.9233 neckline stands as the key confirmation level. A decisive breakout above this resistance would complete the double-bottom pattern and significantly strengthen the bullish outlook, potentially opening the door for a broader recovery move in the weeks ahead.
For now, ETHFI finds itself at a technically pivotal zone — one that could either reinforce the existing downtrend or mark the beginning of a meaningful rebound if buyers continue to defend support.
Disclaimer: The views and analysis presented in this article are for informational purposes only and reflect the author’s perspective, not financial advice. Technical patterns and indicators discussed are subject to market volatility and may or may not yield the anticipated results. Investors are advised to exercise caution, conduct independent research, and make decisions aligned with their individual risk tolerance.
Disclaimer: The information on this page may come from third parties and does not represent the views or opinions of Gate. The content displayed on this page is for reference only and does not constitute any financial, investment, or legal advice. Gate does not guarantee the accuracy or completeness of the information and shall not be liable for any losses arising from the use of this information. Virtual asset investments carry high risks and are subject to significant price volatility. You may lose all of your invested principal. Please fully understand the relevant risks and make prudent decisions based on your own financial situation and risk tolerance. For details, please refer to
Disclaimer.
Gerelateerde artikelen
Cardano Tests $0.243 Pivot as Breakout Pressure Builds
Key Insights
Cardano trades near a historically strong pivot level at $0.243 while a descending wedge apex forms, increasing the likelihood of a major breakout soon.
A confirmed breakout requires a daily close above $0.2450 and SAR resistance, which could shift momentum toward $0.537 as the
CryptoNewsLand21m geleden
Elon Musk References Fuel Trading Surge in 'Asteroid' Crypto Token
Elon Musk's online activity revived interest in a cryptocurrency token known as "Asteroid crypto," causing increased trading and volatility on decentralized exchanges. Market reactions were driven by social media references, illustrating the token's sensitivity to influencer attention.
GateNews1u geleden
BTC 15分钟上涨0.69%:现货买盘增强与链上鲸鱼持续加仓共振拉动
2026-04-17 14:30至14:45(UTC),比特币(BTC)市场出现明显异动,15分钟K线收益率达+0.69%,价格区间在77455.4至78044.4 USDT,振幅0.76%。短线波动带动市场关注度抬升,交易量同步放大,流动性进一步提升。
本次异动的主要驱动力是现货市场买盘明显增强。根据链上和统计数据,14:00–15:00期间BTC现货买盘占优,巨额买单持续推升价格,同时鲸鱼地
GateNews2u geleden
ADA Tests Key $0.230 Support While Upgrade Timeline Holds
Key Insights:
ADA trades at the wedge apex near $0.2387 as price compresses between $0.230 support and $0.245 resistance ahead of a decisive breakout move.
Protocol 11’s timeline remains intact despite the memory bug fix, keeping Cardano fundamentals stable while macro risks dominate short-t
CryptoNewsLand2u geleden
