Date: Sun, Dec 21 2025 | 08:56 AM GMT
The broader cryptocurrency market has remained under pressure over the past several weeks, following the sharp sell-off that began on October 10. That corrective phase dragged Ethereum (ETH) down by nearly 23% over the last 60 days and weighed heavily on overall market sentiment. While many altcoins have struggled to stabilize, Quant (QNT) has shown relative resilience, posting only a modest decline and holding above a historically important support zone.
From a technical perspective, the daily chart suggests that QNT may be approaching a critical decision point, with price action forming a recognizable structure that could influence its next directional move.
Source: Coinmarketcap
Head and Shoulders Pattern Takes Shape
On the daily timeframe, QNT appears to be carving out a head and shoulders formation, a well-known pattern that often signals a potential trend shift once the neckline is tested. Earlier in the structure, QNT formed the left shoulder before rallying sharply to its head near the $100 region. From there, price reversed lower and slid back toward the neckline, located around the $70 support zone.
This $70 area has proven to be a strong demand zone in the past, repeatedly attracting buyers and preventing deeper declines. The recent move into this region was met with a noticeable reaction, as reflected by the long lower wick on the chart. That rejection from support pushed price back toward the $78 level, suggesting that buyers are actively defending the neckline and potentially forming the right shoulder of the pattern.
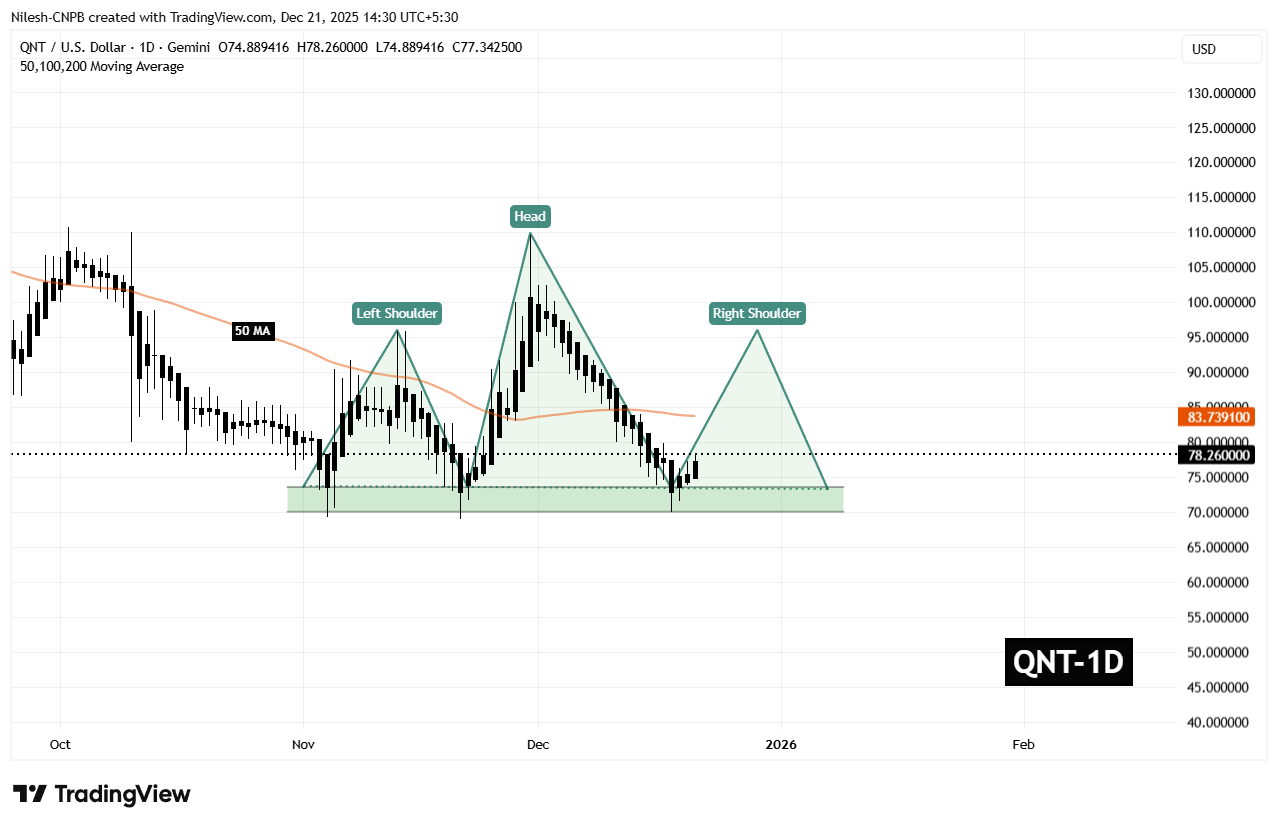
Quant (QNT) Daily Chart/Coinsprobe (Source: Tradingview)
The behavior around this zone is critical. A successful defense of the neckline often opens the door for a relief rally, especially if broader market conditions stabilize.
What’s Next for QNT?
For bullish momentum to build, QNT needs to reclaim the 50-day moving average, currently sitting near $83.73. This level now acts as a key short-term resistance, and a daily close above it would signal a shift in momentum back in favor of buyers.
If that recovery unfolds, the chart points toward a potential move into the $95.90 region. Such a move would represent a rebound of roughly 22% from current levels and align with the typical reaction seen during the right-shoulder phase of this pattern. A rally of this nature would not only ease recent selling pressure but also place QNT back into a more neutral technical posture.
That said, the setup remains delicate. If the $70 neckline support fails to hold on a sustained basis, the head and shoulders structure would remain bearish, opening the door to further downside and extending the corrective phase. For now, all eyes remain on how price behaves around this key support and whether buyers can regain control above the moving average.
Disclaimer: The views and analysis presented in this article are for informational purposes only and reflect the author’s perspective, not financial advice. Technical patterns and indicators discussed are subject to market volatility and may or may not yield the anticipated results. Investors are advised to exercise caution, conduct independent research, and make decisions aligned with their individual risk tolerance.
Disclaimer: The information on this page may come from third parties and does not represent the views or opinions of Gate. The content displayed on this page is for reference only and does not constitute any financial, investment, or legal advice. Gate does not guarantee the accuracy or completeness of the information and shall not be liable for any losses arising from the use of this information. Virtual asset investments carry high risks and are subject to significant price volatility. You may lose all of your invested principal. Please fully understand the relevant risks and make prudent decisions based on your own financial situation and risk tolerance. For details, please refer to
Disclaimer.
Gerelateerde artikelen
$LINK and $PIPPIN Outshine AI Agent Projects By Social Activity
The article discusses the Top 10 AI Agent Projects in cryptocurrency based on social activity, revealing Chainlink ($LINK) as the leader. It highlights engagement and interaction metrics for various projects, indicating strong interest and demand in the market.
BlockChainReporter23m geleden
Ethereum Network Activity Claims New ATH Indicating Bullish Divergence
The Ethereum network has reached a new all-time high in activity, signaling its growing utility beyond speculation. Factors like L2 scaling and DeFi are driving this surge, suggesting strong long-term growth potential for Ethereum ($ETH).
BlockChainReporter44m geleden
FLOW Recovers From Prolonged Downtrend As Buy-Side Liquidity Builds, Triggering a Potental 22% Br...
The Flow (FLOW) coin is attracting investor interest as its on-chain market continues to pick up fresh momentum, according to a revelation disclosed today by financial analyst Crypto Patel. As per the data posted today, the cryptocurrency has developed a clear bull structure and is displaying a
BlockChainReporter54m geleden
PEPE Price Holds Support as Bearish Bets Build Pressure
Key Insights:
PEPE price stabilizes near strong support despite sustained negative funding rates, highlighting a clear divergence between trader sentiment and actual market behavior.
Declining open interest and reduced liquidation activity indicate leverage reset, suggesting the market has c
CryptoNewsLand1u geleden
Zcash Price Rally Gains Pace as Shielded Pools Hit Record
Key Insights:
Zcash surged 25% daily and over 60% monthly as strong demand for privacy features drove increased investor participation across the network.
Shielded pool holdings reached $5.18 billion, showing over 31% of supply now locked in private transactions, signaling stronger user
CryptoNewsLand1u geleden
'Bitcoin ETF Performance Pales Next to Gold': Mike McGlone - U.Today
Mike McGlone, a Bloomberg strategist, argues that Bitcoin ETFs may not drive long-term growth for Bitcoin, which has underperformed compared to gold. Despite recent gains, Bitcoin's performance seems capped, suggesting a potential peak in crypto enthusiasm.
UToday2u geleden
