AI Token (AI) has collectively adjusted along with Bitcoin (BTC) and the overall cryptocurrency market for three consecutive days as geopolitical tensions escalate around the US’s intention to acquire Greenland. However, some representatives within the AI group are showing signs of resilience, attempting to establish support zones and aiming for a scenario to retest key resistance levels.
ICP Faces Pressure Around 20-Day and 50-Day EMA
Internet Computer (ICP) is currently struggling to defend a critical support zone, where the 20-day and 50-day exponential moving averages (EMA) converge. Selling pressure increased after the price was strongly rejected at the resistance zone around $4.41 — an area that becomes even more “rigid” when it coincides with the 200-day EMA.
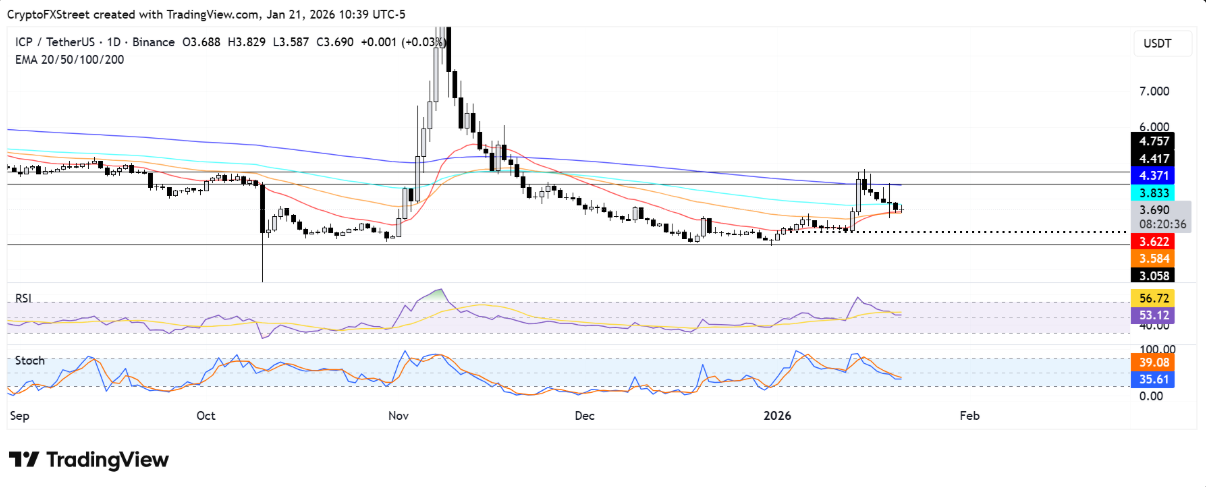 Daily ICP/USDT Chart | Source: TradingViewIn a negative scenario, if ICP loses the EMA 20 and EMA 50 support zones, the price is likely to retreat to test the psychological level of $3.0. Further down, the $2.70 zone could become the “last shield,” acting as a buffer to absorb selling pressure if the downtrend continues strongly.
On the other hand, the recovery outlook is only truly supported when ICP maintains a steady upward momentum above the 100-day EMA, opening up the possibility of returning to challenge the $4.41 resistance zone.
In terms of momentum, the RSI indicator is oscillating around the neutral threshold, while the Stochastic Oscillator remains below the midline — signals that the upward momentum is weakening and the market still lacks clear breakout strength.
Bittensor Holds Support at $230, Aiming for Downtrend Resistance
Bittensor (TAO) is striving to defend an important support zone around $230 after the price fell below both the 20-day and 50-day EMAs. Over the past week, this AI token has maintained a clear downtrend, originating from failure to approach the $305 resistance zone — an area coinciding with the 100-day EMA and acting as a “wall” hindering upward movement.
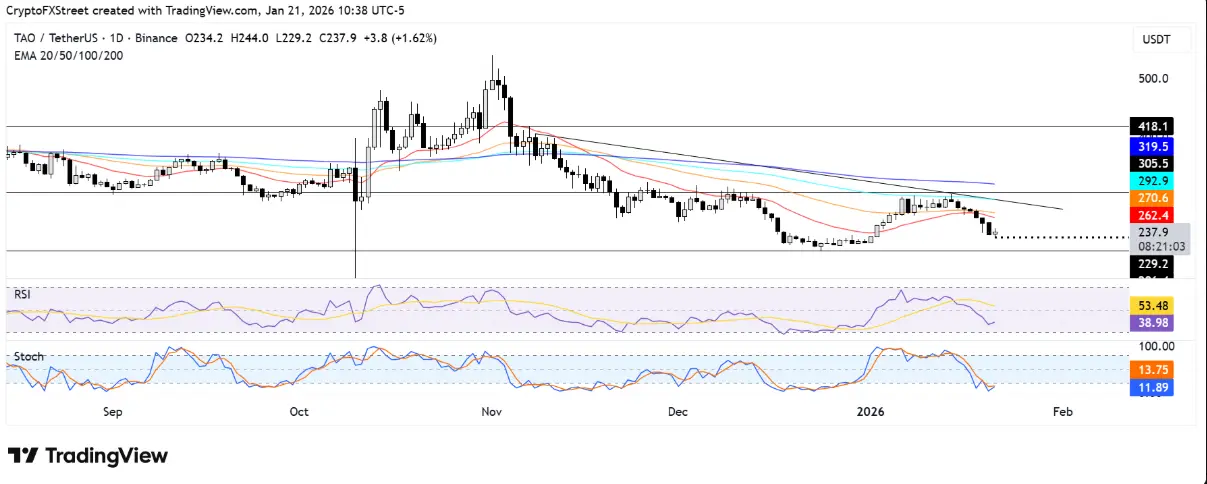 TAO/USDT Daily Chart | Source: TradingViewIn a positive scenario, if TAO maintains the $230 level and quickly recovers the 50-day EMA, the price could open up opportunities to test the downtrend line formed since November 8. Conversely, losing this support zone would increase selling pressure, pushing TAO back to a lower support area around $206.
Regarding technical indicators, RSI is currently below the neutral threshold, reflecting weakening momentum. Meanwhile, the Stochastic Oscillator has entered the oversold zone — a factor that could trigger a short-term technical rebound if buying interest returns.
###Render Bounces at $1.86, Testing 100-Day EMA
Render (RENDER) is in the process of testing the 100-day EMA after bouncing from the support zone at $1.86 — an area that coincides with the 50-day EMA, temporarily halting the previous decline.
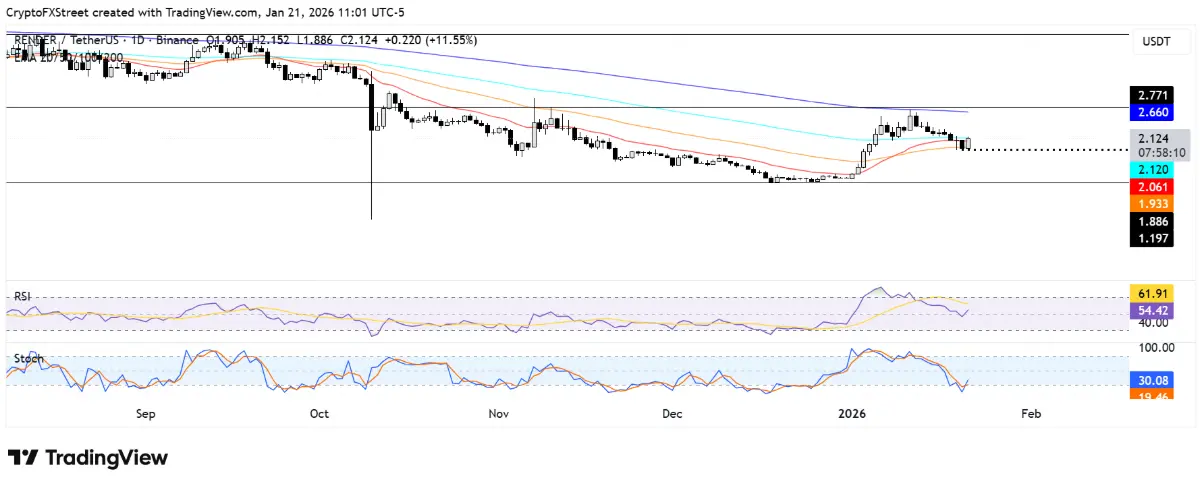 Daily RENDER/USDT Chart | Source: TradingViewIn a positive scenario, if the price can break through and sustain above the 100-day EMA, RENDER is likely to target the resistance zone at $2.77, located just above the 200-day EMA. Conversely, if the $1.86 support level is broken, selling pressure could push the price down to around $1.19.
Regarding momentum, the RSI indicator has recovered from the neutral zone, while the Stochastic Oscillator has exited the oversold region, indicating weakening selling pressure and signs of a slowdown in the downtrend.
Disclaimer: The information on this page may come from third parties and does not represent the views or opinions of Gate. The content displayed on this page is for reference only and does not constitute any financial, investment, or legal advice. Gate does not guarantee the accuracy or completeness of the information and shall not be liable for any losses arising from the use of this information. Virtual asset investments carry high risks and are subject to significant price volatility. You may lose all of your invested principal. Please fully understand the relevant risks and make prudent decisions based on your own financial situation and risk tolerance. For details, please refer to
Disclaimer.
Related Articles
Polkadot’s AltRank Exploded to #1 While $DOT Price Stayed Down – The Signal Was There Weeks Ago
Something interesting has been happening with Polkadot, and most people probably missed it.
While the DOT price has been sitting relatively low compared to its all-time highs, another metric was quietly flashing a strong signal. AltRank, a metric from LunarCrush, jumped from 109 to 1 in just o
CaptainAltcoin34m ago
BTC Traditional Bottom Indicators Fail, Three New Indicators Gain Market Attention
Bitcoin's recent price volatility has been significant, falling from $76,000 to $69,200, with mixed signals from market bottom indicators. Newly focused indicators such as CVDD, NUPL, and stablecoin inflows may provide clearer insights into market dynamics, suggesting that the bottom has not yet been reached.
GateNews50m ago
BTC 15-minute surge of 0.53%: Dovish CPI signals trigger buying frenzy, whale accumulation intensifies supply compression
During the 2026-03-19 13:30-13:45 (UTC) time window, BTC recorded a 15-minute return of +0.53%, with the price moving slightly upward within the range of 69243.3 to 69826.0 USDT, with a volatility amplitude of 0.84%. The unexpected CPI data release combined with on-chain liquidity tightening sparked market attention, causing significant short-term price movements in BTC. Trading volume did not show extreme expansion, but spot buying pressure increased rapidly.
The main driver of this price movement was the official release of US March CPI data at 13:30 (UTC), which triggered a recovery in market risk appetite. C
GateNews52m ago
BTC Drops 0.50% in 15 Minutes: Whale Fund Outflows and Leveraged Short Positions Drive Downward Movement
During the period from 2026-03-19 12:45 to 2026-03-19 13:00 (UTC), BTC spot price fluctuated rapidly within the 69108.5 - 69664.4 USDT range, with a volatility amplitude of 0.80% and a return rate of -0.50%. Market attention increased, short-term volatility intensified significantly, and trading volume expanded accordingly, reflecting rising risk-aversion sentiment among investors during this window and increased active selling pressure.
The primary drivers of this volatility were whale address fund outflows on-chain and leverage position adjustments. Specifically, whale addresses experienced approximately 2,00
GateNews1h ago
XRP Price Could Resume Journey to New All-Time High if This Key Level Holds
XRP price pulled back after a recent move toward $1.60, yet the bigger structure still points to a larger trend that has not broken. Price now trades near $1.46, and that places it inside a zone that could decide whether the next leg higher begins or stalls again.
Crypto analysis platform
CaptainAltcoin1h ago
