Trade
Trading Type
Spot
Trade crypto freely
Pre-Market
Trade new tokens before they are officially listed
Margin
Magnify your profit with leverage
Convert & Block Trading
0 Fees
Trade any size with no fees and no slippage
Alpha
Points
Get promising tokens in streamlined on-chain trading
Leveraged Tokens
Get exposure to leveraged positions simply
Futures
Futures
Hundreds of contracts settled in USDT or BTC
Options
HOT
Trade European-style vanilla options
Unified Account
Maximize your capital efficiency
Demo Trading
Futures Kickoff
Get prepared for your futures trading
Futures Events
Participate in events to win generous rewards
Demo Trading
Use virtual funds to experience risk-free trading
Earn
Launch
CandyDrop
Collect candies to earn airdrops
Launchpool
Quick staking, earn potential new tokens
HODLer Airdrop
Hold GT and get massive airdrops for free
Launchpad
Be early to the next big token project
Alpha Points
NEW
Trade on-chain assets and enjoy airdrop rewards!
Futures Points
NEW
Earn futures points and claim airdrop rewards
Investment
Simple Earn
Earn interests with idle tokens
Auto-Invest
Auto-invest on a regular basis
Dual Investment
Buy low and sell high to take profits from price fluctuations
Soft Staking
Earn rewards with flexible staking
Crypto Loan
0 Fees
Pledge one crypto to borrow another
Lending Center
One-stop lending hub
VIP Wealth Hub
Customized wealth management empowers your assets growth
Private Wealth Management
Customized asset management to grow your digital assets
Quant Fund
Top asset management team helps you profit without hassle
Staking
Stake cryptos to earn in PoS products
Smart Leverage
NEW
No forced liquidation before maturity, worry-free leveraged gains
GUSD Minting
Use USDT/USDC to mint GUSD for treasury-level yields
More
Promotions
Activity Center
Join activities and win big cash prizes and exclusive merch
Referral
20 USDT
Earn 40% commission or up to 500 USDT rewards
Announcements
Announcements of new listings, activities, upgrades, etc
Gate Blog
Crypto industry articles
VIP Services
Huge fee discounts
Proof of Reserves
Gate promises 100% proof of reserves
# anomalichart
80
TraderMiskinMimpiKaya
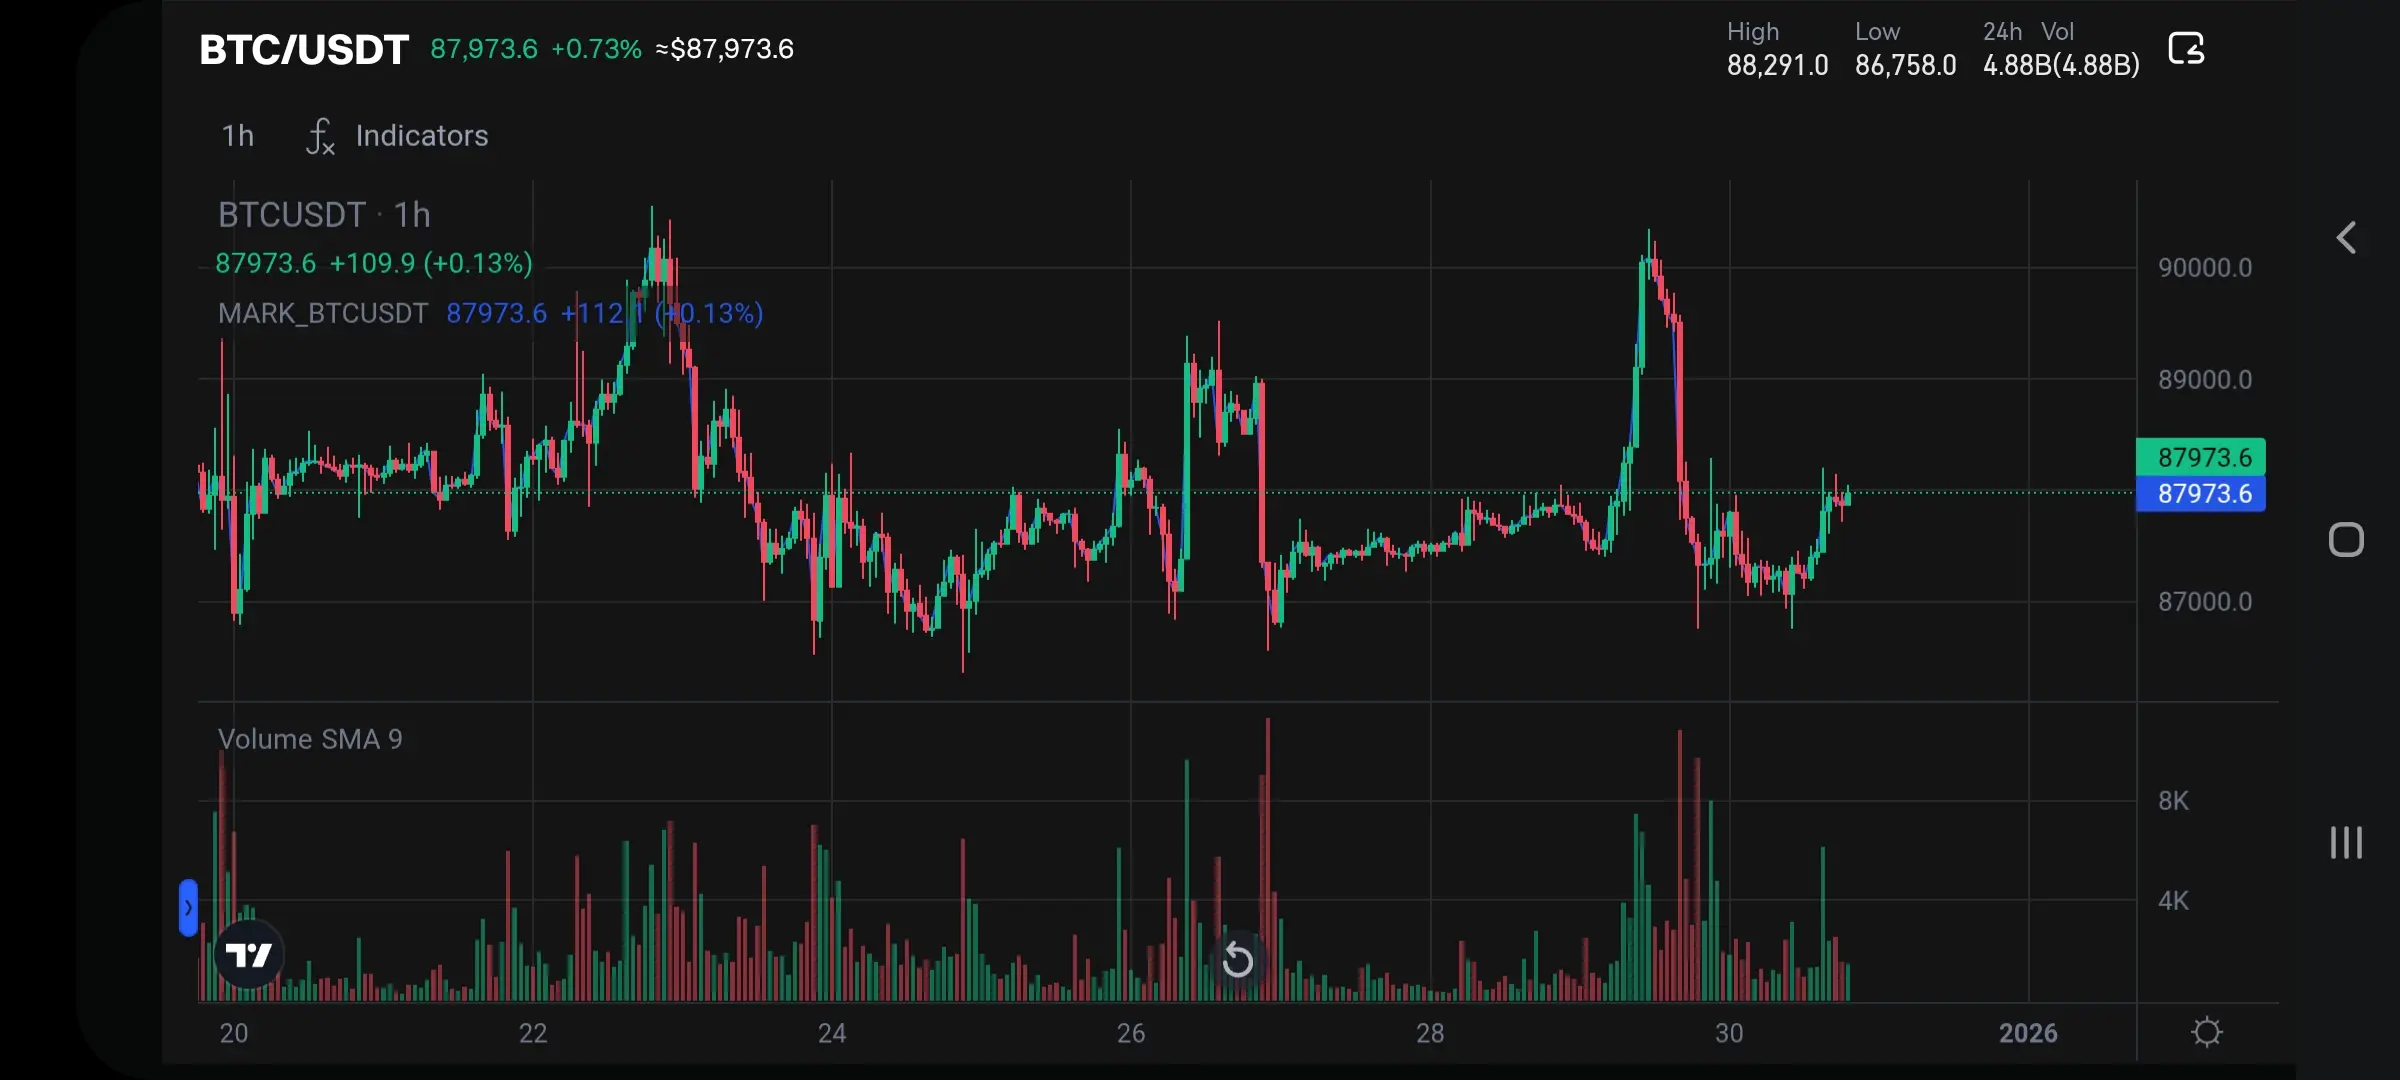
BTC/USDT Anomaly Analysis
Extreme Price Volatility (Wicks): The chart shows several long upper and lower wicks (shadows) on the candles.. This indicates high volatility where the market is "hunting" stop-losses for both long and short positions..
Heavy Resistance at $90k: There is a clear "anomaly" where the price struggles to break the $90,000 level.. Every time it spikes near that zone, it is met with strong selling pressure, forcing it back down to the $87k range..
Consolidation Pattern: Currently, the price is hovering at $87,973.6, showing a sideways movement after a sharp peak.. This of
BTC1,25%
- Reward
- 1
- Comment
- Repost
- Share
Load More
Join 40M users in our growing community
⚡️ Join 40M users in the crypto craze discussion
💬 Engage with your favorite top creators
👍 See what interests you
Trending Topics
8.88K Popularity
159.96K Popularity
30.99K Popularity
85.83K Popularity
2.61K Popularity
3.51K Popularity
2.76K Popularity
19.91K Popularity
87.22K Popularity
22.28K Popularity
211.48K Popularity
9.81K Popularity
10.94K Popularity
1.56K Popularity
219.07K Popularity
News
View MoreSlowMist: Phishing attacks remain the primary reason for Q4 fund thefts, with 300 stolen cases recovered and $1 million USD recovered.
10 m
Family offices increase their crypto asset allocations, with volatility becoming the biggest uncertainty for 2026
12 m
Neo Founder Infighting: Erik Accuses Da Hongfei of Concealing Finances, Da Hongfei Responds by Accusing Erik of Delaying Multi-Signature Transfers
24 m
RIVER(River)24小时上涨31.58%
38 m
BTC (Bitcoin) increased by 1.23% in the last 24 hours
48 m
Pin