Trade
Basic
Futures
Futures
Hundreds of contracts settled in USDT or BTC
Options
HOT
Trade European-style vanilla options
Unified Account
Maximize your capital efficiency
Demo Trading
Futures Kickoff
Get prepared for your futures trading
Futures Events
Participate in events to win generous rewards
Demo Trading
Use virtual funds to experience risk-free trading
Earn
Launch
CandyDrop
Collect candies to earn airdrops
Launchpool
Quick staking, earn potential new tokens
HODLer Airdrop
Hold GT and get massive airdrops for free
Launchpad
Be early to the next big token project
Alpha Points
NEW
Trade on-chain assets and enjoy airdrop rewards!
Futures Points
NEW
Earn futures points and claim airdrop rewards
Investment
Simple Earn
Earn interests with idle tokens
Auto-Invest
Auto-invest on a regular basis
Dual Investment
Buy low and sell high to take profits from price fluctuations
Soft Staking
Earn rewards with flexible staking
Crypto Loan
0 Fees
Pledge one crypto to borrow another
Lending Center
One-stop lending hub
VIP Wealth Hub
Customized wealth management empowers your assets growth
Private Wealth Management
Customized asset management to grow your digital assets
Quant Fund
Top asset management team helps you profit without hassle
Staking
Stake cryptos to earn in PoS products
Smart Leverage
NEW
No forced liquidation before maturity, worry-free leveraged gains
GUSD Minting
Use USDT/USDC to mint GUSD for treasury-level yields
More
- Reward
- like
- Comment
- Repost
- Share
Love Heart Charity Foundation, the transaction fee from the 7th transaction has been donated to the education fund, allowing rural children to read one more book. All crypto friends are encouraged to supervise! Aspiring to become the leading benchmark of Sesame Charity Coin! Currently, a total of 3GT has been donated, hoping to help more people.
View Original
[The user has shared his/her trading data. Go to the App to view more.]
MC:$18.62KHolders:2
49.82%
- Reward
- like
- Comment
- Repost
- Share
馬币火
Malaysian Ringgit
Created By@FireFireFire2026
Listing Progress
100.00%
MC:
$392.81K
Create My Token
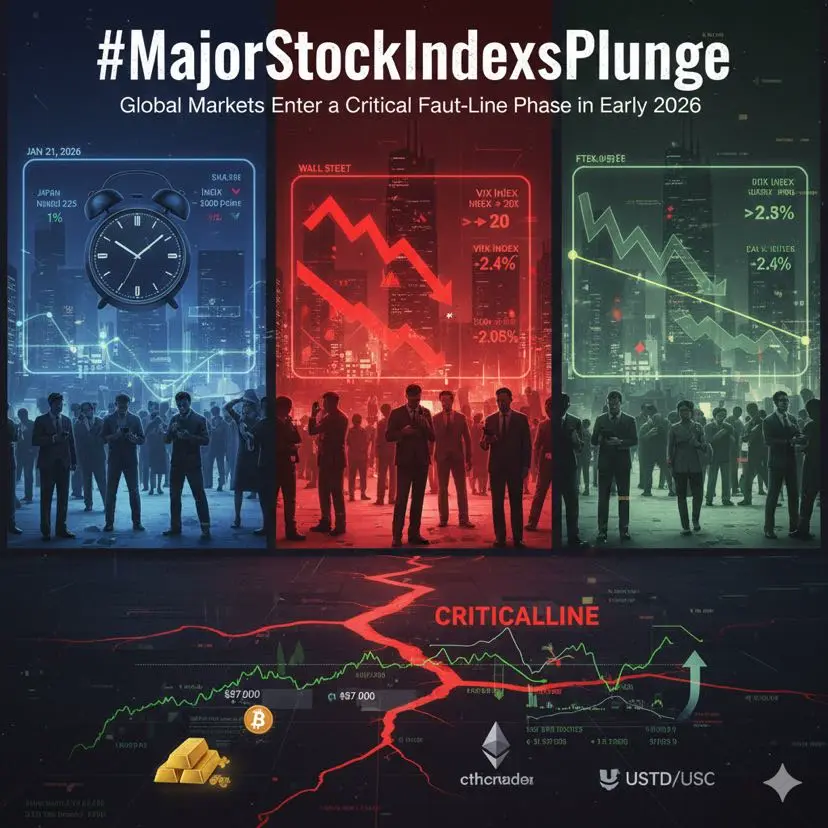
#MajorStockIndexesPlunge
Early 2026 is rapidly evolving into a defining moment for global markets. What initially appeared as a routine equity pullback has escalated into a synchronized cross-asset repricing event, dragging stocks, bonds, and digital assets into the same volatility vortex. This is no longer a correction driven by earnings or valuation compression — it is a systemic response to macro uncertainty stacking all at once.
What makes this phase especially fragile is the absence of a clear stabilizer. Liquidity conditions are tightening, geopolitical signals are becoming more erratic
- Reward
- like
- 1
- Repost
- Share
TraderBro :
:
happy birthday to you and your family 🎈🎈 you have a great time with the boys in the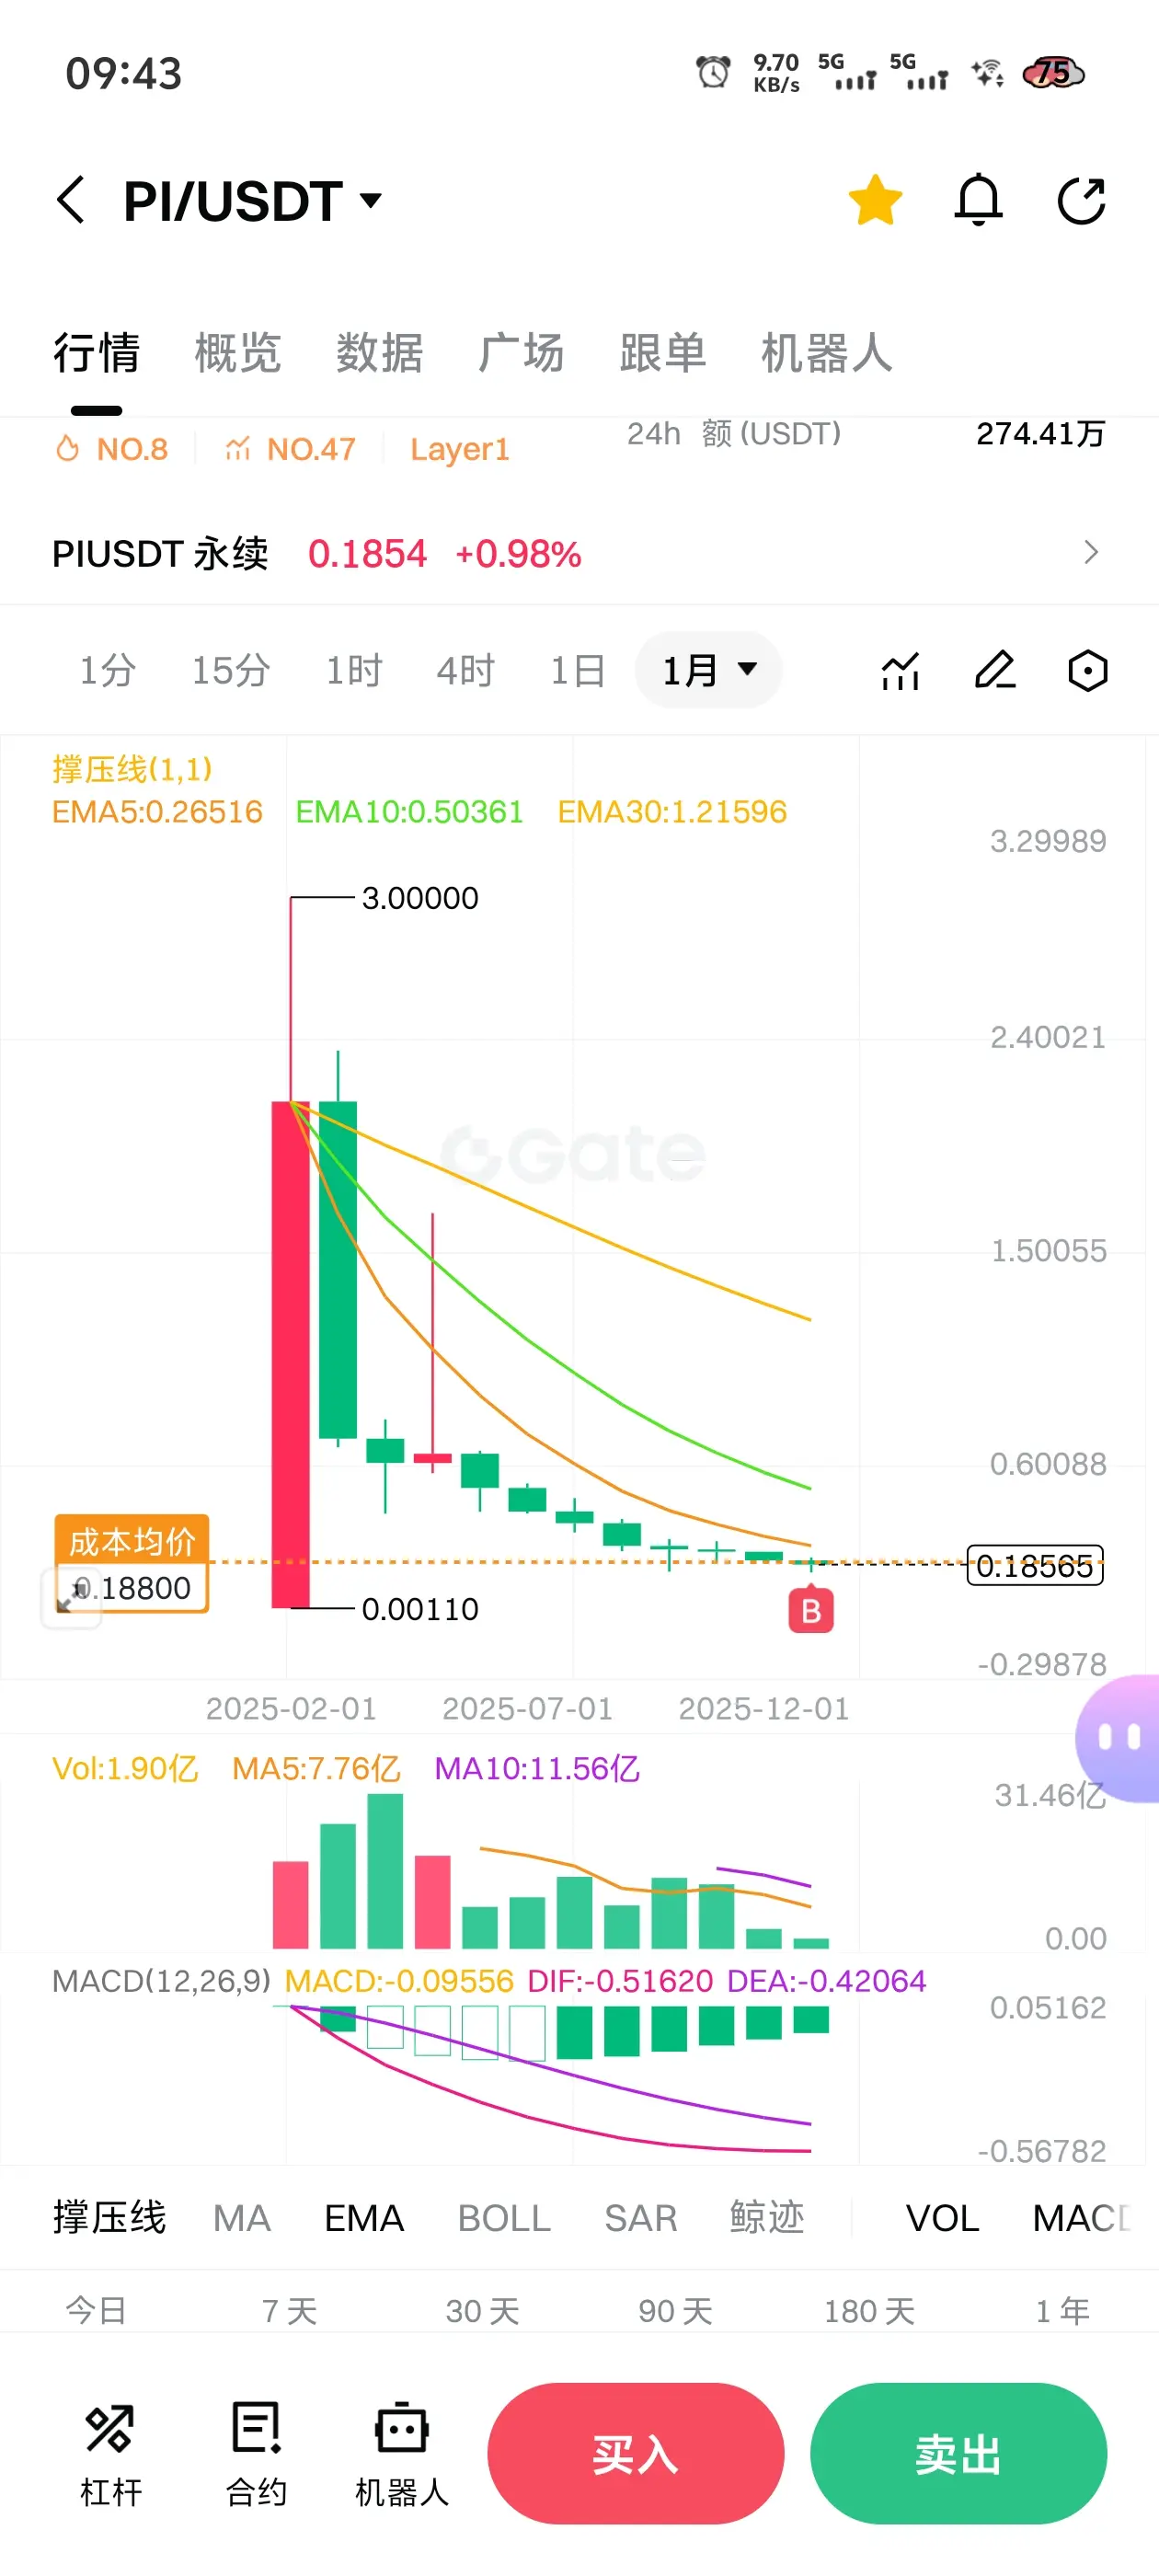
- Reward
- 2
- 3
- Repost
- Share
StarrySkyPie:
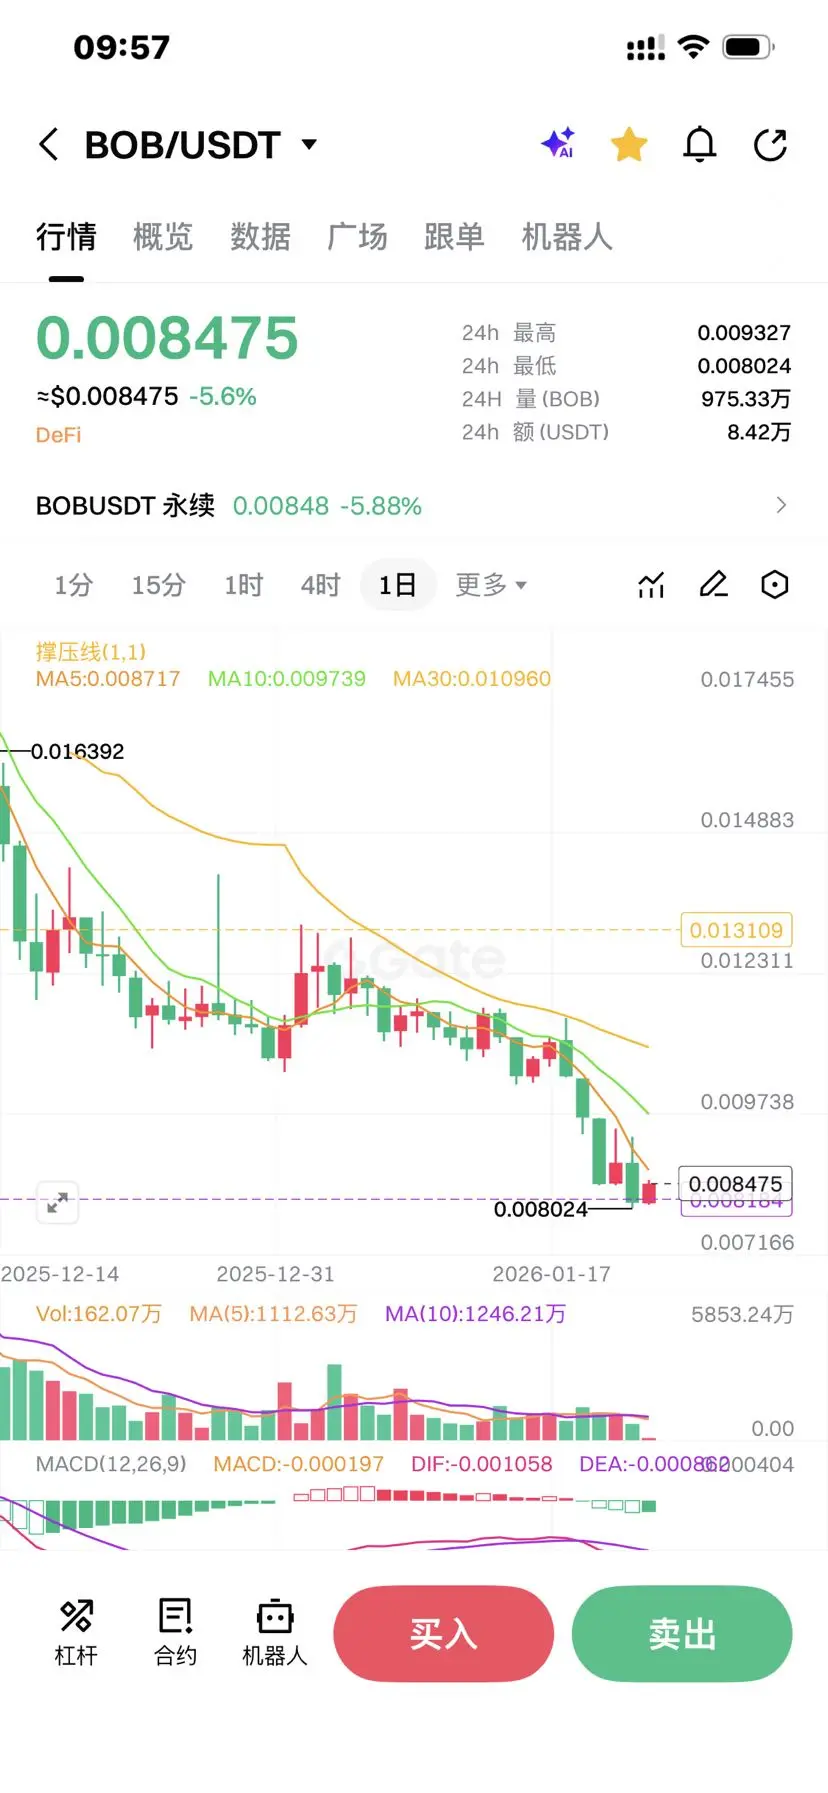
Can the monthly, weekly, and minute charts be the same?View More
Unlocking the Power of Decentralized Finance with @plasma
The world of finance is undergoing a significant transformation, and @plasma is at the forefront of this revolution. Plasma's decentralized finance platform is designed to provide users with a seamless and secure way to trade and interact with digital assets.
With its cutting-edge technology and community-driven approach, Plasma is poised to make a big impact in the DeFi space. The platform's focus on security, scalability, and usability makes it an attractive option for users looking to explore the world of decentralized finance.
One o
XPL-2,41%
- Reward
- like
- Comment
- Repost
- Share
Plushify reminds me of Giggle.
View Original
- Reward
- like
- Comment
- Repost
- Share
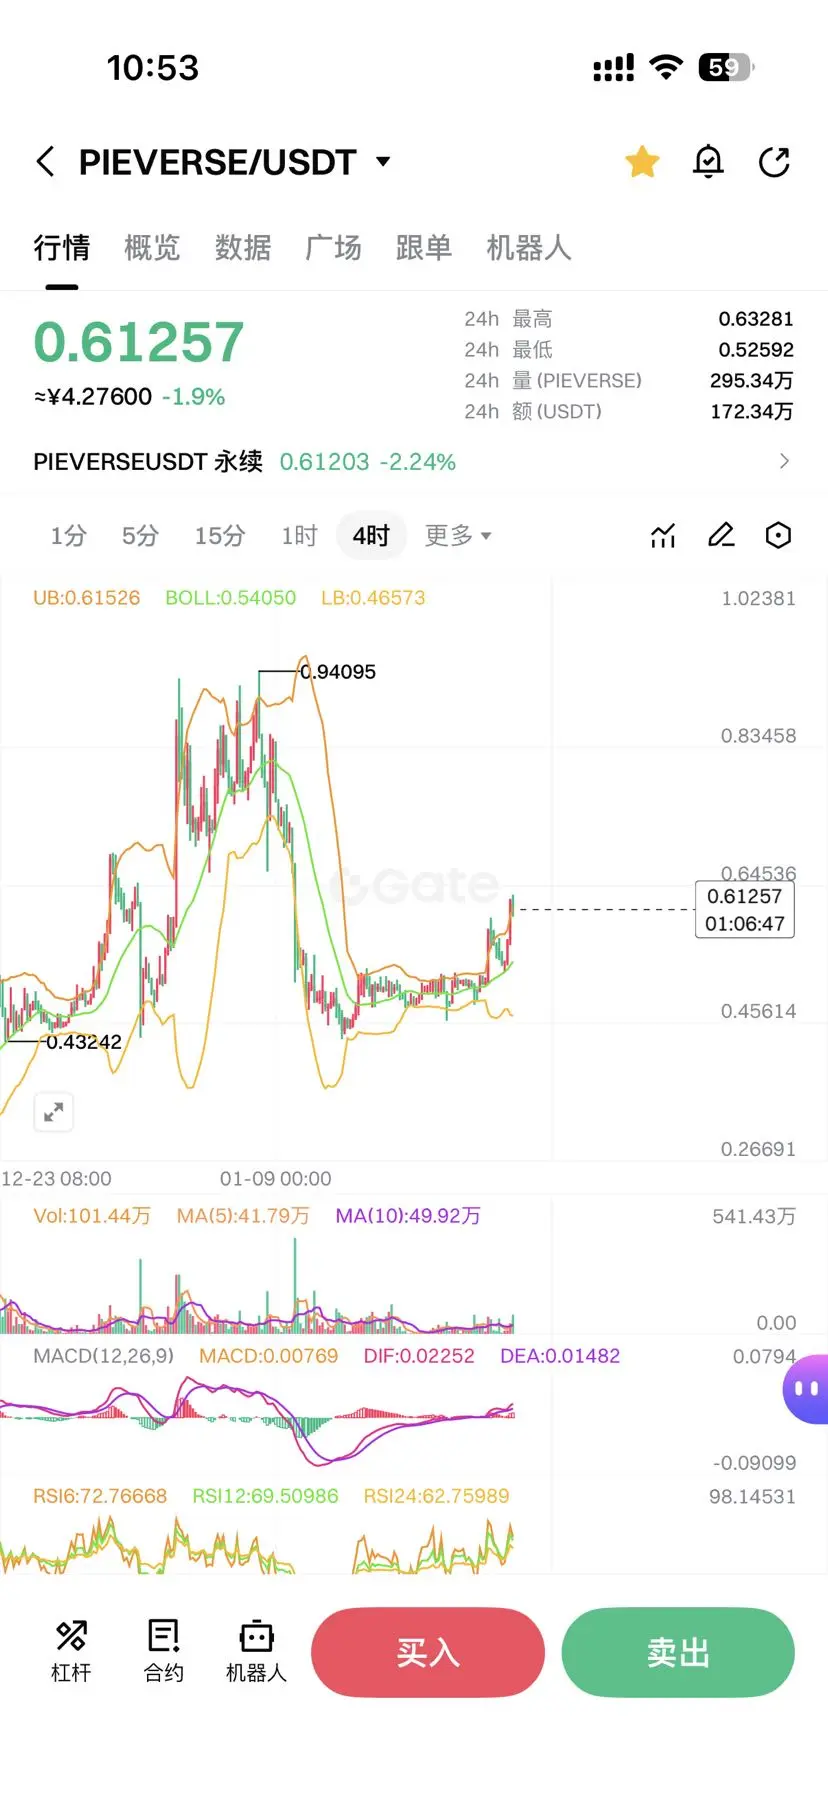
The Strongest War God applies to enter the battle
The first time missed out on 0.1 aia, this time you seized the opportunity
Quickly enter the market to grab chips
Aim for doubling
pleverse 0.06 initial position If there is a pullback to 0.055, add to the position
The first time missed out on 0.1 aia, this time you seized the opportunity
Quickly enter the market to grab chips
Aim for doubling
pleverse 0.06 initial position If there is a pullback to 0.055, add to the position
AIA30,62%
- Reward
- 3
- Comment
- Repost
- Share
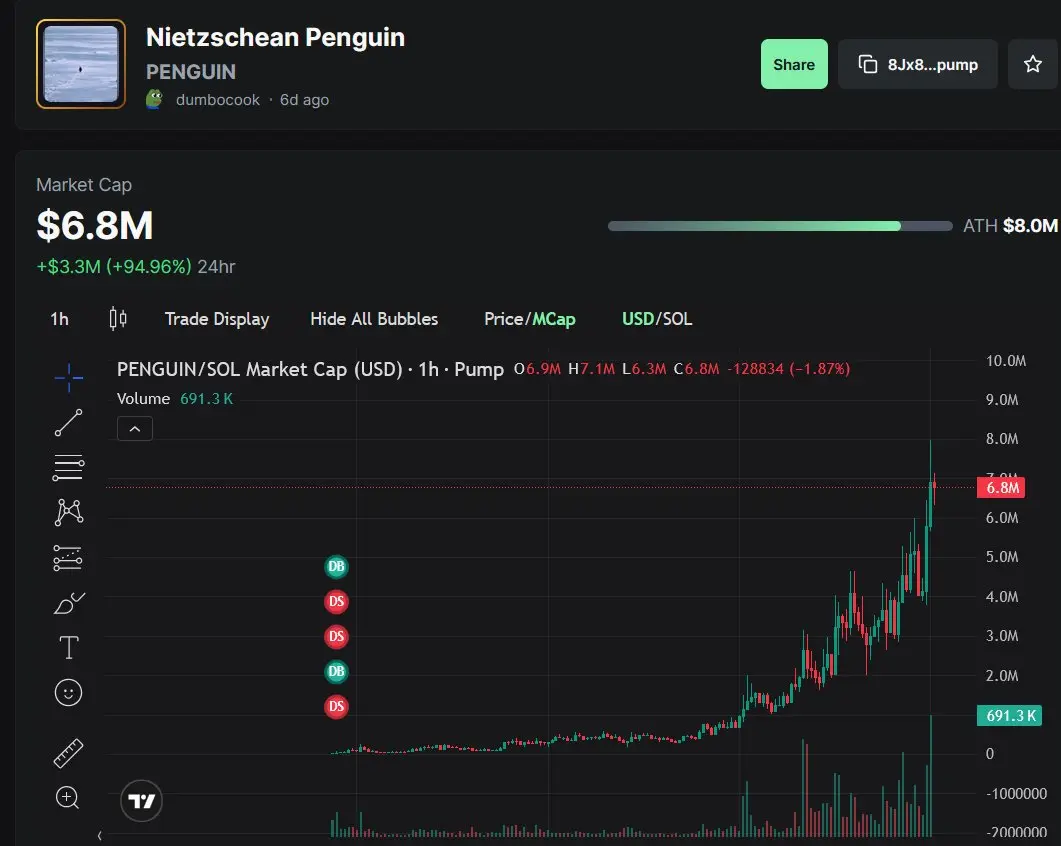
What happens with $PENGUIN . Congratulations to the community
- Reward
- like
- Comment
- Repost
- Share
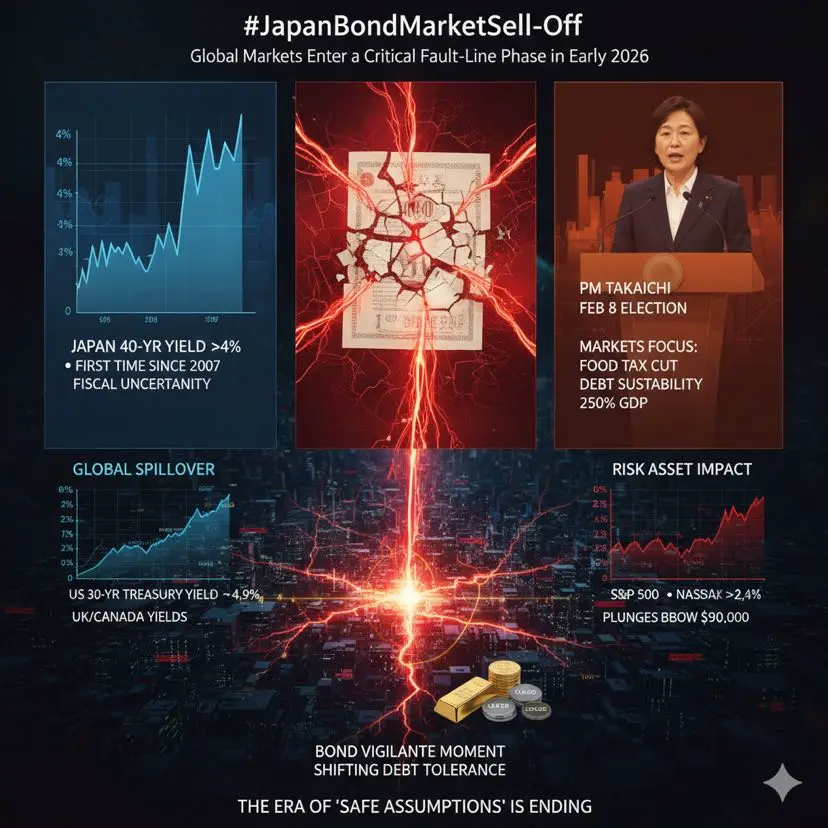
#JapanBondMarketSell-Off
Forcing a Global Repricing of Risk in 2026
The recent disruption in Japan’s government bond market is no longer being viewed as a local anomaly but as a structural signal for the global financial system. For decades, Japan functioned as the world’s yield suppressor, exporting cheap capital and anchoring global interest rate expectations. That role is now under pressure as long-dated Japanese Government Bond yields push into territory unseen in nearly two decades, signaling that one of the last pillars of ultra-low rates is weakening. The sharp rise in 40-year JGB yiel
- Reward
- 2
- Comment
- Repost
- Share
#GateTradFi1gGoldGiveaway
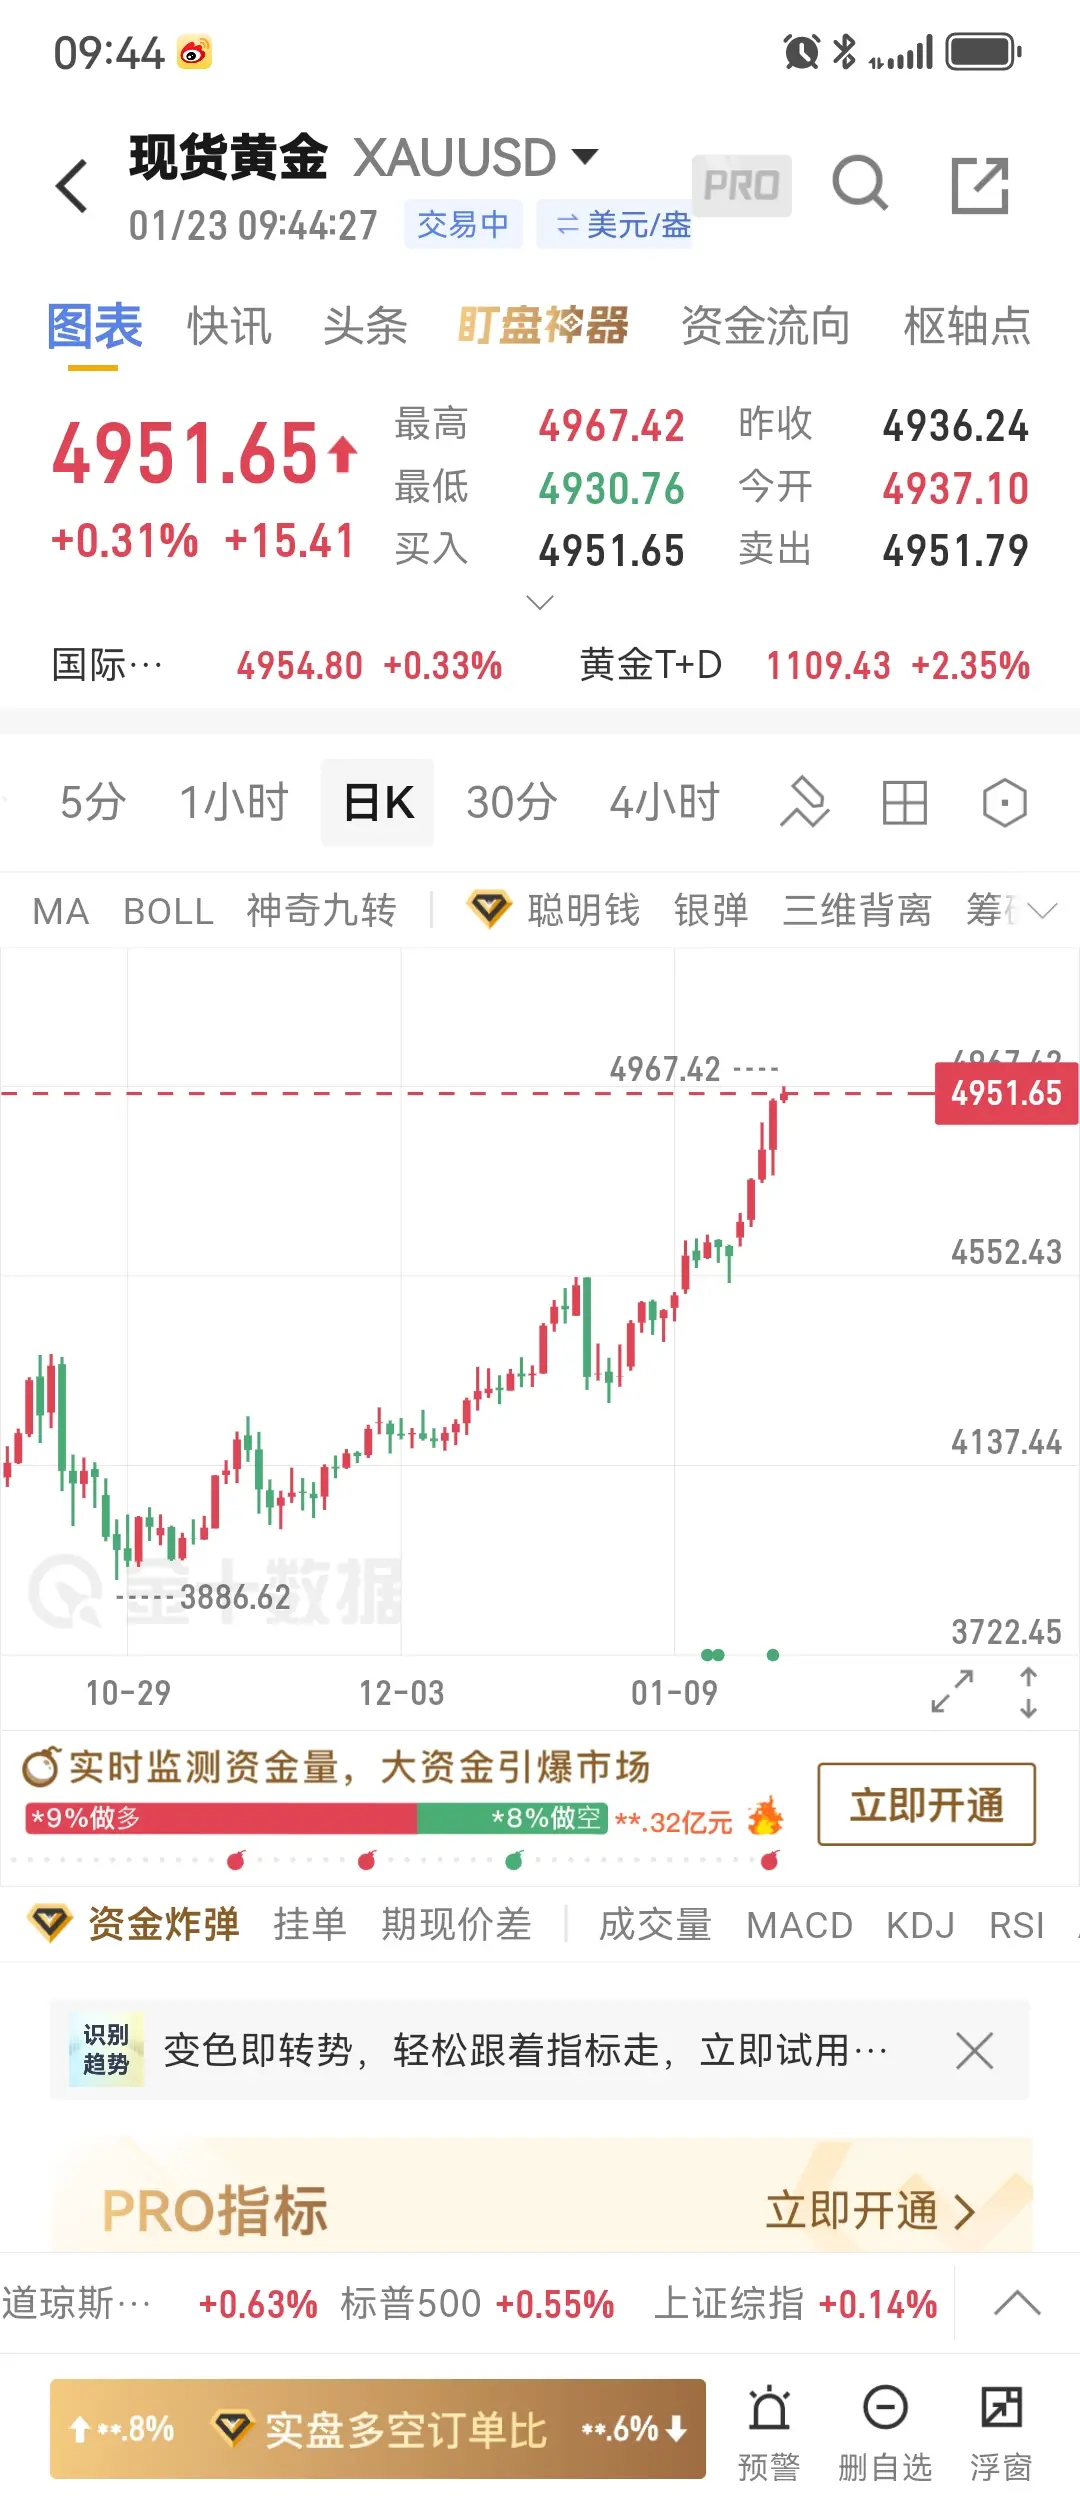
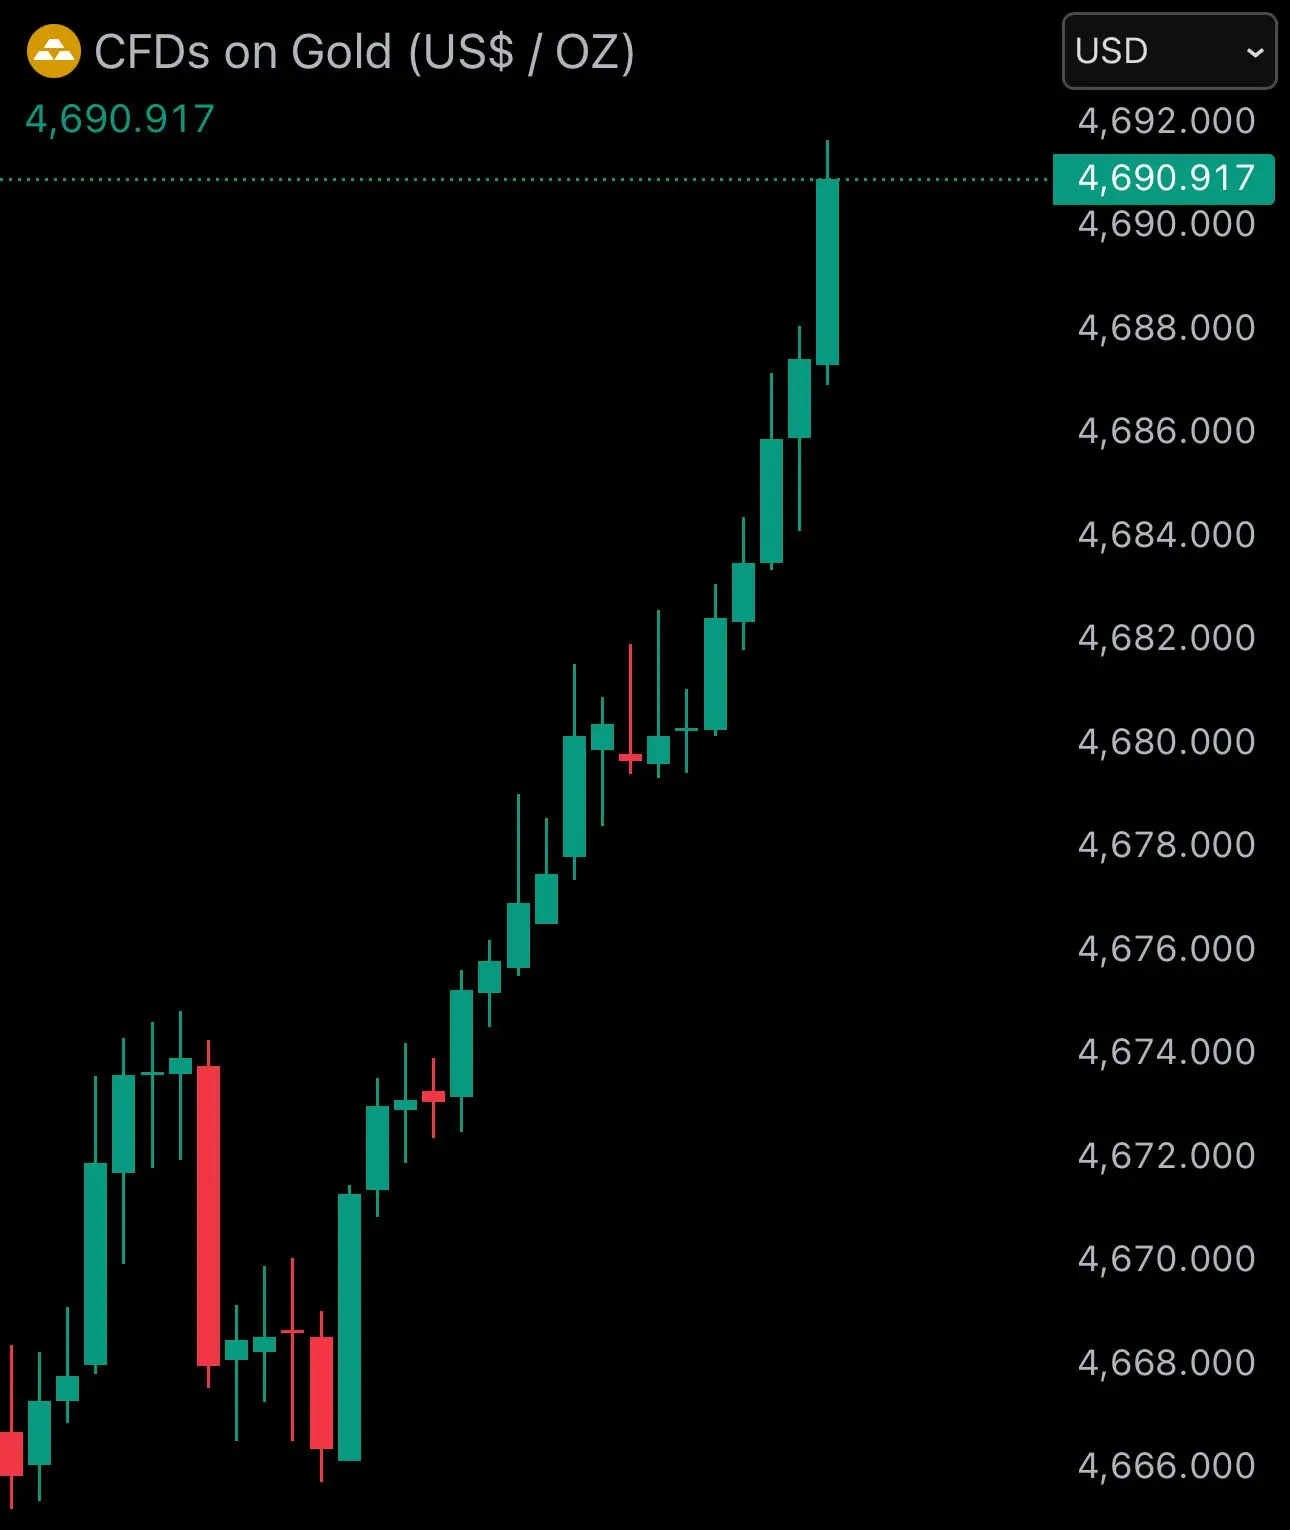
Gate TradFi 1g Gold Giveaway Yusfirah’s Deep Dive on Maximizing Daily Trading for Real Gold Rewards
As I see it, Gate’s TradFi 1g Gold Giveaway is more than just a fun promotional event it’s an innovative way for traders to merge daily trading activity with tangible, high-value rewards. With gold prices remaining strong and market volatility offering opportunities for careful trading, this program allows participants to translate trading discipline directly into real-world value. Traders can earn a gold draw every 10 minutes through TradFi, and by participating consi

- Reward
- 1
- 2
- Repost
- Share
EagleEye :
:
2026 GOGOGO 👊View More
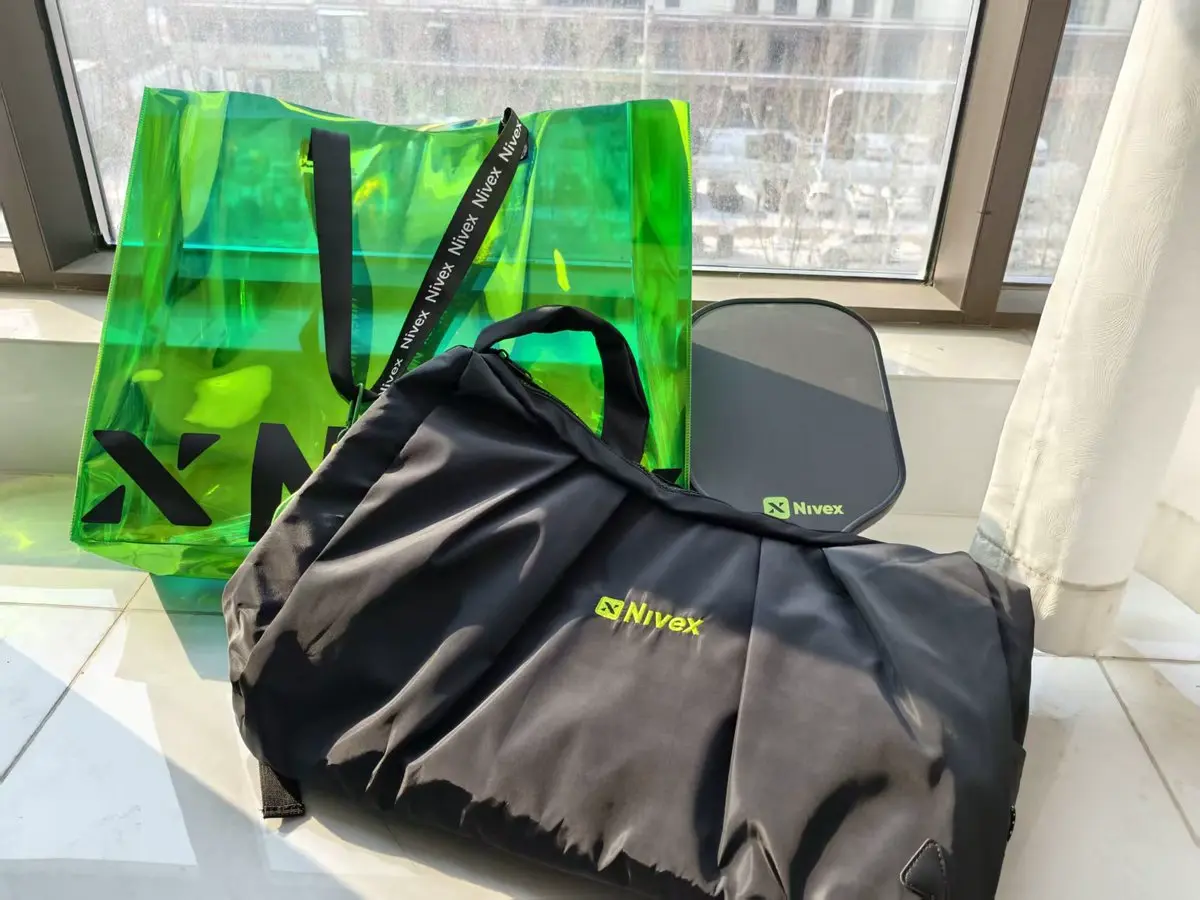
I want to dye this thing green
Thank you, sister Miya, for the merchandise and the green hat 😜
@miyayweb3 & @nx_Labs
View OriginalThank you, sister Miya, for the merchandise and the green hat 😜
@miyayweb3 & @nx_Labs


- Reward
- like
- Comment
- Repost
- Share
#GateTradFi1gGoldGiveaway
Gate TradFi 1g Gold Giveaway is shaping a new way for traders to connect trading activity with real-world value. Instead of only digital rewards, this campaign offers something timeless — real physical gold — which naturally attracts traders who think long term and value stability alongside innovation.
The beauty of this campaign is its simplicity. Traders don’t need to complete complicated missions or technical challenges. By actively placing eligible TradFi trades and sharing their trading journey, users automatically become part of the giveaway. This makes partici
- Reward
- 1
- 1
- Repost
- Share
Gate.io:
Happy New Year! 🤑星星之火
星星之火
Created By@gatefunuser_936d
Listing Progress
100.00%
MC:
$4.19K
Create My Token
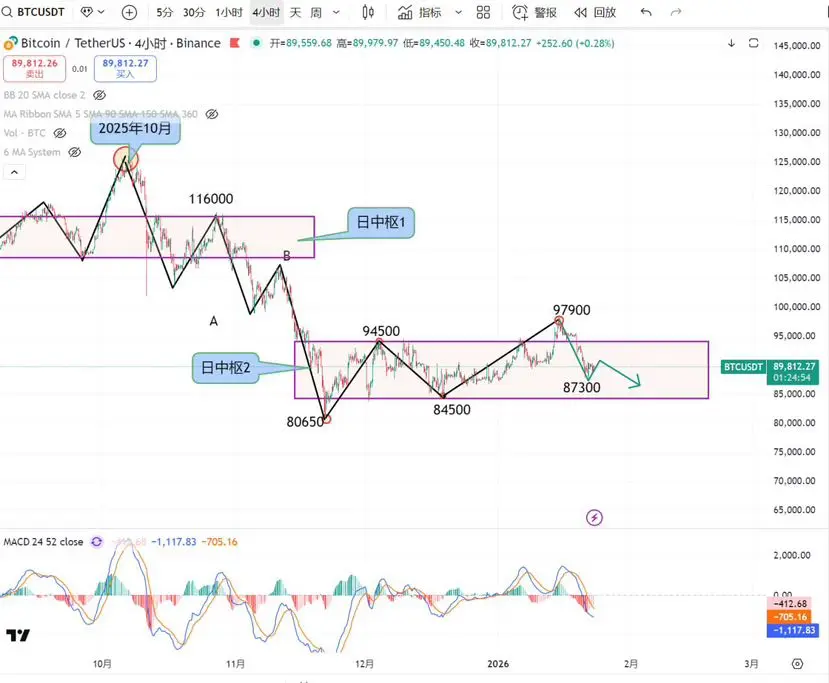
Overnight US economic data was strong, market risk appetite slightly recovered, and US stocks filled the 1.19 gap.
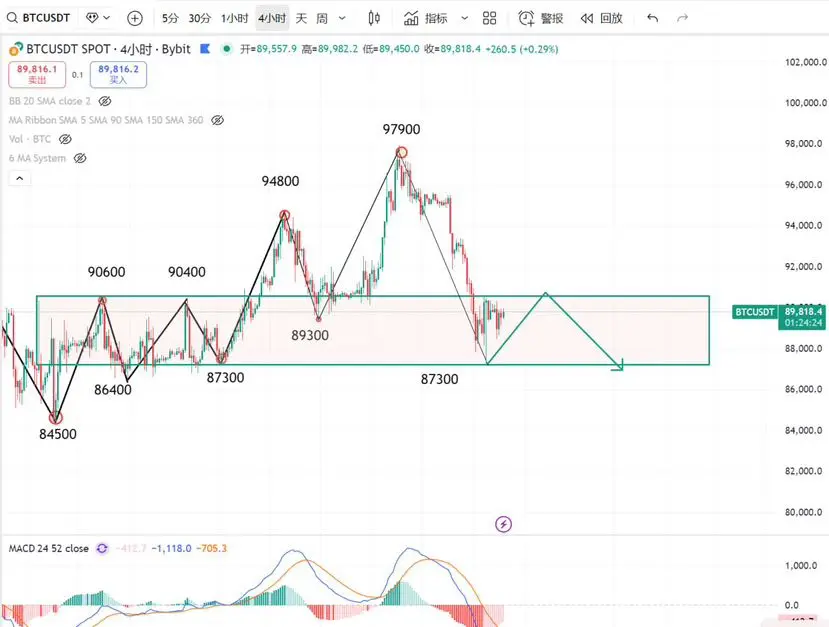
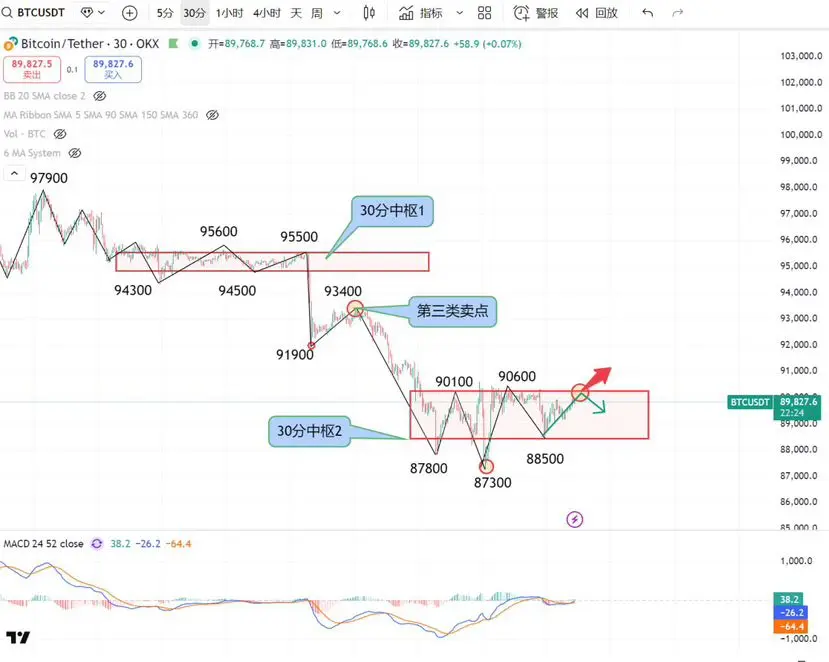
Bitcoin's 5-day moving average pressure has dropped to around 90,000, with the daily chart continuing to operate within the 84,500-94,500 range; the correction starting from 97,900 on the 4-hour chart was completed at 87,300 as the first downward wave, and currently it is in the 4-hour upward wave starting from 87,300. After this wave completes, there will be another downward wave on the 4-hour chart; the 30-minute chart is temporarily operating within the 88,500-90,100 range of t
View OriginalBitcoin's 5-day moving average pressure has dropped to around 90,000, with the daily chart continuing to operate within the 84,500-94,500 range; the correction starting from 97,900 on the 4-hour chart was completed at 87,300 as the first downward wave, and currently it is in the 4-hour upward wave starting from 87,300. After this wave completes, there will be another downward wave on the 4-hour chart; the 30-minute chart is temporarily operating within the 88,500-90,100 range of t
- Reward
- 2
- Comment
- Repost
- Share
#WarshLeadsFedChairRace Who Is Kevin Warsh — and Why Is His Name Suddenly Dominating Markets? As speculation intensifies around the future leadership of the U.S. Federal Reserve, one name has rapidly moved to the center of global market attention: Kevin Warsh. What began as quiet political discussion has now evolved into a serious macro narrative capable of influencing interest rates, liquidity, and risk assets worldwide. Kevin Warsh is not a new figure in monetary policy. He served on the Federal Reserve Board from 2006 to 2011, placing him directly at the center of the 2008 global financial

- Reward
- 1
- Comment
- Repost
- Share
🔹 A mysterious whale keeps accumulating, pushing Ethereum holdings past 80,000 ETH — confidence still intact?
397
- Reward
- like
- Comment
- Repost
- Share
Do you believe in promotions that give gifts for recharging phone credits?
I was just playing on my phone when China Unicom called me and said there's a promotion offering gifts for recharging, and I can participate at any offline store. I asked if county-level stores are eligible, and she said yes. Then I asked when the promotion ends. She said as long as I participate by the end of the month, it's fine.
By the way, have you ever participated in similar promotions? What kind of gifts do they usually give? I hope they won't ask me to upgrade my plan again at the store. My current plan cost
View OriginalI was just playing on my phone when China Unicom called me and said there's a promotion offering gifts for recharging, and I can participate at any offline store. I asked if county-level stores are eligible, and she said yes. Then I asked when the promotion ends. She said as long as I participate by the end of the month, it's fine.
By the way, have you ever participated in similar promotions? What kind of gifts do they usually give? I hope they won't ask me to upgrade my plan again at the store. My current plan cost

- Reward
- like
- Comment
- Repost
- Share
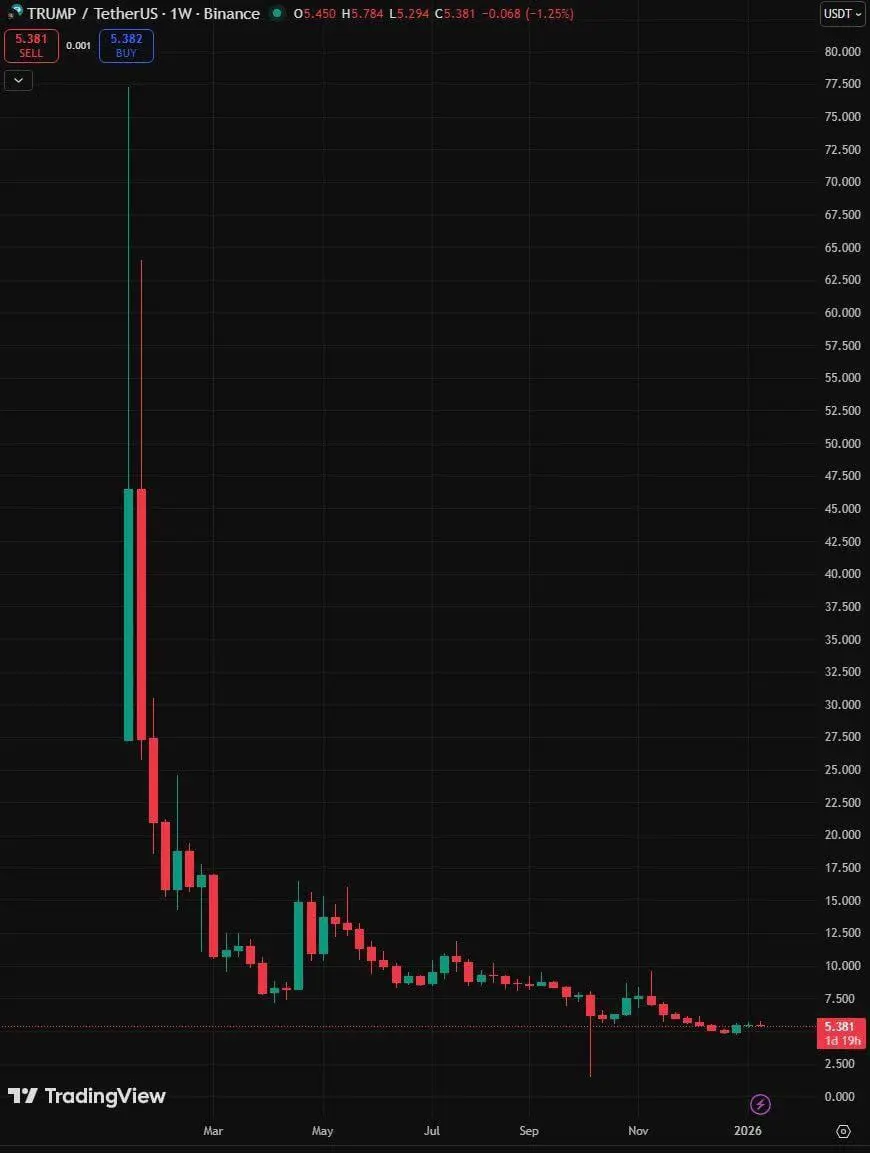
Viewing the Top Market Coins Spot Chart and comparing them
1
- Reward
- 1
- Comment
- Repost
- Share
Let's look at some highlights\nPre-production sample of the backpack\nQ3 products
View Original

- Reward
- like
- Comment
- Repost
- Share
#RIVER Prepare for a big drop, run! I see the whale's address is dumping, run run run! Prepare for a 50% drop tonight.
View Original

- Reward
- like
- Comment
- Repost
- Share
Load More
Join 40M users in our growing community
⚡️ Join 40M users in the crypto craze discussion
💬 Engage with your favorite top creators
👍 See what interests you
Trending Topics
View More66.14K Popularity
45.39K Popularity
27.14K Popularity
71.91K Popularity
348.69K Popularity
Hot Gate Fun
View More- MC:$0.1Holders:10.00%
- MC:$3.4KHolders:10.00%
- MC:$0.1Holders:10.00%
- MC:$3.4KHolders:10.00%
- MC:$3.4KHolders:10.00%
News
View MoreCosmos Labs Co-CEO reveals talks with Circle
1 m
New Wallet Withdraws $2.56M in SOL from CEX for Meme Token Purchases
4 m
Sky has removed the SPK rewards for staking SKY, which combined with buybacks can reduce the net issuance of SPK by 40%.
6 m
The Bank of Japan maintains interest rates at 0.75%, in line with market expectations
11 m
Data: US XRP spot ETF total net inflow on the day is 2.09 million USD
13 m
Pin