WAM vs DYDX: A Comparative Analysis of Decentralized Trading Platforms
Introduction: WAM vs DYDX Investment Comparison
In the cryptocurrency market, the comparison between WAM and DYDX has always been an unavoidable topic for investors. The two not only have significant differences in market cap ranking, application scenarios, and price performance, but also represent different crypto asset positioning.
WAM (WAM): Since its launch, it has gained market recognition for its play-to-earn gaming platform.
DYDX (DYDX): Launched in 2021, it has been hailed as a decentralized derivatives trading protocol, and is one of the most traded cryptocurrencies globally.
This article will comprehensively analyze the investment value comparison between WAM and DYDX, focusing on historical price trends, supply mechanisms, institutional adoption, technological ecosystems, and future predictions, attempting to answer the question investors care about most:
"Which is the better buy right now?"
I. Price History Comparison and Current Market Status
WAM and DYDX Historical Price Trends
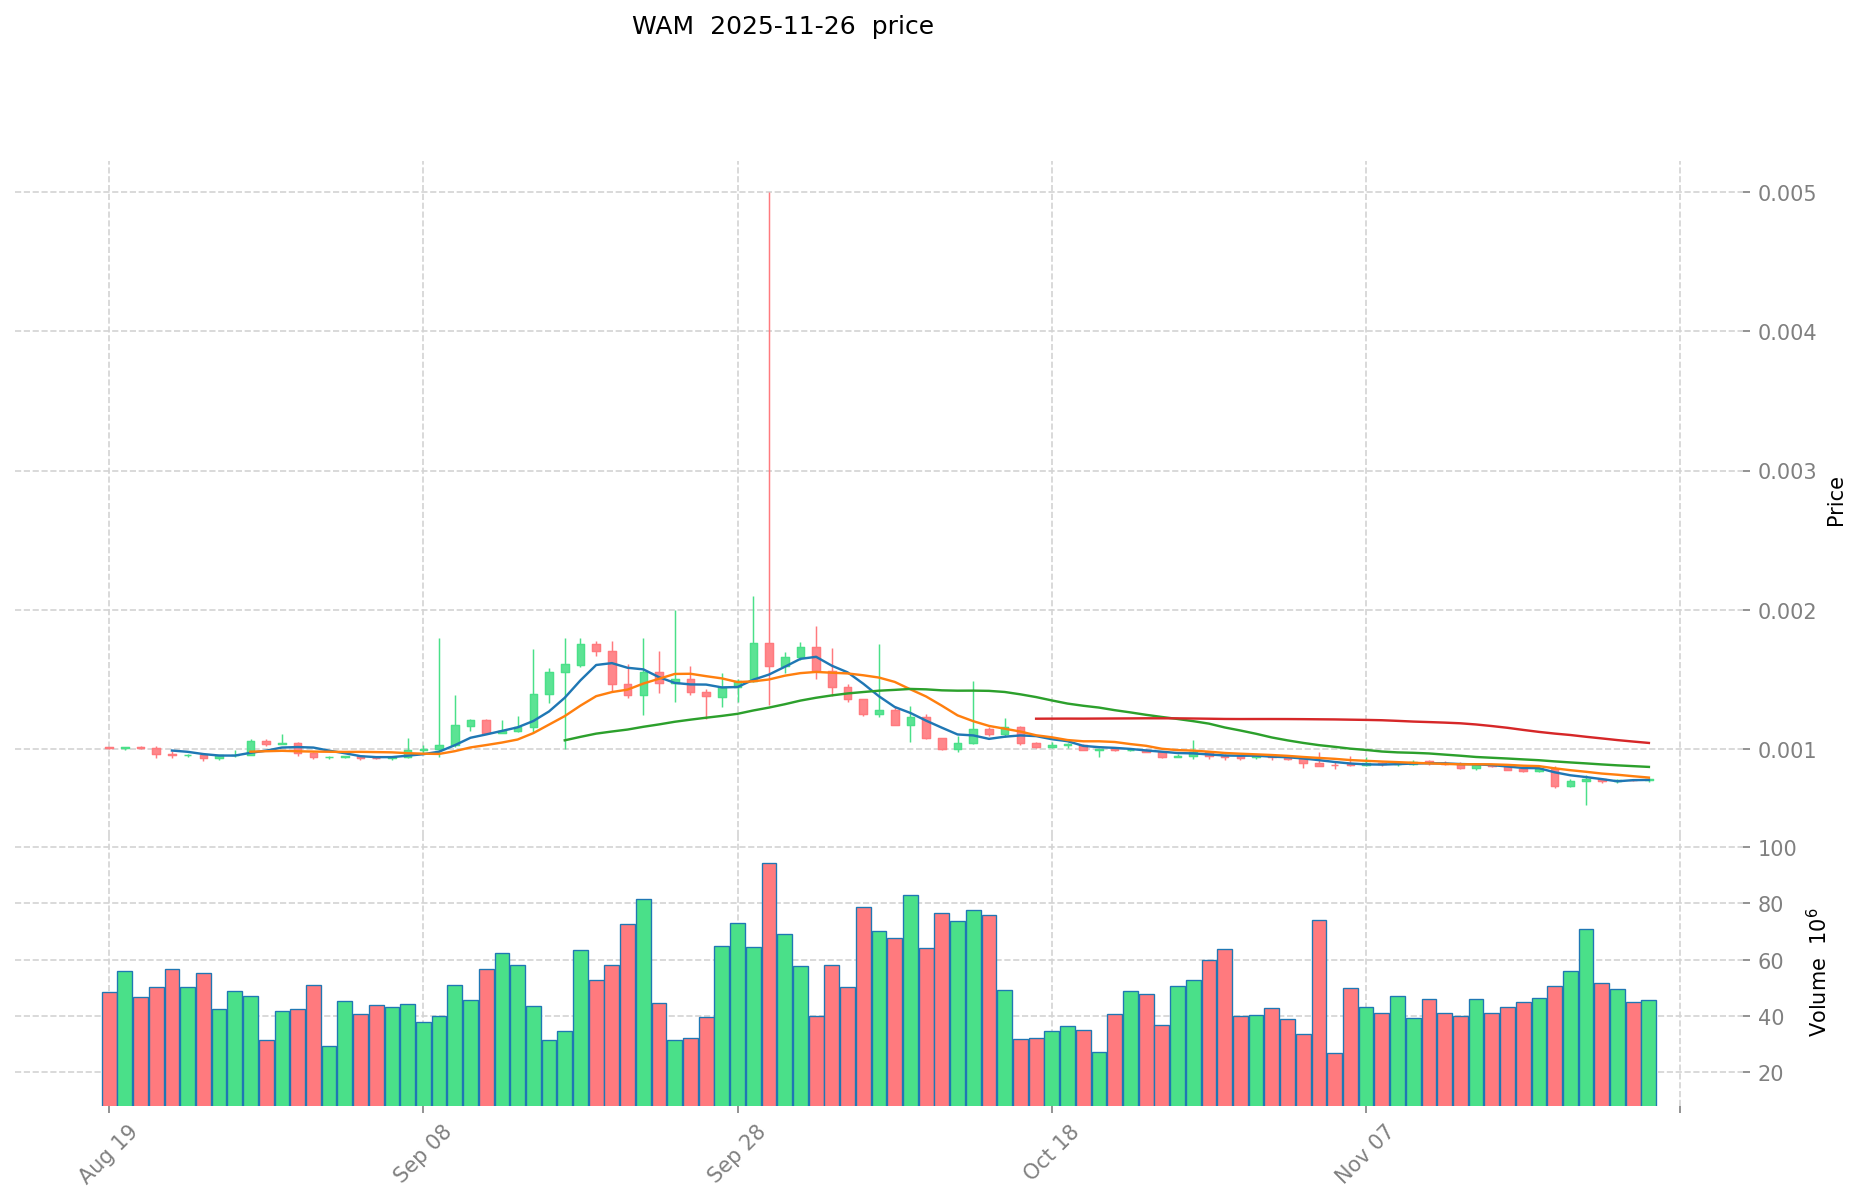
- 2021: WAM reached its all-time high of $0.194038 on December 20, 2021.
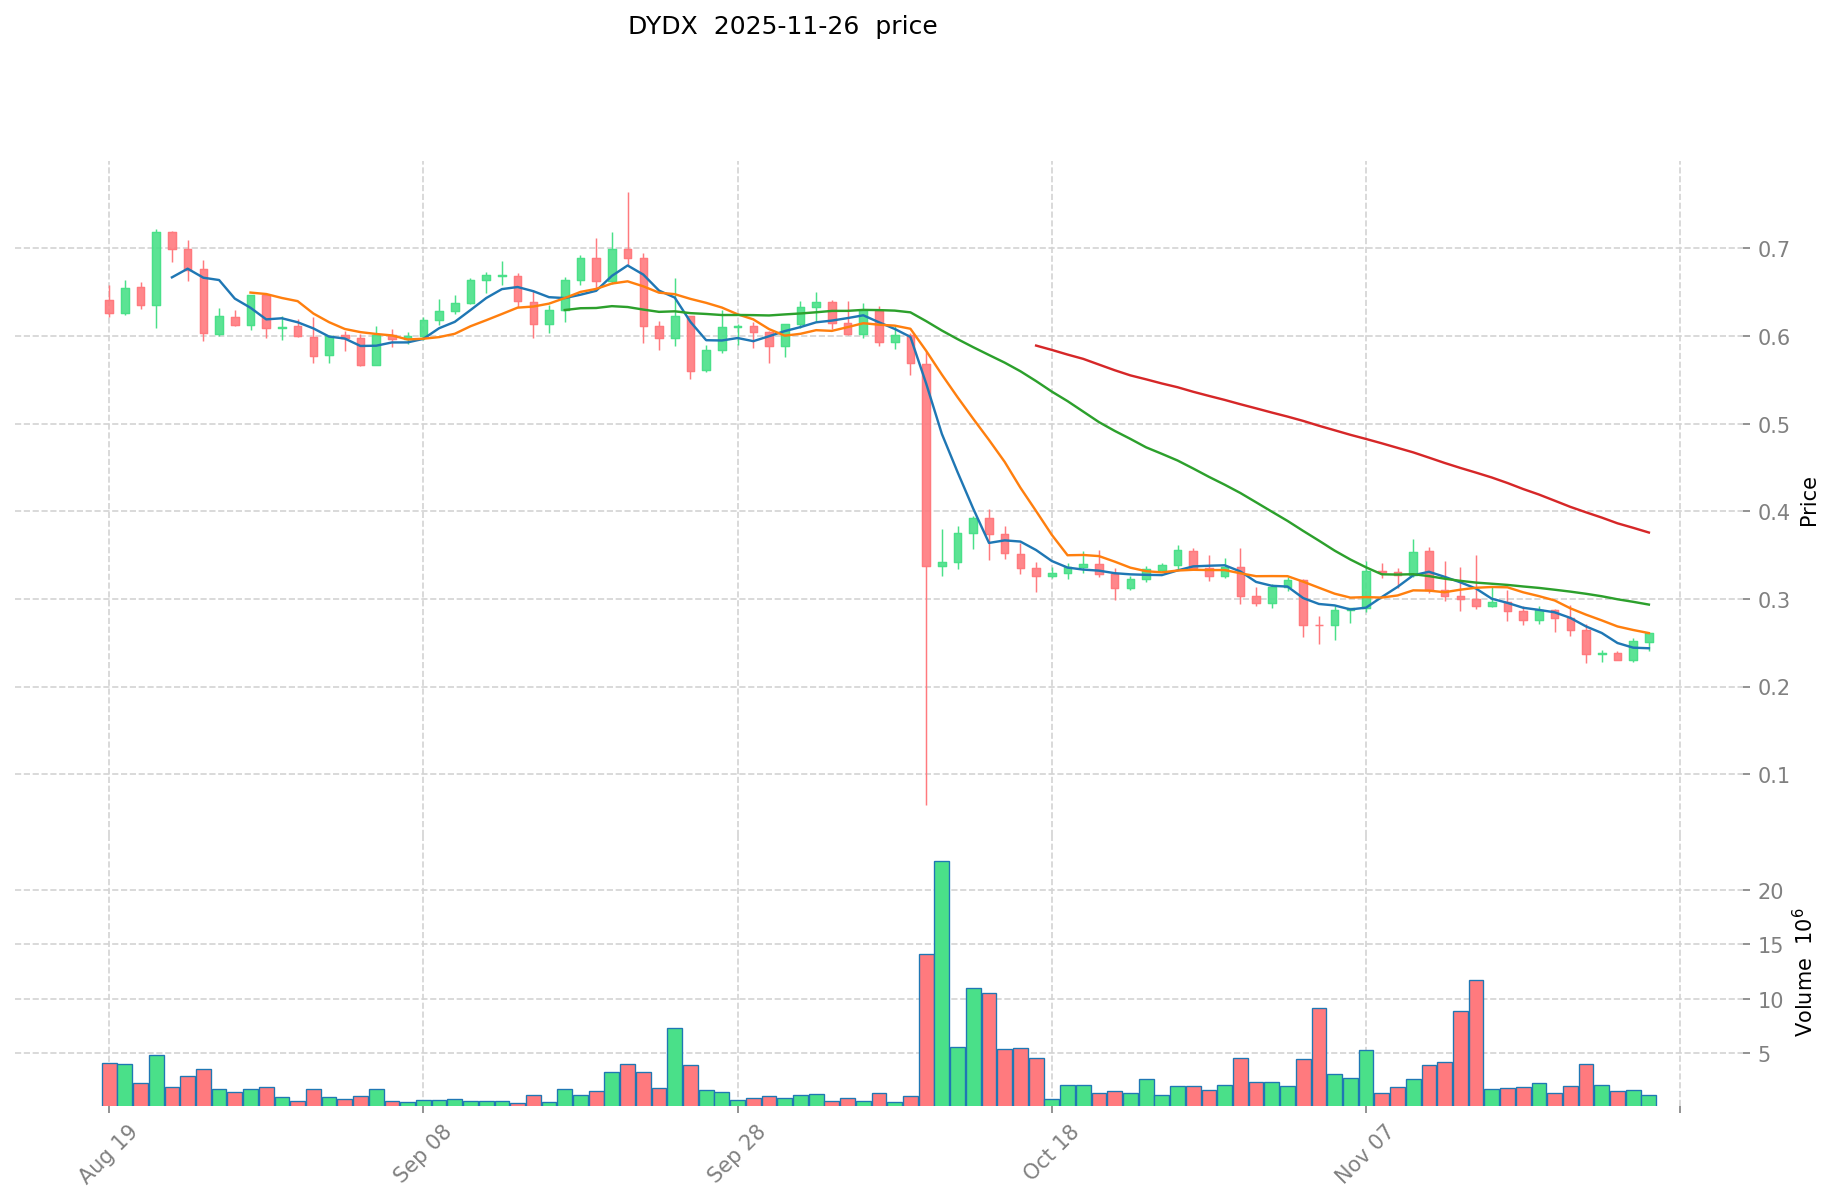
- 2024: DYDX hit its all-time high of $4.52 on March 8, 2024.
- Comparative Analysis: In the current market cycle, WAM has fallen from its all-time high to a current price of $0.0007787, while DYDX has dropped from its peak to $0.2582.
Current Market Situation (2025-11-27)
- WAM current price: $0.0007787
- DYDX current price: $0.2582
- 24-hour trading volume: WAM $25,919.51 vs DYDX $686,021.64
- Market Sentiment Index (Fear & Greed Index): 20 (Extreme Fear)
Click to view real-time prices:
- View WAM current price Market Price
- View DYDX current price Market Price
II. Core Factors Affecting Investment Value of WAM vs DYDX
Supply Mechanisms Comparison (Tokenomics)
-
WAM: Fixed supply model with a cap of 1 billion tokens, designed to become more scarce over time
-
DYDX: Emission-based model with trading rewards and staking incentives, following a gradual release schedule
-
📌 Historical pattern: Fixed supply models like WAM's tend to create stronger price appreciation during bull markets, while DYDX's reward-based distribution can sustain community engagement through market cycles.
Institutional Adoption and Market Applications
- Institutional holdings: DYDX has attracted more institutional interest due to its established perpetual trading platform and longer market presence
- Enterprise adoption: DYDX has stronger adoption in professional trading firms utilizing decentralized perpetual contracts, while WAM is positioning for broader DeFi ecosystem integration
- Regulatory attitudes: Both face similar regulatory challenges as decentralized trading platforms, though DYDX's longer operational history has established clearer regulatory positioning
Technical Development and Ecosystem Building
- WAM technical upgrades: Implementing cross-chain interoperability to expand user base beyond Arbitrum and enhance multi-chain liquidity
- DYDX technical development: Migration to its own blockchain built on Cosmos, enabling greater throughput and reduced transaction costs
- Ecosystem comparison: DYDX has a more established trading ecosystem with higher trading volumes, while WAM offers additional DeFi capabilities including liquidity provision and yield generation opportunities
Macroeconomic Factors and Market Cycles
- Performance during inflation: Both tokens primarily respond to crypto market cycles rather than serving as inflation hedges
- Macroeconomic monetary policy: Interest rate changes affect trading volume and liquidity across both platforms, with higher rates typically reducing overall crypto trading activity
- Geopolitical factors: Regulatory crackdowns on centralized exchanges can drive users to decentralized platforms like WAM and DYDX, creating potential adoption catalysts
III. 2025-2030 Price Prediction: WAM vs DYDX
Short-term Prediction (2025)
- WAM: Conservative $0.000420444 - $0.0007786 | Optimistic $0.0007786 - $0.00105111
- DYDX: Conservative $0.13209 - $0.259 | Optimistic $0.259 - $0.29785
Mid-term Prediction (2027)
- WAM may enter a growth phase, with prices estimated between $0.000593740895 and $0.001435773437
- DYDX may enter a consolidation phase, with prices estimated between $0.27952477875 and $0.3861476325
- Key drivers: Institutional capital inflow, ETF developments, ecosystem growth
Long-term Prediction (2030)
- WAM: Base scenario $0.001382194162827 - $0.001749612864338 | Optimistic scenario $0.001749612864338 - $0.002309488980926
- DYDX: Base scenario $0.210394479832582 - $0.362749103159625 | Optimistic scenario $0.362749103159625 - $0.402651504507183
Disclaimer: This analysis is based on historical data and projections. Cryptocurrency markets are highly volatile and unpredictable. Always conduct your own research before making investment decisions.
WAM:
| 年份 | 预测最高价 | 预测平均价格 | 预测最低价 | 涨跌幅 |
|---|---|---|---|---|
| 2025 | 0.00105111 | 0.0007786 | 0.000420444 | 0 |
| 2026 | 0.0012442028 | 0.000914855 | 0.000731884 | 17 |
| 2027 | 0.001435773437 | 0.0010795289 | 0.000593740895 | 38 |
| 2028 | 0.001622370007365 | 0.0012576511685 | 0.000842626282895 | 61 |
| 2029 | 0.002059215140743 | 0.001440010587932 | 0.001123208258587 | 84 |
| 2030 | 0.002309488980926 | 0.001749612864338 | 0.001382194162827 | 124 |
DYDX:
| 年份 | 预测最高价 | 预测平均价格 | 预测最低价 | 涨跌幅 |
|---|---|---|---|---|
| 2025 | 0.29785 | 0.259 | 0.13209 | 0 |
| 2026 | 0.29791475 | 0.278425 | 0.25893525 | 7 |
| 2027 | 0.3861476325 | 0.288169875 | 0.27952477875 | 11 |
| 2028 | 0.3472735163625 | 0.33715875375 | 0.262983827925 | 30 |
| 2029 | 0.383282071263 | 0.34221613505625 | 0.181374551579812 | 32 |
| 2030 | 0.402651504507183 | 0.362749103159625 | 0.210394479832582 | 40 |
IV. Investment Strategy Comparison: WAM vs DYDX
Long-term vs Short-term Investment Strategies
- WAM: Suitable for investors focused on gaming ecosystems and DeFi potential
- DYDX: Suitable for investors interested in decentralized derivatives trading and established protocols
Risk Management and Asset Allocation
- Conservative investors: WAM: 20% vs DYDX: 80%
- Aggressive investors: WAM: 40% vs DYDX: 60%
- Hedging tools: Stablecoin allocation, options, cross-token portfolios
V. Potential Risk Comparison
Market Risk
- WAM: Higher volatility due to smaller market cap and emerging ecosystem
- DYDX: Exposed to fluctuations in derivatives trading volume and overall crypto market sentiment
Technical Risk
- WAM: Scalability challenges, network stability during high-traffic gaming periods
- DYDX: Smart contract vulnerabilities, potential issues during blockchain migration
Regulatory Risk
- Global regulatory policies may impact both tokens, with DYDX potentially facing more scrutiny due to its derivatives focus
VI. Conclusion: Which Is the Better Buy?
📌 Investment Value Summary:
- WAM advantages: Growth potential in gaming and DeFi sectors, fixed supply model
- DYDX advantages: Established derivatives platform, institutional adoption, upcoming blockchain migration
✅ Investment Advice:
- New investors: Consider a smaller allocation to DYDX for exposure to decentralized trading
- Experienced investors: Balanced portfolio with both WAM and DYDX to capture different market segments
- Institutional investors: Focus on DYDX for its established platform and potential for increased trading volumes
⚠️ Risk Warning: Cryptocurrency markets are highly volatile. This article does not constitute investment advice. None
VII. FAQ
Q1: What are the main differences between WAM and DYDX? A: WAM is focused on a play-to-earn gaming platform with a fixed supply model, while DYDX is a decentralized derivatives trading protocol with an emission-based token model. WAM has a smaller market cap and is newer to the market, whereas DYDX has a more established presence in the decentralized finance space.
Q2: Which token has performed better historically? A: DYDX has shown better historical performance, reaching its all-time high of $4.52 in March 2024, while WAM's all-time high was $0.194038 in December 2021. Currently, DYDX is trading at a higher price point of $0.2582 compared to WAM's $0.0007787.
Q3: How do the supply mechanisms of WAM and DYDX differ? A: WAM has a fixed supply model with a cap of 1 billion tokens, designed to become more scarce over time. DYDX follows an emission-based model with trading rewards and staking incentives, following a gradual release schedule.
Q4: Which token has attracted more institutional interest? A: DYDX has attracted more institutional interest due to its established perpetual trading platform and longer market presence. It has stronger adoption in professional trading firms utilizing decentralized perpetual contracts.
Q5: What are the key technical developments for each token? A: WAM is implementing cross-chain interoperability to expand its user base beyond Arbitrum and enhance multi-chain liquidity. DYDX is migrating to its own blockchain built on Cosmos, enabling greater throughput and reduced transaction costs.
Q6: How do the long-term price predictions for WAM and DYDX compare? A: By 2030, WAM's base scenario price range is predicted to be $0.001382194162827 - $0.001749612864338, while DYDX's base scenario range is $0.210394479832582 - $0.362749103159625. DYDX is expected to maintain a higher price point, but WAM shows potential for significant percentage growth from its current lower price.
Q7: What are the recommended investment strategies for WAM and DYDX? A: For conservative investors, a portfolio allocation of 20% WAM and 80% DYDX is suggested. For aggressive investors, the recommendation is 40% WAM and 60% DYDX. New investors might consider starting with a smaller allocation to DYDX for exposure to decentralized trading, while experienced investors could balance their portfolio with both tokens to capture different market segments.
Share
Content
Introduction: WAM vs DYDX Investment Comparison
I. Price History Comparison and Current Market Status
II. Core Factors Affecting Investment Value of WAM vs DYDX
III. 2025-2030 Price Prediction: WAM vs DYDX
IV. Investment Strategy Comparison: WAM vs DYDX
V. Potential Risk Comparison
VI. Conclusion: Which Is the Better Buy?
VII. FAQ

