STT vs ENJ: A Comparative Analysis of Two Leading Blockchain Gaming Platforms
Introduction: STT vs ENJ Investment Comparison
In the cryptocurrency market, the comparison between Statter Network (STT) and Enjin Coin (ENJ) has been an unavoidable topic for investors. The two not only show significant differences in market cap ranking, application scenarios, and price performance but also represent different positioning in the crypto asset space.
Statter Network (STT): Launched in 2023, it has gained market recognition for its focus on providing full-service infrastructure for the metaverse ecosystem.
Enjin Coin (ENJ): Introduced in 2017, it has been hailed as a pioneer in blockchain-based gaming, becoming one of the most widely recognized cryptocurrencies in the gaming and virtual goods sector.
This article will provide a comprehensive analysis of the investment value comparison between STT and ENJ, focusing on historical price trends, supply mechanisms, institutional adoption, technological ecosystems, and future predictions, attempting to answer the question investors are most concerned about:
"Which is the better buy right now?"
I. Price History Comparison and Current Market Status
STT and ENJ Historical Price Trends
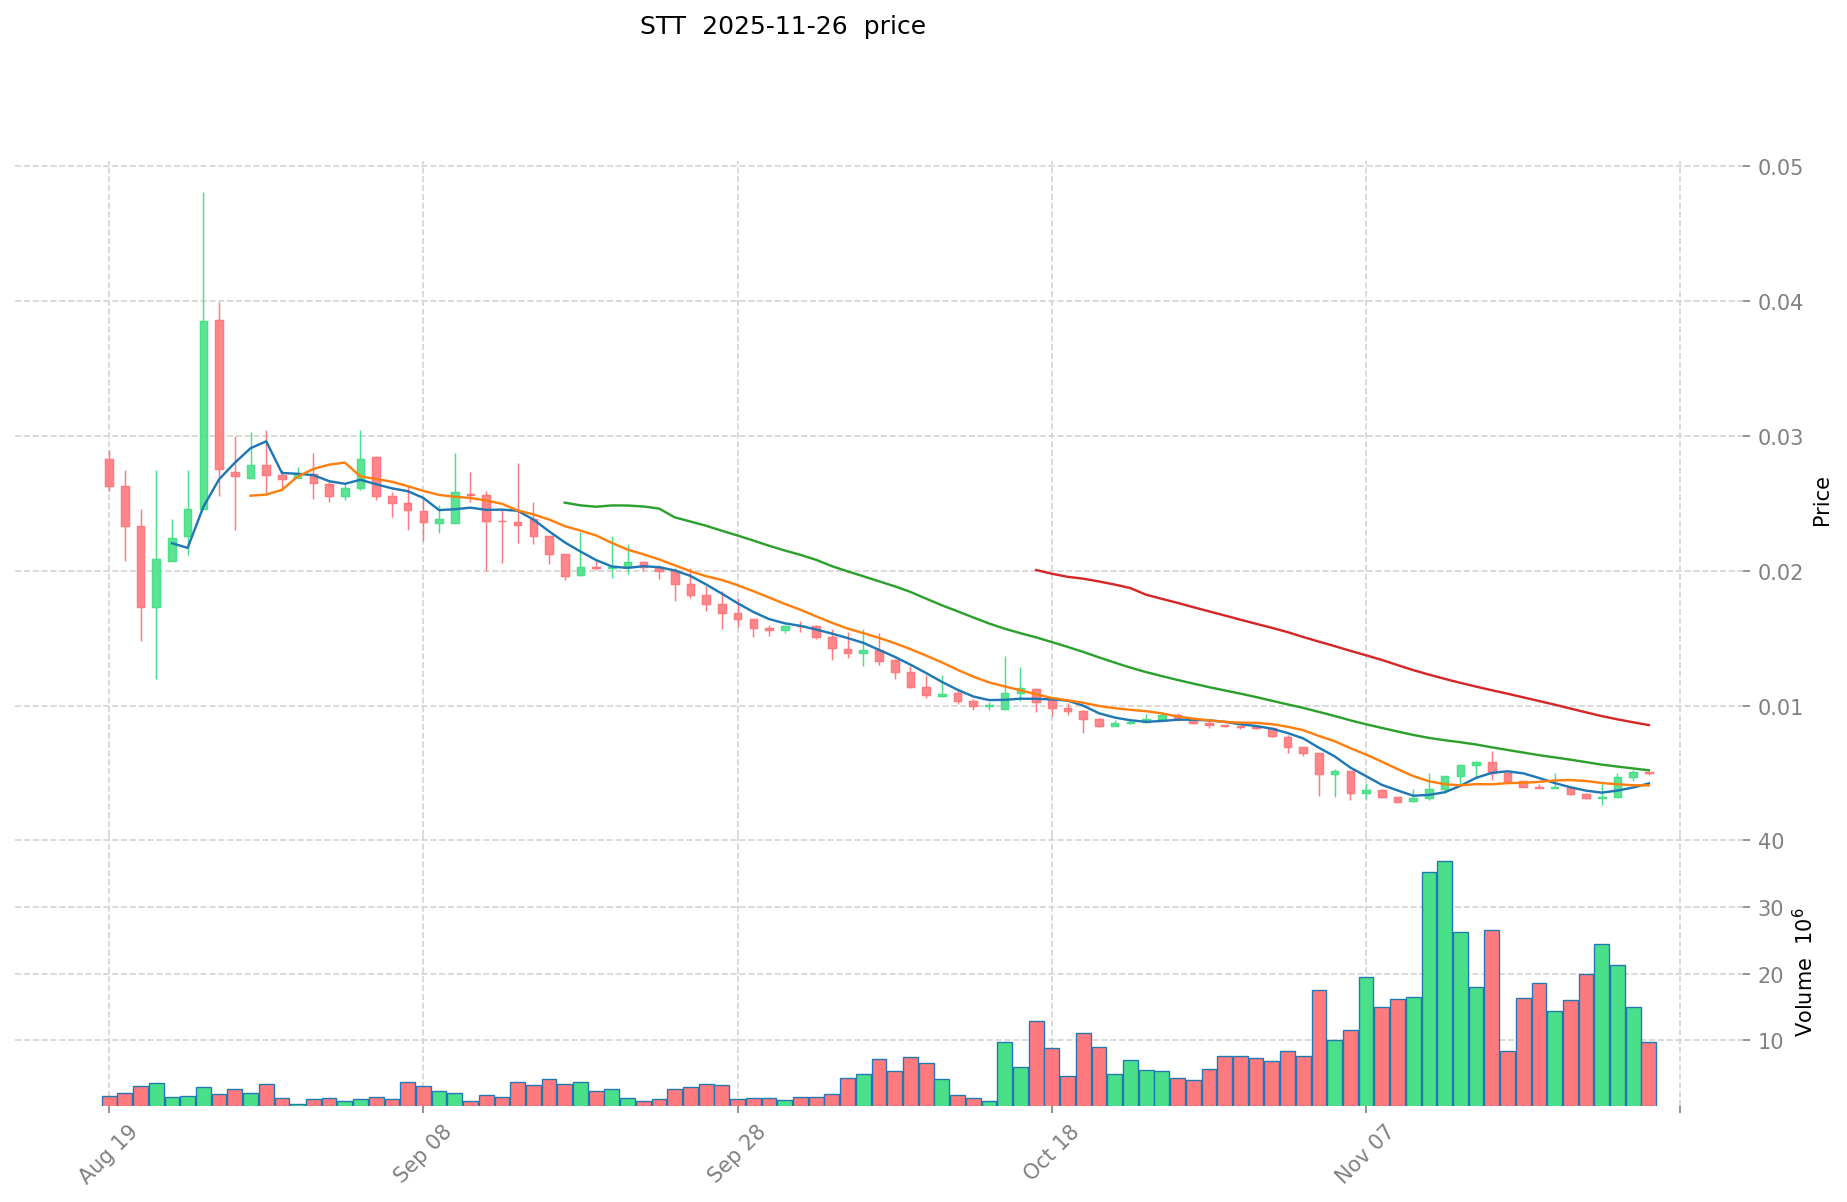
- 2024: STT reached its all-time high of $1.43 on April 1, 2024.
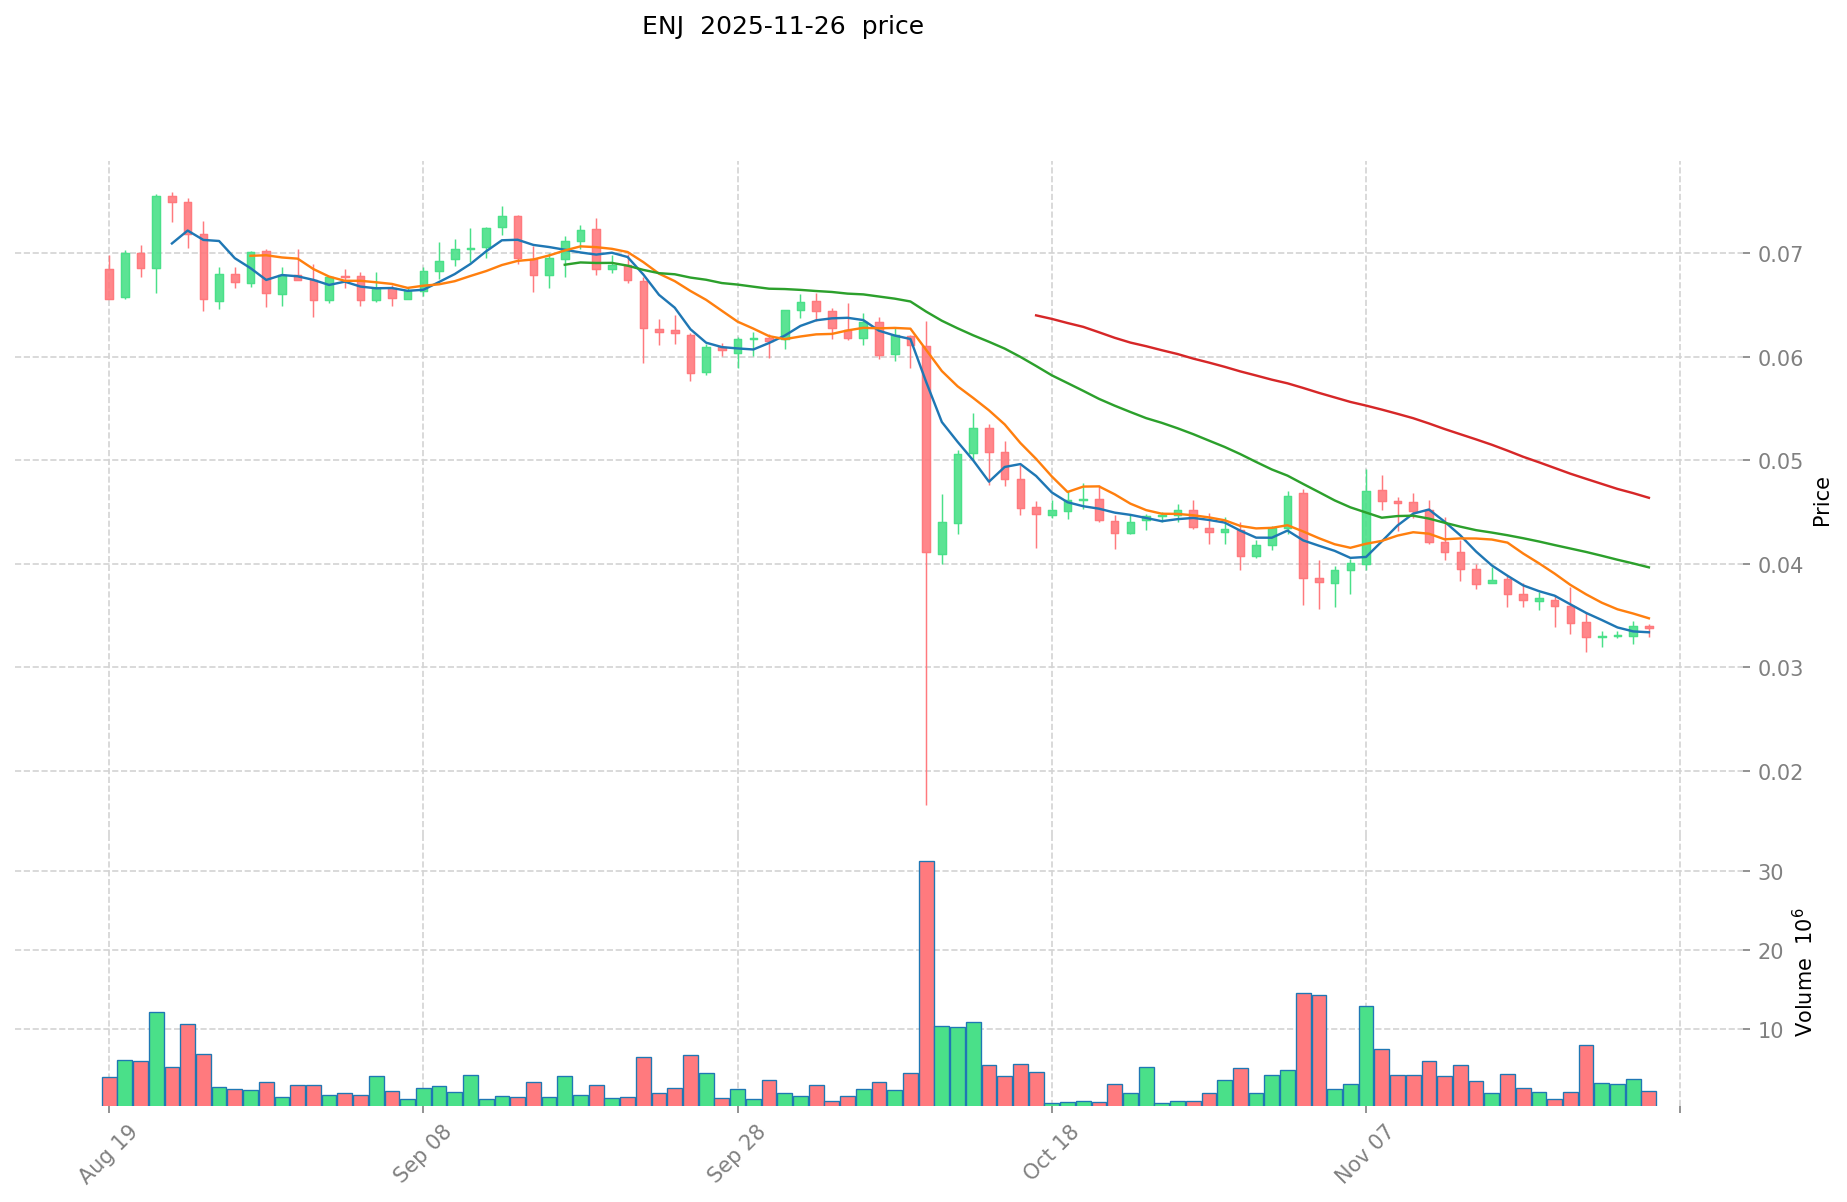
- 2021: ENJ hit its all-time high of $4.82 on November 25, 2021.
- Comparative Analysis: STT has experienced a significant decline from its all-time high, dropping to a low of $0.00261 on November 22, 2025. Similarly, ENJ has also seen a substantial decrease from its peak, reaching a low of $0.01865964 on November 12, 2017.
Current Market Situation (2025-11-27)
- STT current price: $0.005007
- ENJ current price: $0.03364
- 24-hour trading volume: STT $72,859.37 vs ENJ $153,564.53
- Market Sentiment Index (Fear & Greed Index): 20 (Extreme Fear)
Click to view real-time prices:
- Check STT current price Market Price
- Check ENJ current price Market Price
II. Core Factors Affecting the Investment Value of STT vs ENJ
Supply Mechanism Comparison (Tokenomics)
- STT: The token has a fixed maximum supply of 2 billion tokens, with a current circulating supply of 633.18 million tokens.
- ENJ: Enjin Coin has a maximum supply of 1 billion ENJ, with approximately 75% currently in circulation.
- 📌 Historical pattern: Fixed supply models like STT's tend to create scarcity value, while ENJ's controlled supply supports its ecosystem utility and potentially reduces market volatility.
Institutional Adoption and Market Applications
- Institutional holdings: Limited data suggests moderate institutional interest in both tokens, with ENJ having a slightly longer track record in gaming and NFT infrastructure.
- Enterprise adoption: ENJ has established partnerships with companies in the gaming industry, while STT's adoption in the social media and content creation space is still developing.
- National policies: Both tokens face similar regulatory scrutiny as utility tokens, though specific regulatory frameworks vary by jurisdiction.
Technical Development and Ecosystem Building
- STT technical upgrades: Focus on integrating with content creation platforms and expanding social token utilities.
- ENJ technical development: Continued development of the Enjin ecosystem including Efinity parachain on Polkadot for NFTs and gaming assets.
- Ecosystem comparison: ENJ has a more established presence in the gaming NFT space, while STT is positioning itself in the creator economy and social token ecosystem.
Macroeconomic Environment and Market Cycles
- Performance in inflationary environments: Both tokens demonstrate volatility aligned with the broader crypto market rather than showing specific anti-inflationary properties.
- Macroeconomic monetary policy: Interest rates and USD strength affect both tokens similarly to other crypto assets, with risk-off environments typically leading to decreased valuations.
- Geopolitical factors: Cross-border transaction demands may benefit both tokens as they offer borderless value transfer within their respective ecosystems.
III. 2025-2030 Price Prediction: STT vs ENJ
Short-term Prediction (2025)
- STT: Conservative $0.00380532 - $0.005007 | Optimistic $0.005007 - $0.00595833
- ENJ: Conservative $0.021168 - $0.0336 | Optimistic $0.0336 - $0.03696
Mid-term Prediction (2027)
- STT may enter a growth phase, with prices expected to range from $0.004584604473 to $0.0072486313965
- ENJ may enter a growth phase, with prices expected to range from $0.04021038 to $0.04642848
- Key drivers: Institutional capital inflow, ETFs, ecosystem development
Long-term Prediction (2030)
- STT: Base scenario $0.007065180616906 - $0.009057923867829 | Optimistic scenario $0.009057923867829 - $0.011775301028178
- ENJ: Base scenario $0.04127809326732 - $0.055781207118 | Optimistic scenario $0.055781207118 - $0.0697265088975
Disclaimer
STT:
| 年份 | 预测最高价 | 预测平均价格 | 预测最低价 | 涨跌幅 |
|---|---|---|---|---|
| 2025 | 0.00595833 | 0.005007 | 0.00380532 | 0 |
| 2026 | 0.0069081579 | 0.005482665 | 0.00422165205 | 9 |
| 2027 | 0.0072486313965 | 0.00619541145 | 0.004584604473 | 23 |
| 2028 | 0.009746931063712 | 0.00672202142325 | 0.00645314056632 | 34 |
| 2029 | 0.009881371492177 | 0.008234476243481 | 0.007246339094263 | 64 |
| 2030 | 0.011775301028178 | 0.009057923867829 | 0.007065180616906 | 80 |
ENJ:
| 年份 | 预测最高价 | 预测平均价格 | 预测最低价 | 涨跌幅 |
|---|---|---|---|---|
| 2025 | 0.03696 | 0.0336 | 0.021168 | 0 |
| 2026 | 0.047628 | 0.03528 | 0.033516 | 4 |
| 2027 | 0.04642848 | 0.041454 | 0.04021038 | 23 |
| 2028 | 0.0588812616 | 0.04394124 | 0.0360318168 | 30 |
| 2029 | 0.060151163436 | 0.0514112508 | 0.038044325592 | 52 |
| 2030 | 0.0697265088975 | 0.055781207118 | 0.04127809326732 | 65 |
IV. Investment Strategy Comparison: STT vs ENJ
Long-term vs Short-term Investment Strategy
- STT: Suitable for investors focused on social media ecosystems and creator economy potential
- ENJ: Suitable for investors interested in gaming and NFT infrastructure
Risk Management and Asset Allocation
- Conservative investors: STT 30% vs ENJ 70%
- Aggressive investors: STT 60% vs ENJ 40%
- Hedging tools: Stablecoin allocation, options, cross-currency portfolios
V. Potential Risk Comparison
Market Risk
- STT: Higher volatility due to newer market presence and smaller market cap
- ENJ: Exposure to gaming industry fluctuations and NFT market sentiment
Technical Risk
- STT: Scalability, network stability
- ENJ: Dependency on gaming adoption, potential smart contract vulnerabilities
Regulatory Risk
- Global regulatory policies may impact both tokens, with ENJ potentially facing scrutiny in jurisdictions with strict gaming regulations
VI. Conclusion: Which Is the Better Buy?
📌 Investment Value Summary:
- STT advantages: Potential for growth in creator economy, fixed supply model
- ENJ advantages: Established presence in gaming NFTs, longer track record
✅ Investment Advice:
- New investors: Consider a balanced approach with a larger allocation to ENJ due to its more established market presence
- Experienced investors: Explore a higher-risk strategy with a larger allocation to STT for potential growth
- Institutional investors: Evaluate both tokens based on specific portfolio needs and risk tolerance
⚠️ Risk Warning: The cryptocurrency market is highly volatile, and this article does not constitute investment advice. None
VII. FAQ
Q1: What are the main differences between STT and ENJ? A: STT focuses on providing infrastructure for the metaverse ecosystem and creator economy, while ENJ is primarily oriented towards blockchain-based gaming and NFTs. STT has a fixed maximum supply of 2 billion tokens, whereas ENJ has a maximum supply of 1 billion with about 75% in circulation.
Q2: Which token has performed better historically? A: ENJ reached its all-time high of $4.82 in November 2021, while STT's all-time high was $1.43 in April 2024. Both have experienced significant declines since their peaks, with ENJ having a longer price history due to its earlier launch in 2017 compared to STT's 2023 launch.
Q3: How do the current market situations of STT and ENJ compare? A: As of November 27, 2025, STT's price is $0.005007 with a 24-hour trading volume of $72,859.37, while ENJ's price is $0.03364 with a 24-hour trading volume of $153,564.53. The market sentiment for both is currently in "Extreme Fear" with an index of 20.
Q4: What are the key factors affecting the investment value of STT and ENJ? A: Key factors include supply mechanisms, institutional adoption, technical development, ecosystem building, and macroeconomic conditions. ENJ has a more established presence in gaming NFTs, while STT is positioning itself in the creator economy and social token ecosystem.
Q5: What are the long-term price predictions for STT and ENJ? A: By 2030, STT's base scenario price range is predicted to be $0.007065180616906 - $0.009057923867829, with an optimistic scenario of $0.009057923867829 - $0.011775301028178. For ENJ, the base scenario is $0.04127809326732 - $0.055781207118, with an optimistic scenario of $0.055781207118 - $0.0697265088975.
Q6: How should investors approach asset allocation between STT and ENJ? A: Conservative investors might consider allocating 30% to STT and 70% to ENJ, while aggressive investors might opt for 60% STT and 40% ENJ. The specific allocation should be based on individual risk tolerance and investment goals.
Q7: What are the potential risks associated with investing in STT and ENJ? A: Both tokens face market risks due to cryptocurrency volatility. STT may have higher volatility due to its newer market presence, while ENJ is exposed to gaming industry fluctuations. Technical risks include scalability for STT and potential smart contract vulnerabilities for ENJ. Both face regulatory risks, with ENJ potentially facing additional scrutiny in jurisdictions with strict gaming regulations.
Share
Content
Introduction: STT vs ENJ Investment Comparison
I. Price History Comparison and Current Market Status
II. Core Factors Affecting the Investment Value of STT vs ENJ
III. 2025-2030 Price Prediction: STT vs ENJ
IV. Investment Strategy Comparison: STT vs ENJ
V. Potential Risk Comparison
VI. Conclusion: Which Is the Better Buy?
VII. FAQ

