STORM vs TRX: A Comparative Analysis of Two Popular Fitness Equipment Options
Introduction: Investment Comparison between STORM and TRX
In the cryptocurrency market, the comparison between Storm Trade (STORM) vs TRON (TRX) has always been a topic that investors cannot ignore. The two not only show significant differences in market cap ranking, application scenarios, and price performance, but also represent different positioning in crypto assets. Storm Trade (STORM): Since its launch, it has gained market recognition for its social-first derivatives platform on Telegram. TRON (TRX): Since its inception in 2017, it has been hailed as a blockchain infrastructure for sovereign states, becoming one of the cryptocurrencies with the highest global trading volume and market capitalization. This article will comprehensively analyze the investment value comparison between STORM and TRX in terms of historical price trends, supply mechanisms, institutional adoption, technical ecosystems, and future predictions, attempting to answer the question that investors care most about:
"Which is the better buy right now?"
I. Price History Comparison and Current Market Status
STORM and TRX Historical Price Trends
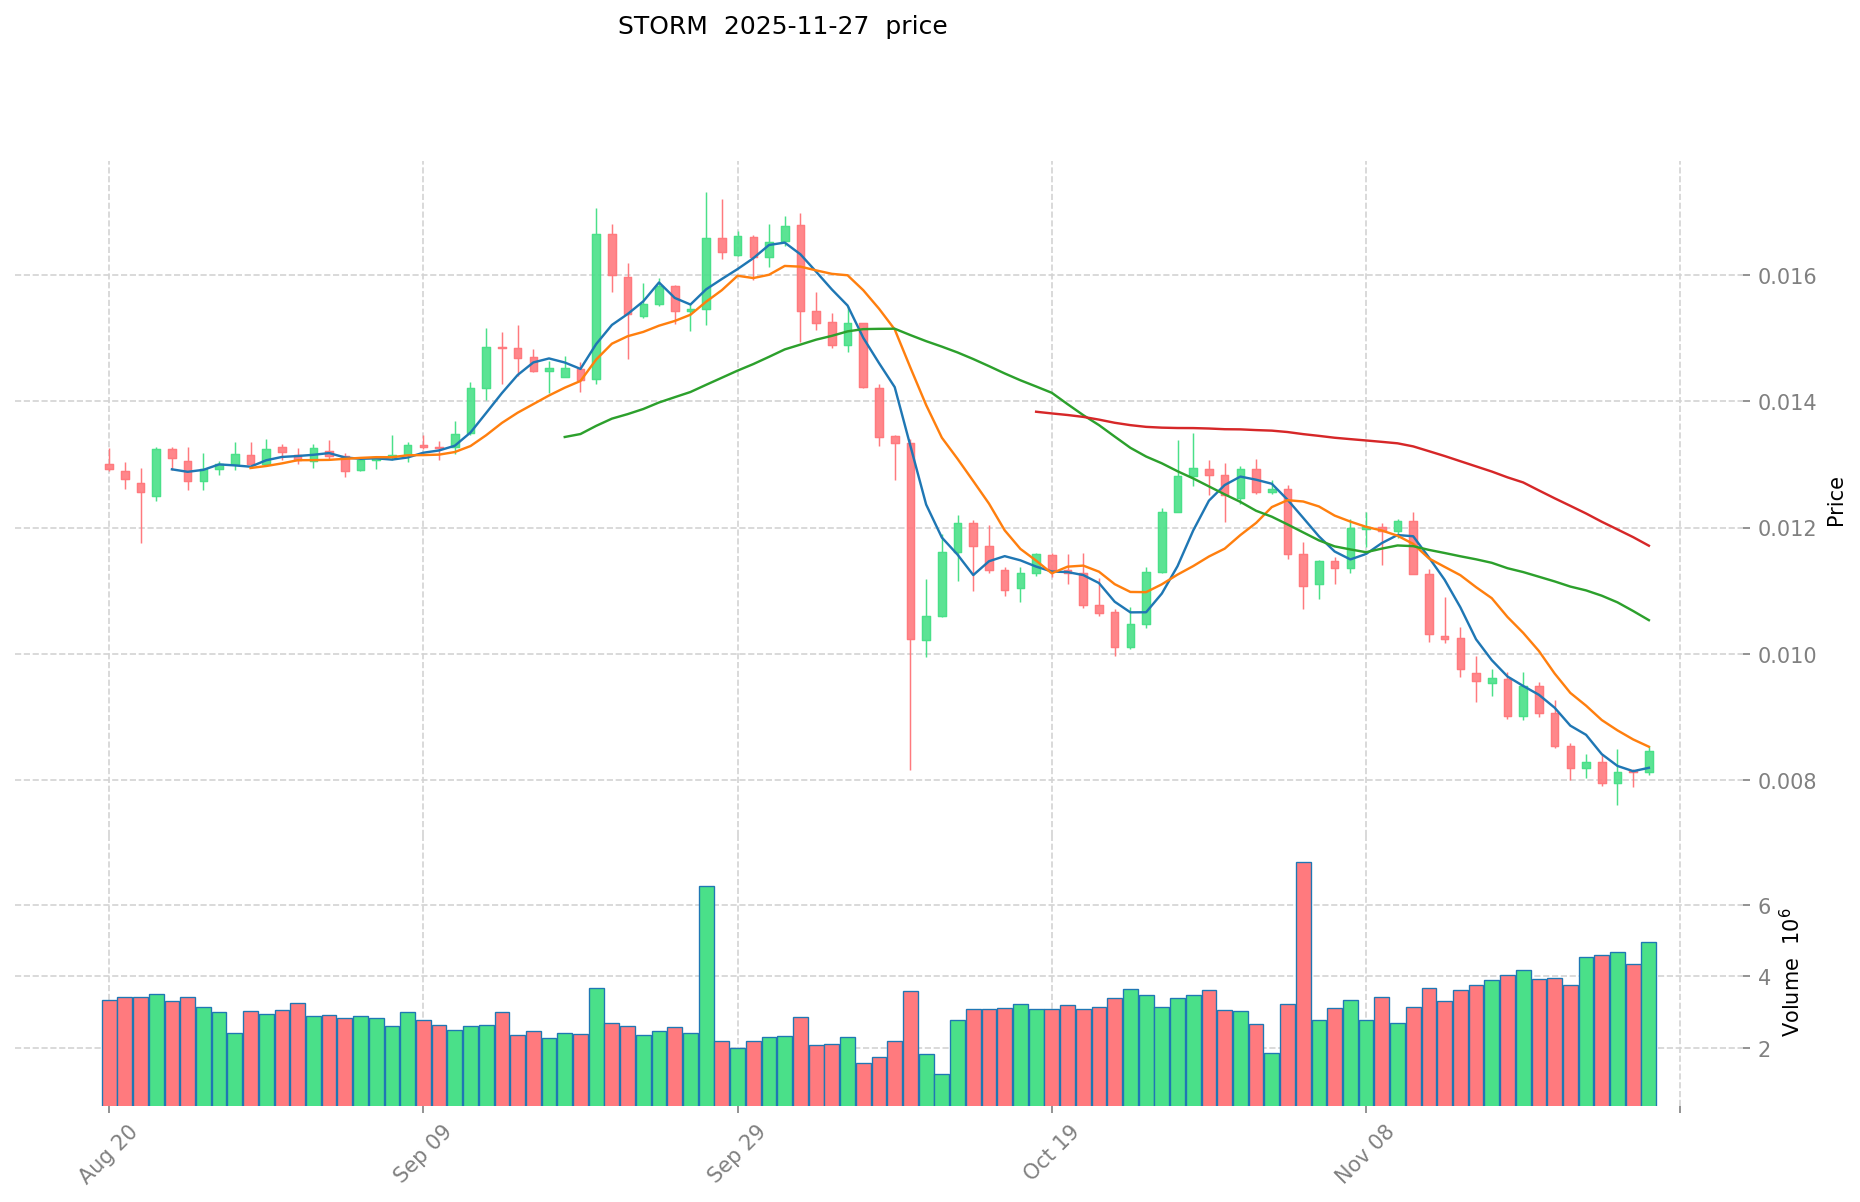
- 2024: STORM reached its all-time high of $0.056522 on December 5, 2024.
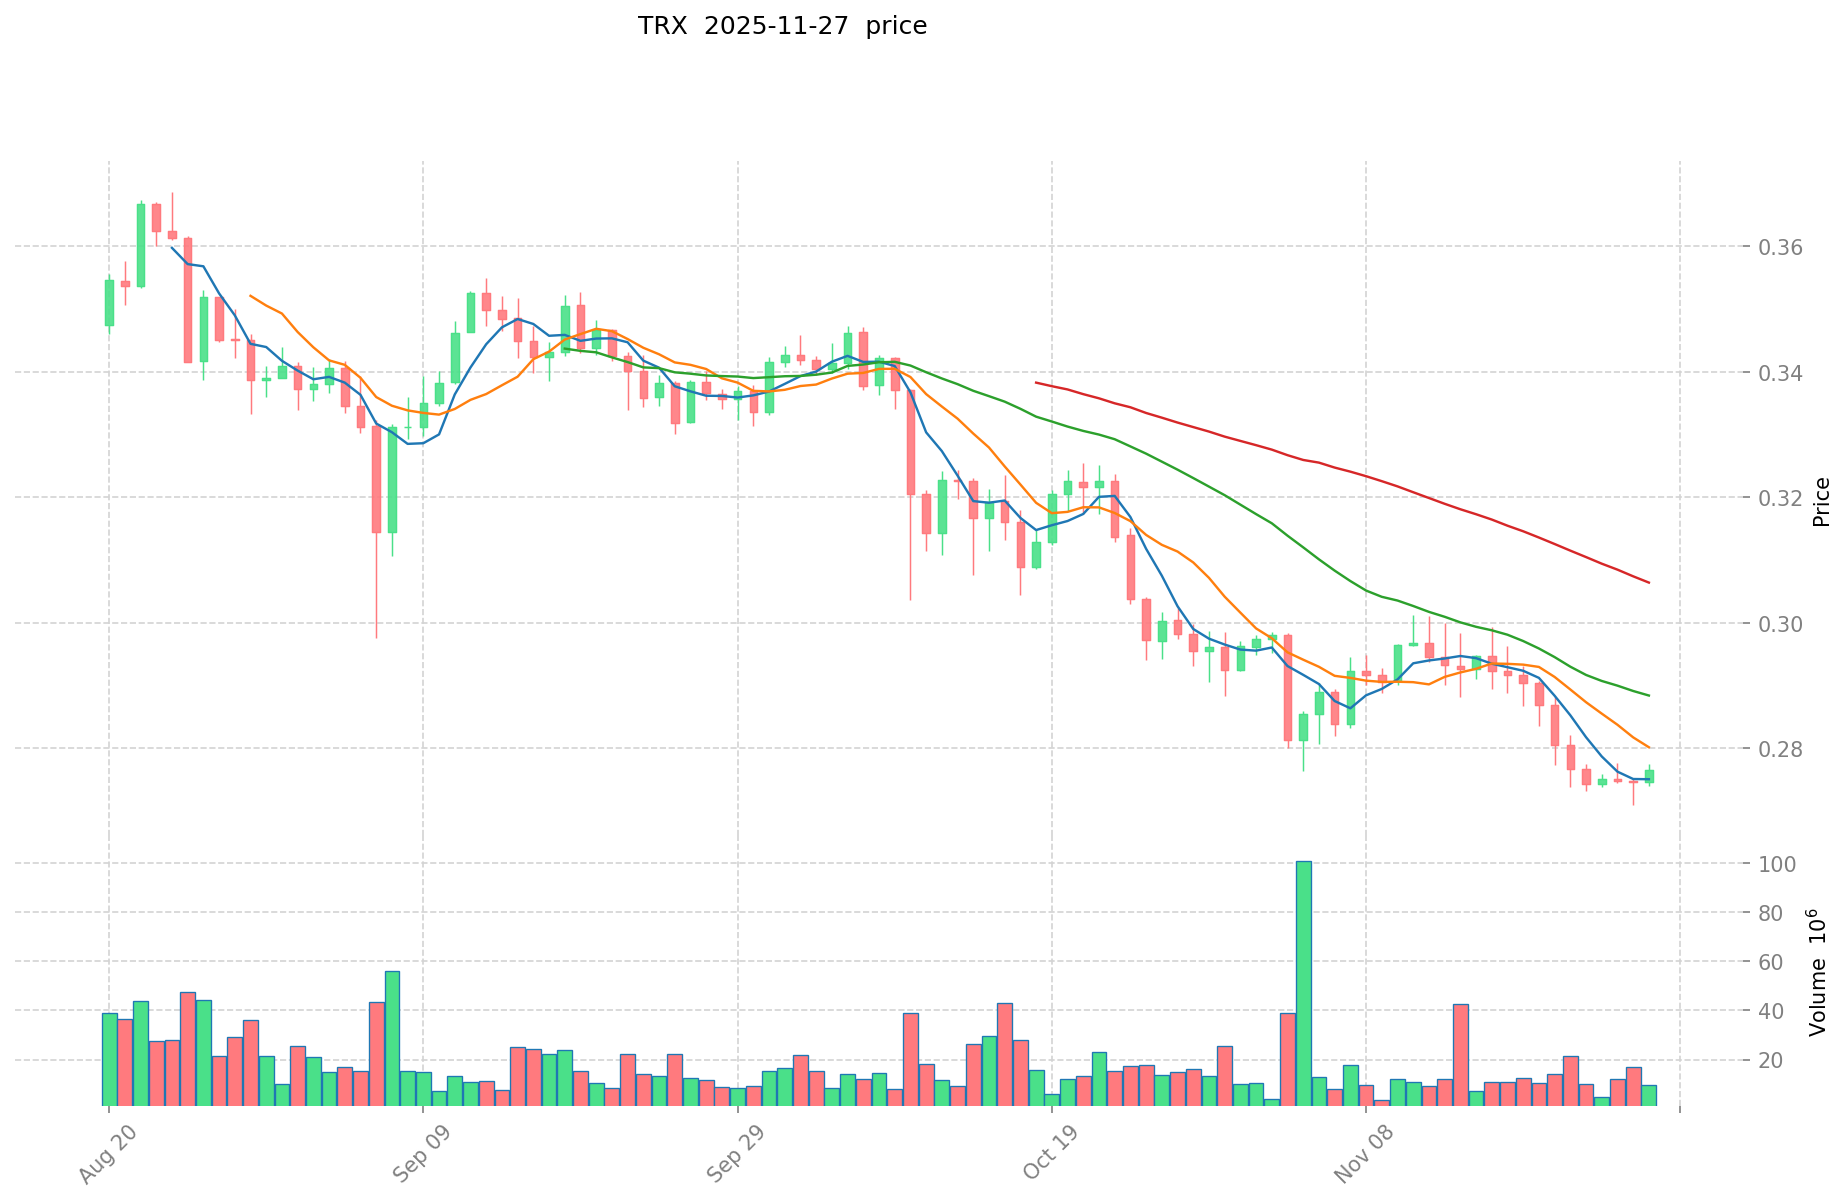
- 2024: TRX achieved its historical peak of $0.431288 on December 4, 2024.
- Comparative analysis: In the recent market cycle, STORM dropped from its high of $0.056522 to a low of $0.007603, while TRX has shown more stability, currently trading at $0.27671.
Current Market Situation (2025-11-27)
- STORM current price: $0.008453
- TRX current price: $0.27671
- 24-hour trading volume: STORM $40,695.55 vs TRX $3,136,649.99
- Market Sentiment Index (Fear & Greed Index): 22 (Extreme Fear)
Click to view real-time prices:
- Check STORM's current price Market Price
- Check TRX's current price Market Price
II. Core Factors Affecting Investment Value of STORM vs TRX
Supply Mechanism Comparison (Tokenomics)
- STORM: Fixed supply mechanism with a maximum cap of 10 billion tokens
- TRX: Deflationary model with token burning mechanism and a total supply of around 89 billion TRX
- 📌 Historical Pattern: Deflationary models like TRX's tend to support price stability over time, while fixed supply tokens like STORM may experience higher volatility depending on market demand.
Institutional Adoption and Market Applications
- Institutional Holdings: TRX has attracted more institutional interest through the TRON Foundation's partnerships with major corporations
- Enterprise Adoption: TRX shows stronger adoption in cross-border payments and settlements, particularly in Asian markets, while STORM has limited commercial applications
- Regulatory Attitudes: TRX faces mixed regulatory reception across jurisdictions, with stronger acceptance in Asia but scrutiny in Western markets
Technical Development and Ecosystem Building
- TRX Technical Development: TRON's advanced consensus mechanism and focus on high-throughput applications have enabled scalable DApp deployment
- Ecosystem Comparison: TRX has a more developed ecosystem with significant DeFi applications, NFT marketplaces, and stablecoin support, while STORM's ecosystem remains relatively underdeveloped
Macroeconomic and Market Cycles
- Performance in Inflationary Environments: TRX has demonstrated more resilience during inflation periods due to its utility value and established use cases
- Macroeconomic Monetary Policy: Both tokens show correlation with broader crypto market trends in response to interest rate changes and USD strength
- Geopolitical Factors: TRX benefits from strong adoption in regions with cross-border payment restrictions, particularly in the Asia-Pacific region
III. Price Prediction for 2025-2030: STORM vs TRX
Short-term Prediction (2025)
- STORM: Conservative $0.00605592 - $0.008411 | Optimistic $0.008411 - $0.01143896
- TRX: Conservative $0.1466457 - $0.27669 | Optimistic $0.27669 - $0.4012005
Mid-term Prediction (2027)
- STORM may enter a growth phase, with prices expected between $0.006958403478 - $0.017823279084
- TRX may enter a consolidation phase, with prices expected between $0.323794397325 - $0.45805061085
- Key drivers: Institutional capital inflow, ETF, ecosystem development
Long-term Prediction (2030)
- STORM: Base scenario $0.017905986423585 - $0.023635902079132 | Optimistic scenario $0.023635902079132
- TRX: Base scenario $0.467806299118672 - $0.481840488092232 | Optimistic scenario $0.481840488092232
Disclaimer: This analysis is for informational purposes only and should not be considered as financial advice. Cryptocurrency markets are highly volatile and unpredictable. Always conduct your own research before making any investment decisions.
STORM:
| 年份 | 预测最高价 | 预测平均价格 | 预测最低价 | 涨跌幅 |
|---|---|---|---|---|
| 2025 | 0.01143896 | 0.008411 | 0.00605592 | 0 |
| 2026 | 0.0144904708 | 0.00992498 | 0.0056572386 | 17 |
| 2027 | 0.017823279084 | 0.0122077254 | 0.006958403478 | 44 |
| 2028 | 0.0187693778025 | 0.015015502242 | 0.00960992143488 | 77 |
| 2029 | 0.01891953282492 | 0.01689244002225 | 0.010980086014462 | 99 |
| 2030 | 0.023635902079132 | 0.017905986423585 | 0.015220088460047 | 111 |
TRX:
| 年份 | 预测最高价 | 预测平均价格 | 预测最低价 | 涨跌幅 |
|---|---|---|---|---|
| 2025 | 0.4012005 | 0.27669 | 0.1466457 | 0 |
| 2026 | 0.4507971825 | 0.33894525 | 0.3219979875 | 22 |
| 2027 | 0.45805061085 | 0.39487121625 | 0.323794397325 | 42 |
| 2028 | 0.452048568363 | 0.42646091355 | 0.383814822195 | 54 |
| 2029 | 0.496357857280845 | 0.4392547409565 | 0.320655960898245 | 58 |
| 2030 | 0.481840488092232 | 0.467806299118672 | 0.430381795189178 | 69 |
IV. Investment Strategy Comparison: STORM vs TRX
Long-term vs Short-term Investment Strategy
- STORM: Suitable for investors focusing on social trading platforms and potential ecosystem growth
- TRX: Suitable for investors seeking stability and infrastructure development in blockchain technology
Risk Management and Asset Allocation
- Conservative investors: STORM: 10% vs TRX: 90%
- Aggressive investors: STORM: 30% vs TRX: 70%
- Hedging tools: Stablecoin allocation, options, cross-currency portfolios
V. Potential Risk Comparison
Market Risk
- STORM: Higher volatility due to lower market cap and trading volume
- TRX: Susceptible to broader crypto market trends and regulatory news
Technical Risk
- STORM: Scalability, network stability
- TRX: Hash power concentration, security vulnerabilities
Regulatory Risk
- Global regulatory policies may have different impacts on both tokens, with TRX potentially facing more scrutiny due to its wider adoption
VI. Conclusion: Which Is the Better Buy?
📌 Investment Value Summary:
- STORM advantages: Niche market in social trading, potential for rapid growth
- TRX advantages: Established ecosystem, wider adoption, deflationary model
✅ Investment Advice:
- New investors: Consider allocating a larger portion to TRX for stability
- Experienced investors: Balanced portfolio with both STORM and TRX based on risk tolerance
- Institutional investors: Focus on TRX for its established infrastructure and partnerships
⚠️ Risk Warning: Cryptocurrency markets are highly volatile. This article does not constitute investment advice. None
VII. FAQ
Q1: What are the key differences between STORM and TRX in terms of market position? A: STORM is known for its social-first derivatives platform on Telegram, while TRX is positioned as a blockchain infrastructure for sovereign states with a higher market cap and trading volume.
Q2: How do the supply mechanisms of STORM and TRX differ? A: STORM has a fixed supply mechanism with a maximum cap of 10 billion tokens, while TRX employs a deflationary model with a token burning mechanism and a total supply of around 89 billion TRX.
Q3: Which token has shown better price stability historically? A: TRX has demonstrated more price stability compared to STORM. In recent market cycles, STORM experienced a larger drop from its all-time high, while TRX maintained a more stable trading range.
Q4: How do institutional adoption and market applications compare between STORM and TRX? A: TRX has attracted more institutional interest and shows stronger adoption in cross-border payments and settlements, particularly in Asian markets. STORM has limited commercial applications in comparison.
Q5: What are the key factors driving the long-term price predictions for STORM and TRX? A: Long-term price predictions for both tokens are influenced by factors such as institutional capital inflow, potential ETF approvals, and ecosystem development. TRX is expected to maintain a higher price range due to its more established ecosystem and wider adoption.
Q6: How should investors approach risk management when considering STORM and TRX? A: For risk management, conservative investors might consider allocating 10% to STORM and 90% to TRX, while aggressive investors might opt for 30% STORM and 70% TRX. Hedging tools such as stablecoin allocation, options, and cross-currency portfolios are recommended.
Q7: Which token is considered more suitable for different types of investors? A: New investors may consider allocating a larger portion to TRX for stability. Experienced investors might create a balanced portfolio with both STORM and TRX based on risk tolerance. Institutional investors may focus more on TRX due to its established infrastructure and partnerships.
Share
Content
Introduction: Investment Comparison between STORM and TRX
I. Price History Comparison and Current Market Status
II. Core Factors Affecting Investment Value of STORM vs TRX
III. Price Prediction for 2025-2030: STORM vs TRX
IV. Investment Strategy Comparison: STORM vs TRX
V. Potential Risk Comparison
VI. Conclusion: Which Is the Better Buy?
VII. FAQ

