SQT vs ETC: Comparing Efficiency and Reliability in Modern Power Transmission Systems
Introduction: SQT vs ETC Investment Comparison
In the cryptocurrency market, the comparison between SubQuery Network (SQT) and Ethereum Classic (ETC) has been an unavoidable topic for investors. The two not only show significant differences in market cap ranking, application scenarios, and price performance but also represent different positions in the crypto asset space.
SubQuery Network (SQT): Launched in 2024, it has gained market recognition for its innovative Web3 infrastructure tools empowering builders to decentralize the future.
Ethereum Classic (ETC): Since its inception in 2016, it has been hailed as the continuation of the original Ethereum blockchain, upholding the "code is law" principle.
This article will comprehensively analyze the investment value comparison between SQT and ETC, focusing on historical price trends, supply mechanisms, institutional adoption, technical ecosystems, and future predictions, attempting to answer the question investors care about most:
"Which is the better buy right now?"
I. Price History Comparison and Current Market Status
SQT and ETC Historical Price Trends
- 2024: SQT reached its all-time high of $0.045 on April 5, 2024.
- 2021: ETC hit its all-time high of $167.09 on May 7, 2021, during the broader cryptocurrency bull market.
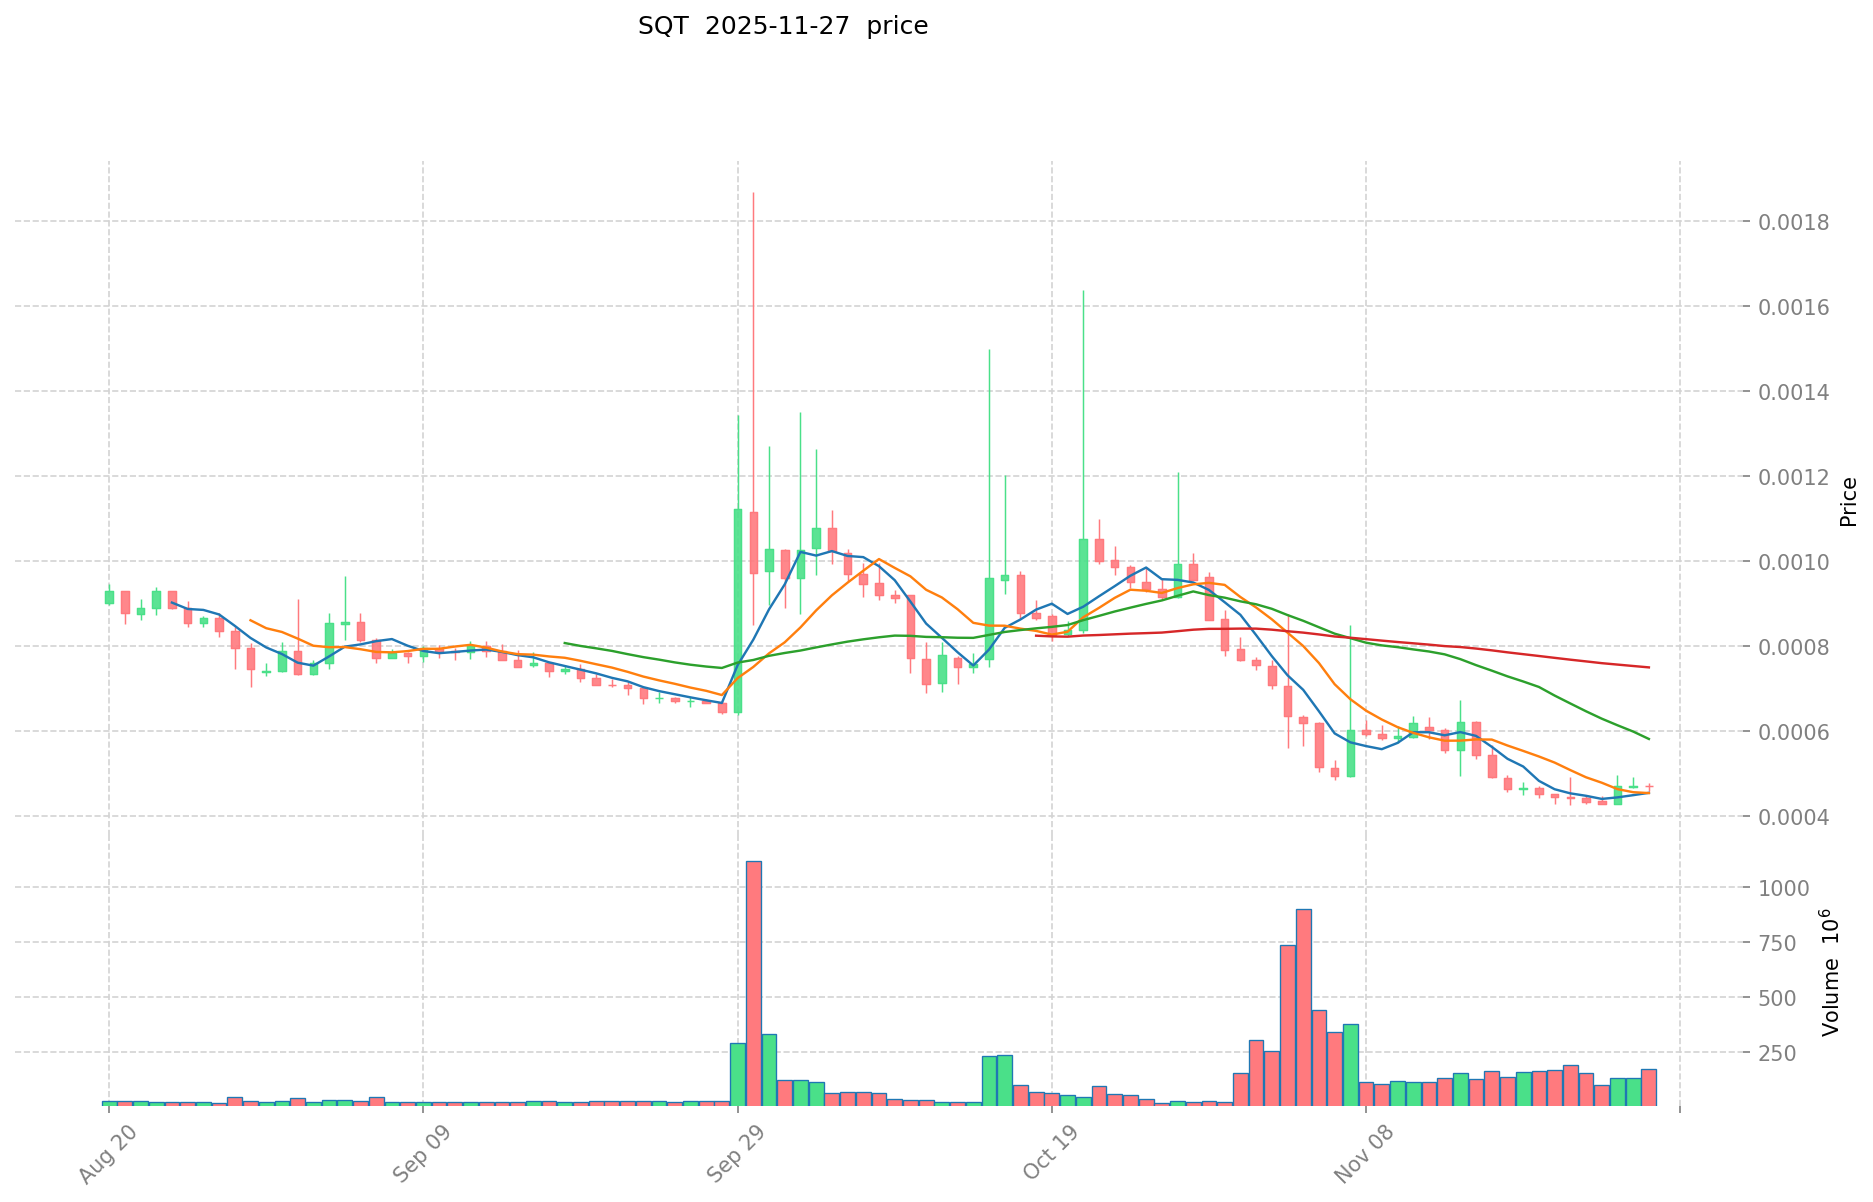
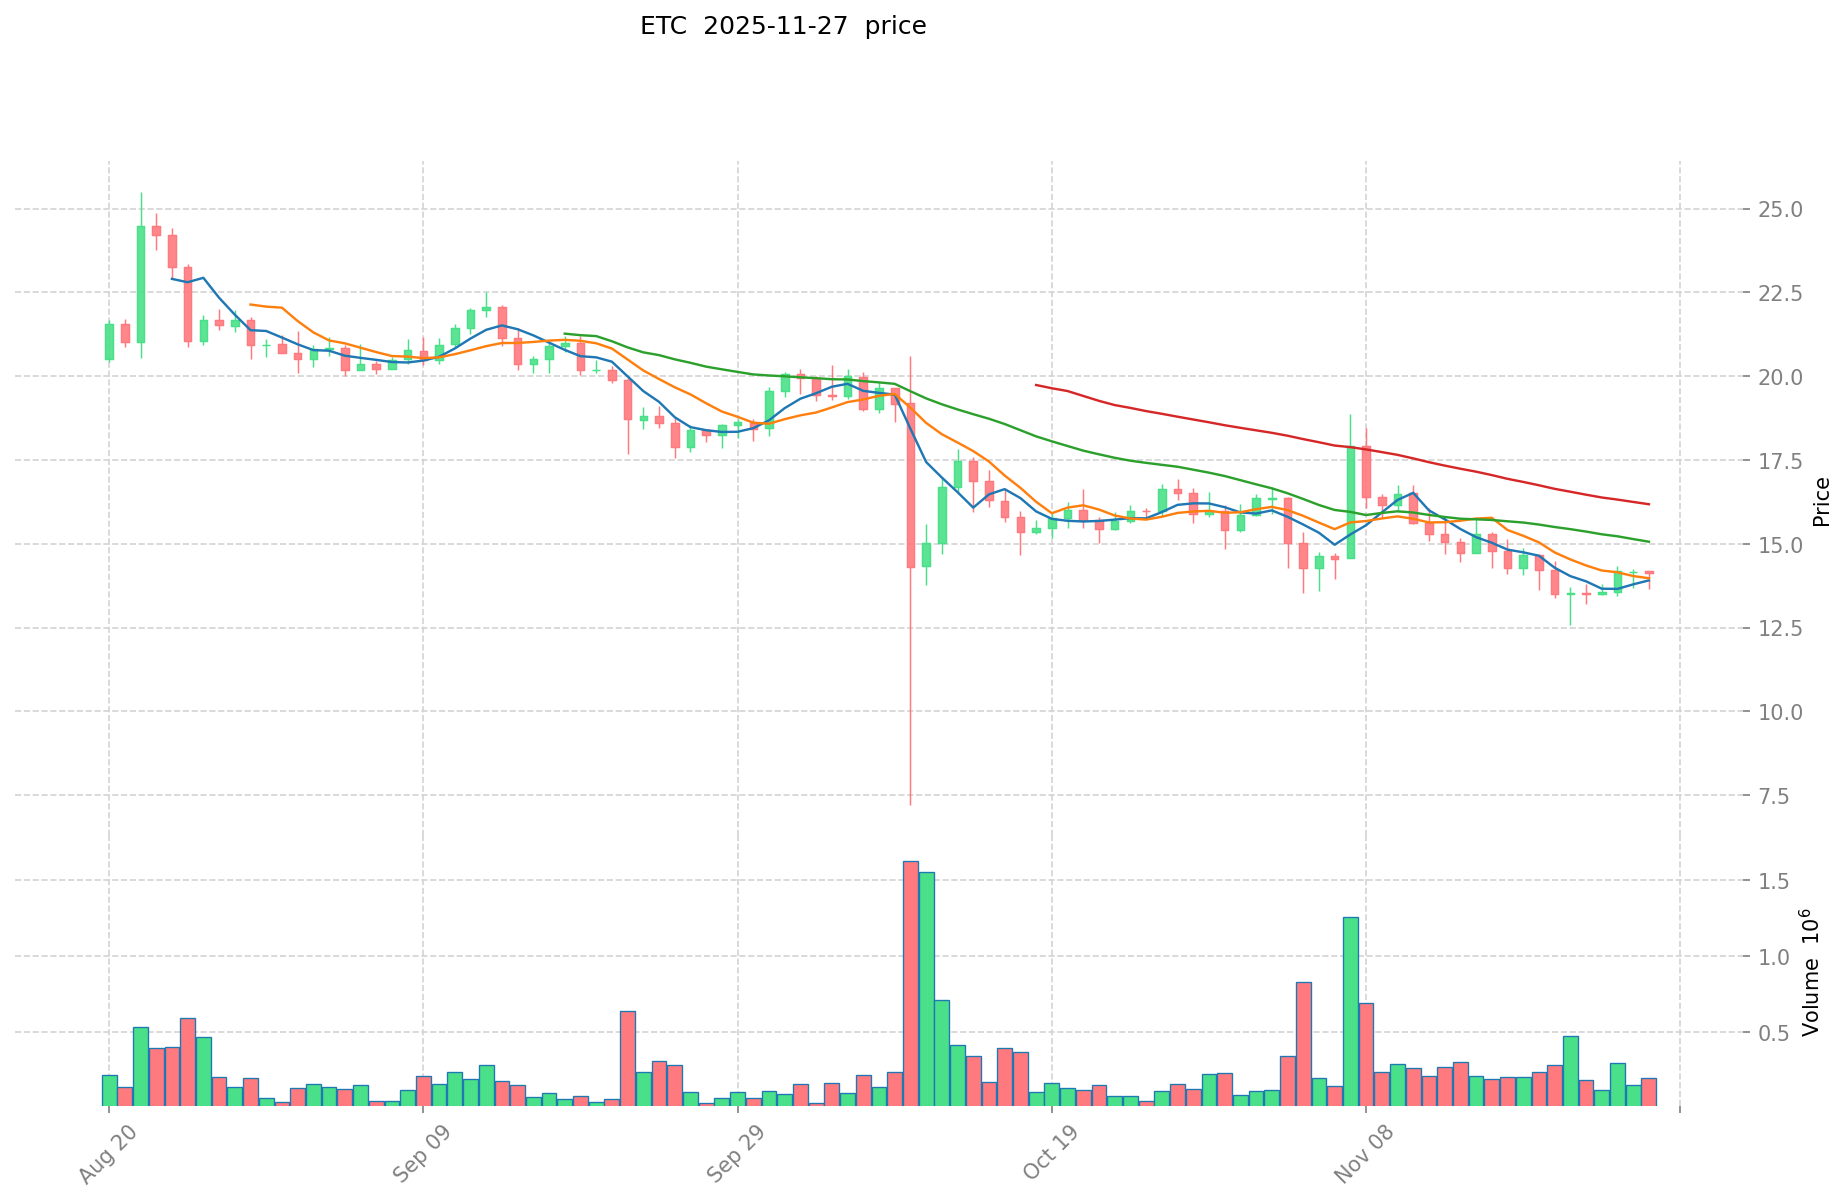
- Comparative analysis: In the recent market cycle, SQT has fallen from its high of $0.045 to a current price of $0.0004689, while ETC has declined from its peak of $167.09 to $14.128.
Current Market Situation (2025-11-27)
- SQT current price: $0.0004689
- ETC current price: $14.128
- 24-hour trading volume: SQT $81,938.60 vs ETC $2,676,524.45
- Market Sentiment Index (Fear & Greed Index): 15 (Extreme Fear)
Click to view real-time prices:
- View SQT current price Market Price
- View ETC current price Market Price
II. Core Factors Affecting SQT vs ETC Investment Value
Supply Mechanism Comparison (Tokenomics)
- SQT: Deflationary model with token burning mechanism and a maximum supply cap
- ETC: Fixed supply cap of 210.7 million coins with a decreasing block reward system
- 📌 Historical Pattern: Deflationary tokens like SQT tend to experience price appreciation during bull markets due to reduced circulating supply, while ETC's predictable issuance provides stability similar to Bitcoin's model.
Institutional Adoption and Market Applications
- Institutional Holdings: ETC has greater institutional presence through Grayscale's ETC Trust and historical market recognition
- Enterprise Adoption: ETC maintains stronger integration with existing Ethereum-compatible infrastructure, while SQT focuses on DeFi-specific applications
- Regulatory Attitudes: ETC benefits from regulatory clarity as a well-established asset, whereas SQT faces varying regulatory approaches across jurisdictions
Technical Development and Ecosystem Building
- SQT Technical Upgrades: Focused on Layer 2 solutions and cross-chain interoperability
- ETC Technical Development: Maintenance of proof-of-work security model with compatibility upgrades to the original Ethereum vision
- Ecosystem Comparison: ETC has broader general-purpose application support, while SQT demonstrates stronger specialized DeFi protocol integration
Macroeconomic and Market Cycles
- Performance in Inflationary Environments: ETC displays stronger correlation with traditional hard assets during inflation periods
- Macroeconomic Monetary Policy: Interest rate hikes typically impact SQT more severely due to its higher connection with speculative DeFi activity
- Geopolitical Factors: ETC's established mining infrastructure provides resilience during global uncertainty, while SQT's DeFi focus creates vulnerability to regulatory crackdowns
III. 2025-2030 Price Prediction: SQT vs ETC
Short-term Forecast (2025)
- SQT: Conservative $0.000346246 - $0.0004679 | Optimistic $0.0004679 - $0.000617628
- ETC: Conservative $11.5374 - $14.07 | Optimistic $14.07 - $15.3363
Mid-term Forecast (2027)
- SQT may enter a growth phase, with prices expected in the range of $0.0004344283056 - $0.0007870078
- ETC may enter a steady growth phase, with prices expected in the range of $10.334844135 - $17.224740225
- Key drivers: Institutional capital inflow, ETF, ecosystem development
Long-term Forecast (2030)
- SQT: Base scenario $0.001080309866904 - $0.001393599728306 | Optimistic scenario $0.001393599728306+
- ETC: Base scenario $19.340897429483437 - $26.690438452687143 | Optimistic scenario $26.690438452687143+
Disclaimer: This analysis is for informational purposes only and should not be considered as financial advice. Cryptocurrency markets are highly volatile and unpredictable. Always conduct your own research before making any investment decisions.
SQT:
| 年份 | 预测最高价 | 预测平均价格 | 预测最低价 | 涨跌幅 |
|---|---|---|---|---|
| 2025 | 0.000617628 | 0.0004679 | 0.000346246 | 0 |
| 2026 | 0.00071644848 | 0.000542764 | 0.00042335592 | 15 |
| 2027 | 0.0007870078 | 0.00062960624 | 0.0004344283056 | 34 |
| 2028 | 0.0010482943896 | 0.00070830702 | 0.0003683196504 | 51 |
| 2029 | 0.001282319029008 | 0.0008783007048 | 0.00070264056384 | 87 |
| 2030 | 0.001393599728306 | 0.001080309866904 | 0.000767020005501 | 130 |
ETC:
| 年份 | 预测最高价 | 预测平均价格 | 预测最低价 | 涨跌幅 |
|---|---|---|---|---|
| 2025 | 15.3363 | 14.07 | 11.5374 | 0 |
| 2026 | 16.6145595 | 14.70315 | 8.233764 | 4 |
| 2027 | 17.224740225 | 15.65885475 | 10.334844135 | 10 |
| 2028 | 20.223410909625 | 16.4417974875 | 10.85158634175 | 16 |
| 2029 | 20.349190660404375 | 18.3326041985625 | 16.682669820691875 | 29 |
| 2030 | 26.690438452687143 | 19.340897429483437 | 14.699082046407412 | 36 |
IV. Investment Strategy Comparison: SQT vs ETC
Long-term vs Short-term Investment Strategies
- SQT: Suitable for investors focused on DeFi ecosystem potential and Web3 infrastructure growth
- ETC: Suitable for investors seeking stability and potential inflation hedge properties
Risk Management and Asset Allocation
- Conservative investors: SQT: 10% vs ETC: 90%
- Aggressive investors: SQT: 30% vs ETC: 70%
- Hedging tools: Stablecoin allocation, options, cross-currency portfolio
V. Potential Risk Comparison
Market Risks
- SQT: Higher volatility due to smaller market cap and newer project status
- ETC: Susceptibility to broader cryptocurrency market trends and sentiment
Technical Risks
- SQT: Scalability, network stability
- ETC: Mining concentration, security vulnerabilities
Regulatory Risks
- Global regulatory policies may have different impacts on both assets, with ETC potentially facing less scrutiny due to its established status
VI. Conclusion: Which Is the Better Buy?
📌 Investment Value Summary:
- SQT advantages: Innovative Web3 infrastructure, strong DeFi integration, deflationary tokenomics
- ETC advantages: Established market presence, compatibility with Ethereum ecosystem, fixed supply cap
✅ Investment Advice:
- New investors: Consider a small allocation to SQT for exposure to Web3 growth, with a larger position in ETC for stability
- Experienced investors: Balanced approach with both assets, adjusting allocation based on risk tolerance and market trends
- Institutional investors: ETC may be more suitable due to regulatory clarity and established market presence
⚠️ Risk Warning: Cryptocurrency markets are highly volatile. This article does not constitute investment advice. None
VII. FAQ
Q1: What are the key differences between SQT and ETC? A: SQT is a newer project focused on Web3 infrastructure and DeFi integration, with a deflationary tokenomics model. ETC is an established cryptocurrency with a fixed supply cap, maintaining the original Ethereum vision and proof-of-work consensus.
Q2: Which asset has performed better in terms of price history? A: ETC has reached a higher all-time high of $167.09 in May 2021, while SQT's all-time high was $0.045 in April 2024. However, both have experienced significant declines from their peaks.
Q3: How do the supply mechanisms of SQT and ETC differ? A: SQT employs a deflationary model with token burning, while ETC has a fixed supply cap of 210.7 million coins with a decreasing block reward system.
Q4: Which asset is more suitable for institutional investors? A: ETC is generally more suitable for institutional investors due to its greater regulatory clarity, established market presence, and availability through institutional investment vehicles like Grayscale's ETC Trust.
Q5: What are the main risks associated with investing in SQT and ETC? A: SQT faces higher volatility and technical risks due to its smaller market cap and newer status. ETC is susceptible to broader cryptocurrency market trends and potential mining concentration issues.
Q6: How do the long-term price predictions for SQT and ETC compare? A: By 2030, SQT is predicted to reach a base scenario of $0.001080309866904 - $0.001393599728306, while ETC is expected to reach $19.340897429483437 - $26.690438452687143 in the base scenario.
Q7: What investment strategies are recommended for SQT and ETC? A: Conservative investors might allocate 10% to SQT and 90% to ETC, while aggressive investors could consider 30% SQT and 70% ETC. New investors are advised to have a larger position in ETC for stability with a small allocation to SQT for exposure to Web3 growth.
Share
Content
Introduction: SQT vs ETC Investment Comparison
I. Price History Comparison and Current Market Status
II. Core Factors Affecting SQT vs ETC Investment Value
III. 2025-2030 Price Prediction: SQT vs ETC
IV. Investment Strategy Comparison: SQT vs ETC
V. Potential Risk Comparison
VI. Conclusion: Which Is the Better Buy?
VII. FAQ

