SQR vs SAND: A Comparison of Two Novel Approaches to Quantum Computing
Introduction: SQR vs SAND Investment Comparison
In the cryptocurrency market, Magic Square (SQR) vs The Sandbox (SAND) comparison has been an unavoidable topic for investors. The two not only show significant differences in market cap ranking, application scenarios, and price performance, but also represent different positions in the crypto asset landscape.
Magic Square (SQR): Launched in 2024, it has gained market recognition for its position as the official Web3 App Store.
The Sandbox (SAND): Since its inception in 2020, it has been hailed as a virtual game world, becoming one of the globally recognized cryptocurrencies in the gaming and metaverse sector.
This article will provide a comprehensive analysis of the investment value comparison between SQR and SAND, focusing on historical price trends, supply mechanisms, institutional adoption, technological ecosystems, and future predictions, attempting to answer the question investors care about most:
"Which is the better buy right now?"
I. Price History Comparison and Current Market Status
SQR (Magic Square) and SAND (The Sandbox) Historical Price Trends
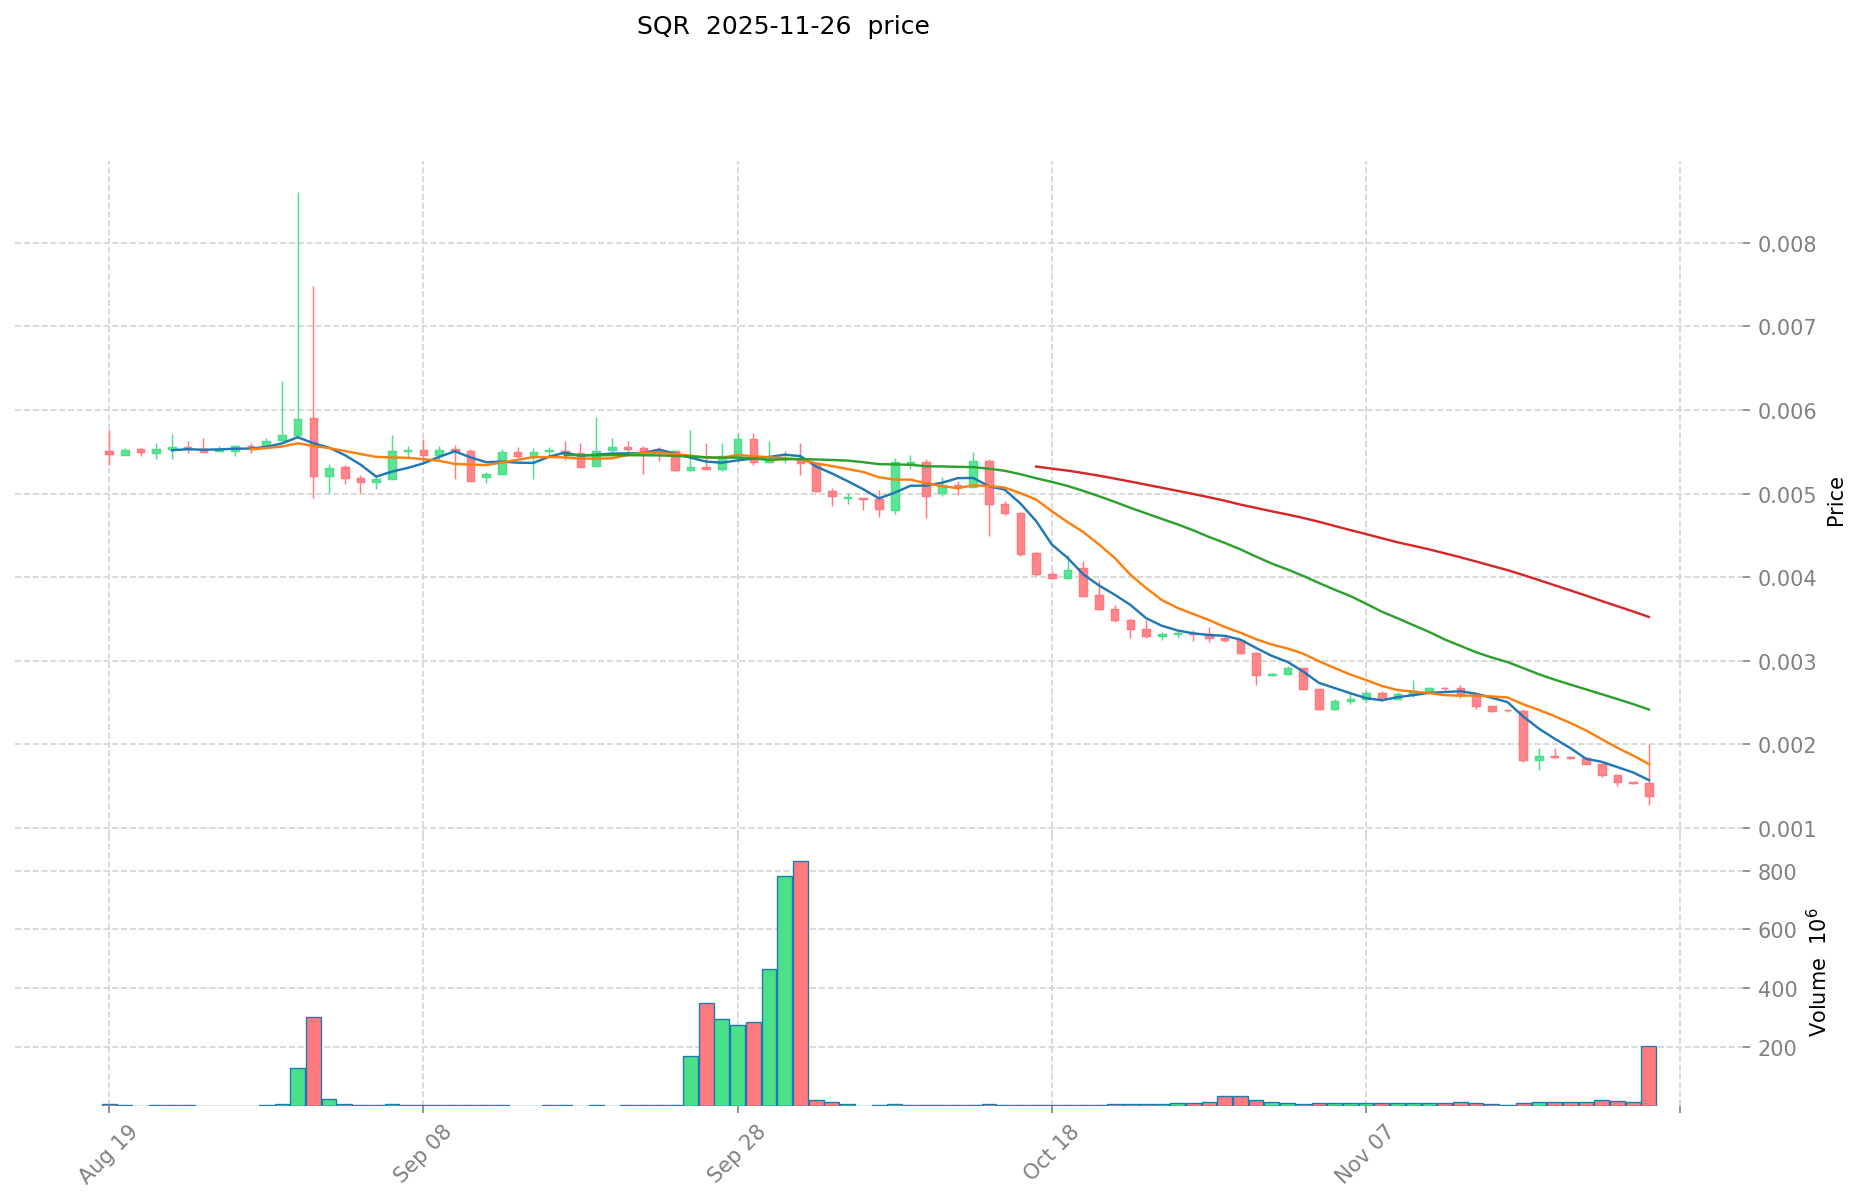
- 2024: SQR reached its all-time high of $0.8588 on January 22, 2024, likely due to significant platform developments or market enthusiasm.
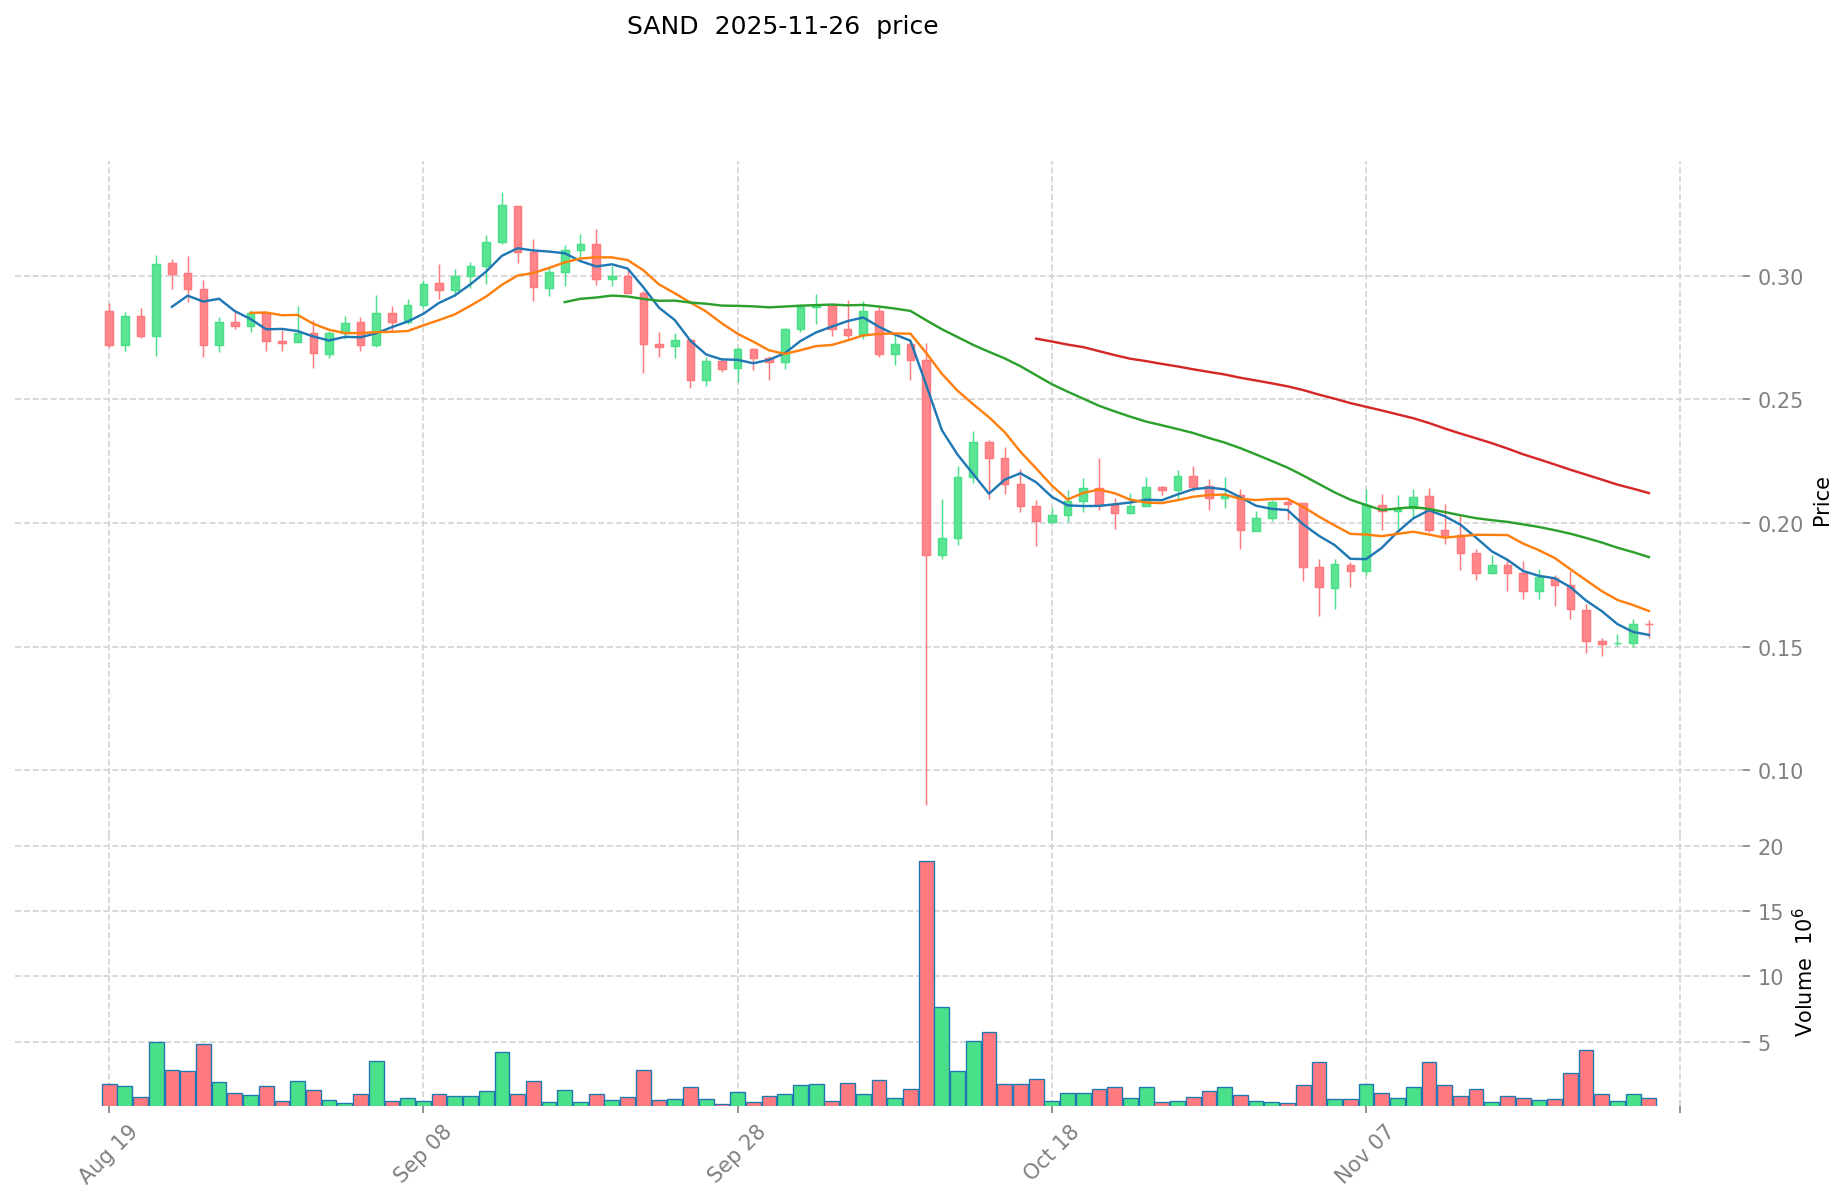
- 2021: SAND hit its all-time high of $8.4 on November 25, 2021, possibly influenced by the metaverse hype and platform growth.
- Comparative analysis: In the recent market cycle, SQR has declined from its peak of $0.8588 to a current price of $0.001348, while SAND has fallen from its high of $8.4 to $0.1613, both experiencing significant corrections.
Current Market Situation (2025-11-27)
- SQR current price: $0.001348
- SAND current price: $0.1613
- 24-hour trading volume: $56,830.68 (SQR) vs $87,495.45 (SAND)
- Market Sentiment Index (Fear & Greed Index): 20 (Extreme Fear)
Click to view real-time prices:
- View SQR current price Market Price
- View SAND current price Market Price
II. Core Factors Affecting the Investment Value of SQR vs SAND
Supply Mechanisms Comparison (Tokenomics)
- SQR: Limited supply of 10 billion tokens with 2 billion tokens in circulation
- SAND: Total supply of 3 billion tokens, with approximately 1.88 billion in circulation
- 📌 Historical pattern: Limited supply cryptocurrencies tend to experience price appreciation during periods of increased demand, while the gradual release of tokens can stabilize pricing over time.
Institutional Adoption and Market Applications
- Institutional holdings: SAND has received investment from notable venture capital firms including SoftBank, which led a $93 million funding round
- Enterprise adoption: SAND has established partnerships with major brands including Adidas, Warner Music, and Atari for metaverse projects
- Regulatory attitudes: Both tokens operate in evolving regulatory environments, with SAND's gaming and metaverse focus potentially offering clearer regulatory frameworks compared to newer projects
Technical Development and Ecosystem Building
- SQR technical upgrades: Building a metaverse ecosystem with connected Play-to-Earn games
- SAND technical development: Established metaverse platform with creator tools and SDK for building experiences
- Ecosystem comparison: SAND features a more developed ecosystem with functioning NFT marketplace, land sales, and metaverse experiences, while SQR is still developing its infrastructure
Macroeconomic Factors and Market Cycles
- Inflation performance: Limited supply tokens like SQR and SAND can potentially act as hedges against inflation, though market volatility often overrides this feature
- Macroeconomic monetary policy: Both tokens are affected by broader crypto market sentiment related to interest rates and dollar strength
- Geopolitical factors: Growing interest in digital ownership and virtual experiences has boosted metaverse projects during global uncertainty
III. 2025-2030 Price Prediction: SQR vs SAND
Short-term Prediction (2025)
- SQR: Conservative $0.001242 - $0.00135 | Optimistic $0.00135 - $0.001404
- SAND: Conservative $0.106722 - $0.1617 | Optimistic $0.1617 - $0.227997
Mid-term Prediction (2027)
- SQR may enter a growth phase, expected price range $0.0009323667 - $0.0021551427
- SAND may enter a bullish market, expected price range $0.1532678301 - $0.2821016583
- Key drivers: Institutional investment inflow, ETF developments, ecosystem growth
Long-term Prediction (2030)
- SQR: Base scenario $0.00197294296212 - $0.002387260984165 | Optimistic scenario $0.002387260984165+
- SAND: Base scenario $0.311903421694672 - $0.37116507181666 | Optimistic scenario $0.37116507181666+
Disclaimer
SQR:
| 年份 | 预测最高价 | 预测平均价格 | 预测最低价 | 涨跌幅 |
|---|---|---|---|---|
| 2025 | 0.001404 | 0.00135 | 0.001242 | 0 |
| 2026 | 0.00167994 | 0.001377 | 0.0012393 | 2 |
| 2027 | 0.0021551427 | 0.00152847 | 0.0009323667 | 13 |
| 2028 | 0.001989150858 | 0.00184180635 | 0.0012340102545 | 36 |
| 2029 | 0.00203040732024 | 0.001915478604 | 0.00130252545072 | 42 |
| 2030 | 0.002387260984165 | 0.00197294296212 | 0.001874295814014 | 46 |
SAND:
| 年份 | 预测最高价 | 预测平均价格 | 预测最低价 | 涨跌幅 |
|---|---|---|---|---|
| 2025 | 0.227997 | 0.1617 | 0.106722 | 0 |
| 2026 | 0.24940608 | 0.1948485 | 0.122754555 | 20 |
| 2027 | 0.2821016583 | 0.22212729 | 0.1532678301 | 37 |
| 2028 | 0.3201853821705 | 0.25211447415 | 0.2395087504425 | 56 |
| 2029 | 0.337656915229095 | 0.28614992816025 | 0.16024395976974 | 77 |
| 2030 | 0.37116507181666 | 0.311903421694672 | 0.174665916149016 | 93 |
IV. Investment Strategy Comparison: SQR vs SAND
Long-term vs Short-term Investment Strategies
- SQR: Suitable for investors focused on emerging Web3 ecosystems and app store potential
- SAND: Suitable for investors interested in metaverse and gaming sector growth
Risk Management and Asset Allocation
- Conservative investors: SQR: 20% vs SAND: 80%
- Aggressive investors: SQR: 40% vs SAND: 60%
- Hedging tools: Stablecoin allocation, options, cross-token portfolio
V. Potential Risk Comparison
Market Risks
- SQR: Newer project with less established market presence
- SAND: Susceptibility to metaverse and gaming industry trends
Technical Risks
- SQR: Scalability, network stability
- SAND: Ecosystem adoption, platform security
Regulatory Risks
- Global regulatory policies may impact both tokens differently, with SAND potentially facing clearer frameworks due to its established gaming focus
VI. Conclusion: Which Is the Better Buy?
📌 Investment Value Summary:
- SQR advantages: Potential growth as Web3 app store, limited supply
- SAND advantages: Established metaverse platform, strong partnerships, developed ecosystem
✅ Investment Advice:
- New investors: Consider a small allocation to SAND for exposure to the metaverse sector
- Experienced investors: Balanced approach with both tokens, higher allocation to SAND
- Institutional investors: Research-driven approach, potential for larger SAND allocation due to established ecosystem
⚠️ Risk Warning: Cryptocurrency markets are highly volatile. This article does not constitute investment advice. None
VII. FAQ
Q1: What are the main differences between SQR and SAND? A: SQR is a newer project focused on being a Web3 App Store, while SAND is an established metaverse and gaming platform. SQR has a total supply of 10 billion tokens, with 2 billion in circulation, while SAND has a total supply of 3 billion tokens, with about 1.88 billion in circulation. SAND has more developed partnerships and a functioning ecosystem, whereas SQR is still building its infrastructure.
Q2: Which token has performed better historically? A: SAND has a longer price history and reached its all-time high of $8.4 in November 2021. SQR, being newer, reached its all-time high of $0.8588 in January 2024. Both have experienced significant corrections since their peaks.
Q3: What are the key factors affecting the investment value of these tokens? A: Key factors include supply mechanisms, institutional adoption, technical development, ecosystem building, macroeconomic factors, and market cycles. SAND has stronger institutional backing and partnerships, while SQR offers potential as an emerging Web3 ecosystem.
Q4: What are the price predictions for SQR and SAND? A: By 2030, SQR is predicted to reach $0.00197294296212 - $0.002387260984165 in the base scenario, while SAND is expected to reach $0.311903421694672 - $0.37116507181666. These predictions are subject to market conditions and should not be considered as financial advice.
Q5: How should investors approach SQR and SAND in their portfolio? A: Conservative investors might consider allocating 20% to SQR and 80% to SAND, while more aggressive investors could opt for 40% SQR and 60% SAND. New investors might start with a small allocation to SAND due to its established ecosystem, while experienced investors could balance both tokens in their portfolio.
Q6: What are the main risks associated with investing in SQR and SAND? A: Market risks include SQR's newer status and SAND's susceptibility to metaverse trends. Technical risks involve scalability and security concerns. Regulatory risks may impact both tokens, with SAND potentially facing clearer frameworks due to its established gaming focus.
Q7: Which token is considered the better buy? A: The better buy depends on individual investment goals and risk tolerance. SAND offers a more established ecosystem and partnerships, making it potentially suitable for a wider range of investors. SQR presents an opportunity in the emerging Web3 app store space but comes with higher risks due to its early stage of development.
Share
Content
Introduction: SQR vs SAND Investment Comparison
I. Price History Comparison and Current Market Status
II. Core Factors Affecting the Investment Value of SQR vs SAND
III. 2025-2030 Price Prediction: SQR vs SAND
IV. Investment Strategy Comparison: SQR vs SAND
V. Potential Risk Comparison
VI. Conclusion: Which Is the Better Buy?
VII. FAQ

