SPO vs XLM: A Comparative Analysis of Two Emerging Blockchain Technologies
Introduction: Investment Comparison between SPO and XLM
In the cryptocurrency market, the comparison between Spores Network (SPO) vs Stellar (XLM) has been an unavoidable topic for investors. The two differ significantly in market cap ranking, application scenarios, and price performance, and represent different positions in the crypto asset space.
Stellar (XLM): Launched in 2014, it has gained market recognition for its efficiency in cross-border payments and as a decentralized gateway for transferring digital assets.
Spores Network (SPO): Introduced in 2021, it is designed for community governance and DeFi utilization, focusing on NFT creators and driven by the DeFi community.
This article will provide a comprehensive analysis of the investment value comparison between SPO and XLM, focusing on historical price trends, supply mechanisms, institutional adoption, technological ecosystems, and future predictions, attempting to answer the question investors are most concerned about:
"Which is the better buy right now?"
I. Price History Comparison and Current Market Status
SPO (Coin A) and XLM (Coin B) Historical Price Trends
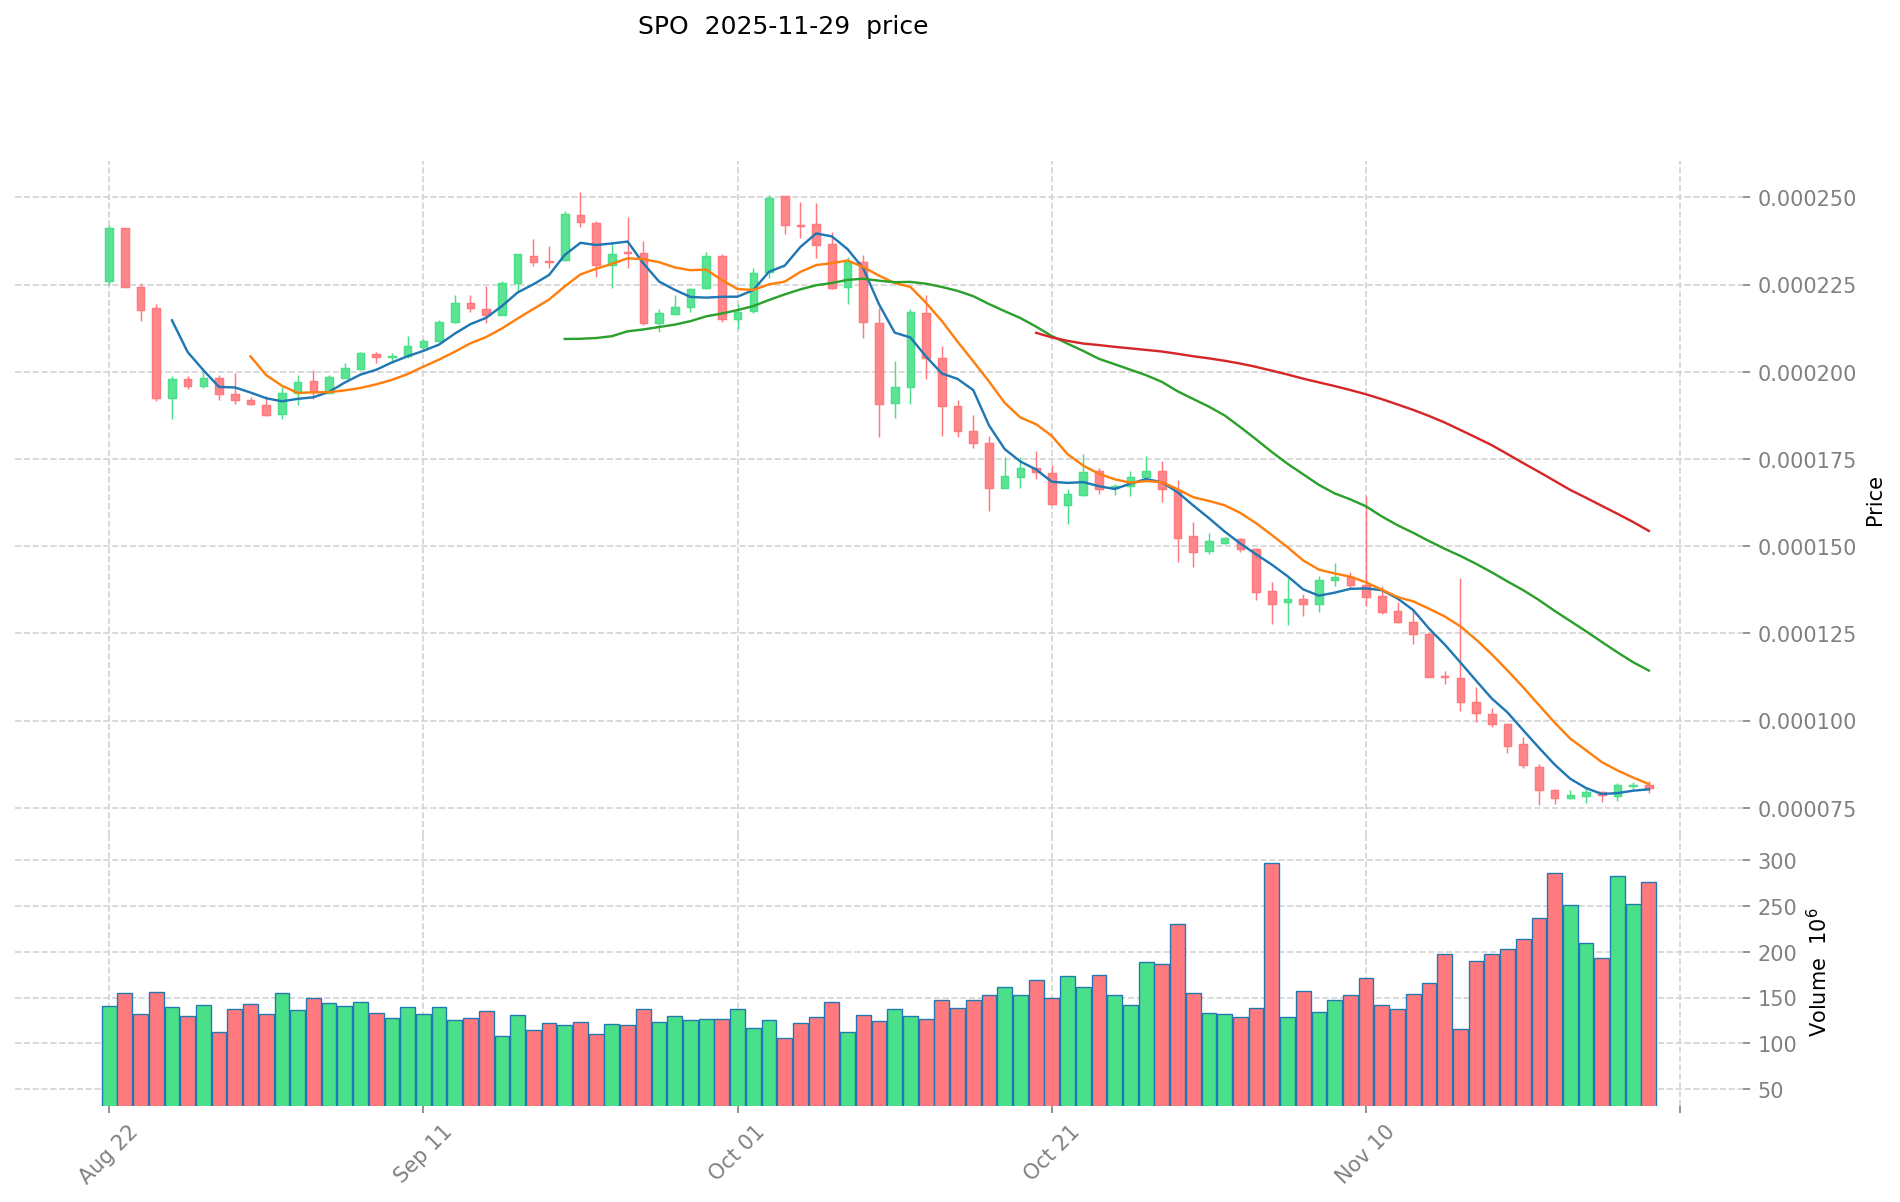
- 2021: SPO reached its all-time high of $0.109768 on August 20, 2021, shortly after its launch.
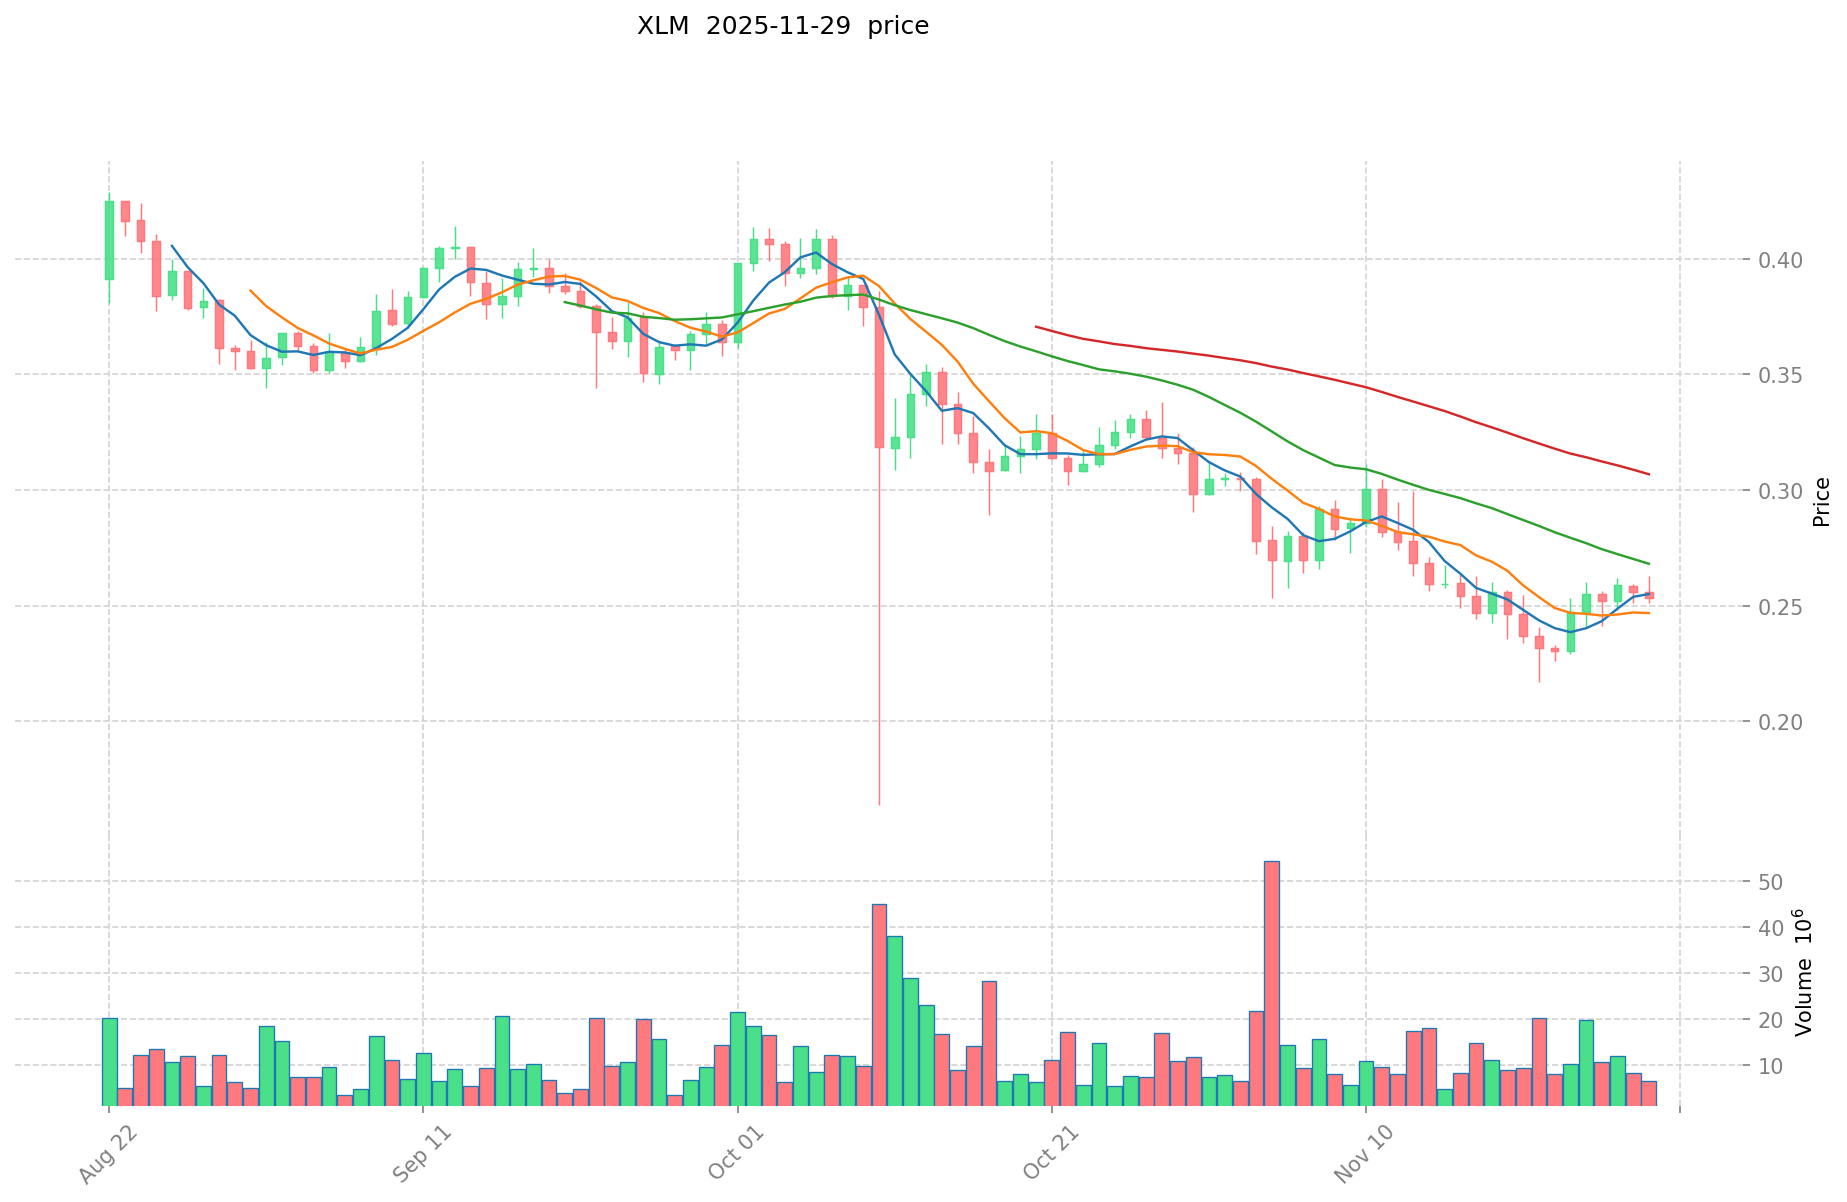
- 2018: XLM hit its all-time high of $0.875563 on January 3, 2018, during the broader cryptocurrency bull market.
- Comparative Analysis: SPO has experienced a significant decline from its all-time high, currently trading at $0.00007997. XLM has also seen a substantial decrease from its peak, now trading at $0.25548.
Current Market Situation (2025-11-30)
- SPO current price: $0.00007997
- XLM current price: $0.25548
- 24-hour trading volume: SPO $24,008.99 vs XLM $1,081,647.40
- Market Sentiment Index (Fear & Greed Index): 28 (Fear)
Click to view real-time prices:
- View SPO current price Market Price
- View XLM current price Market Price
II. Core Factors Affecting the Investment Value of SPO vs XLM
Supply Mechanisms Comparison (Tokenomics)
- SPO: Limited supply of 5 billion tokens, with deflationary mechanism through transaction fees
- XLM: Fixed supply of 50 billion tokens with no new issuance, previously had 1% annual inflation until 2019
- 📌 Historical pattern: Deflationary models like SPO's typically create upward price pressure over time, while XLM's fixed supply aims for long-term value preservation.
Institutional Adoption and Market Applications
- Institutional holdings: XLM has gained more institutional adoption through Stellar Development Foundation partnerships with financial institutions
- Enterprise adoption: XLM has stronger positioning in cross-border payments and settlements through MoneyGram and banking partnerships, while SPO focuses on decentralized identity applications
- Regulatory attitudes: XLM benefits from regulatory clarity in multiple jurisdictions due to Stellar's compliance-focused approach
Technical Development and Ecosystem Building
- SPO technical upgrades: Integration with Polygon ecosystem and focus on decentralized identity solutions
- XLM technical development: Soroban smart contract platform implementation enhancing the network's capabilities beyond payments
- Ecosystem comparison: XLM has a more developed payment infrastructure and financial services ecosystem, while SPO is building stronger presence in identity verification and credential sectors
Macroeconomic Factors and Market Cycles
- Performance in inflationary environments: Both assets offer limited inflation protection, though XLM's broader adoption may provide better stability
- Macroeconomic monetary policy: Interest rates and USD strength impact both tokens, with XLM showing slightly higher correlation to traditional markets
- Geopolitical factors: XLM benefits from increased cross-border payment demand during economic uncertainty due to its established payment corridors
III. 2025-2030 Price Prediction: SPO vs XLM
Short-term Prediction (2025)
- SPO: Conservative $0.0000408 - $0.00008 | Optimistic $0.00008 - $0.0000904
- XLM: Conservative $0.147987 - $0.25515 | Optimistic $0.25515 - $0.3801735
Mid-term Prediction (2027)
- SPO may enter a growth phase, with estimated price range $0.0000558912 - $0.0001004295
- XLM may enter a bullish market, with estimated price range $0.296854905375 - $0.483640014375
- Key drivers: Institutional capital inflow, ETF, ecosystem development
Long-term Prediction (2030)
- SPO: Base scenario $0.0001054457352 - $0.000149732943984 | Optimistic scenario $0.000149732943984+
- XLM: Base scenario $0.57228476657871 - $0.629513243236581 | Optimistic scenario $0.629513243236581+
Disclaimer: The above predictions are based on historical data and market analysis. Cryptocurrency markets are highly volatile and subject to change. This information should not be considered as financial advice.
SPO:
| 年份 | 预测最高价 | 预测平均价格 | 预测最低价 | 涨跌幅 |
|---|---|---|---|---|
| 2025 | 0.0000904 | 0.00008 | 0.0000408 | 0 |
| 2026 | 0.00008946 | 0.0000852 | 0.00004686 | 6 |
| 2027 | 0.0001004295 | 0.00008733 | 0.0000558912 | 9 |
| 2028 | 0.00010139013 | 0.00009387975 | 0.0000610218375 | 17 |
| 2029 | 0.0001132565304 | 0.00009763494 | 0.0000693208074 | 22 |
| 2030 | 0.000149732943984 | 0.0001054457352 | 0.000056940697008 | 31 |
XLM:
| 年份 | 预测最高价 | 预测平均价格 | 预测最低价 | 涨跌幅 |
|---|---|---|---|---|
| 2025 | 0.3801735 | 0.25515 | 0.147987 | 0 |
| 2026 | 0.349427925 | 0.31766175 | 0.1747139625 | 24 |
| 2027 | 0.483640014375 | 0.3335448375 | 0.296854905375 | 30 |
| 2028 | 0.510740532421875 | 0.4085924259375 | 0.339131713528125 | 60 |
| 2029 | 0.684903053977734 | 0.459666479179687 | 0.23442990438164 | 80 |
| 2030 | 0.629513243236581 | 0.57228476657871 | 0.429213574934033 | 124 |
IV. Investment Strategy Comparison: SPO vs XLM
Long-term vs Short-term Investment Strategies
- SPO: Suitable for investors focused on decentralized identity solutions and DeFi community growth
- XLM: Suitable for investors interested in cross-border payment efficiency and institutional adoption
Risk Management and Asset Allocation
- Conservative investors: SPO 10% vs XLM 90%
- Aggressive investors: SPO 30% vs XLM 70%
- Hedging tools: Stablecoin allocation, options, cross-currency portfolios
V. Potential Risk Comparison
Market Risks
- SPO: High volatility, lower liquidity, and potential for rapid price swings
- XLM: Exposure to broader cryptocurrency market trends and competition in the payment sector
Technical Risks
- SPO: Scalability, network stability
- XLM: Centralization concerns, potential security vulnerabilities in smart contract implementation
Regulatory Risks
- Global regulatory policies may have differing impacts on both assets, with XLM potentially facing more scrutiny due to its focus on financial services
VI. Conclusion: Which Is the Better Buy?
📌 Investment Value Summary:
- SPO advantages: Focus on decentralized identity, potential for growth in niche market
- XLM advantages: Established cross-border payment infrastructure, institutional partnerships
✅ Investment Advice:
- New investors: Consider XLM for its more established market position and lower volatility
- Experienced investors: Diversify with both, leaning more towards XLM for stability
- Institutional investors: Focus on XLM due to its regulatory compliance and institutional adoption
⚠️ Risk Warning: The cryptocurrency market is highly volatile. This article does not constitute investment advice. None
FAQ
Q1: What are the main differences between SPO and XLM? A: SPO focuses on decentralized identity solutions and DeFi community governance, while XLM specializes in cross-border payments and digital asset transfers. XLM has a larger market cap, higher trading volume, and more institutional adoption compared to SPO.
Q2: Which coin has performed better historically? A: XLM has shown better historical performance, reaching an all-time high of $0.875563 in January 2018. SPO's all-time high was $0.109768 in August 2021. However, both have experienced significant declines from their peaks.
Q3: How do the supply mechanisms of SPO and XLM differ? A: SPO has a limited supply of 5 billion tokens with a deflationary mechanism through transaction fees. XLM has a fixed supply of 50 billion tokens with no new issuance, having eliminated its 1% annual inflation in 2019.
Q4: What are the key factors affecting the investment value of SPO and XLM? A: Key factors include supply mechanisms, institutional adoption, market applications, technical development, ecosystem building, and macroeconomic factors such as inflation and geopolitical events.
Q5: What are the price predictions for SPO and XLM by 2030? A: For SPO, the base scenario predicts a range of $0.0001054457352 - $0.000149732943984. For XLM, the base scenario predicts a range of $0.57228476657871 - $0.629513243236581. These predictions are subject to market volatility and should not be considered financial advice.
Q6: How should investors allocate their assets between SPO and XLM? A: Conservative investors might consider allocating 10% to SPO and 90% to XLM, while aggressive investors might opt for 30% SPO and 70% XLM. However, individual investment strategies should be based on personal risk tolerance and financial goals.
Q7: What are the potential risks associated with investing in SPO and XLM? A: Risks include market volatility, technical issues such as scalability and network stability, and regulatory uncertainties. XLM may face more regulatory scrutiny due to its focus on financial services, while SPO may experience higher volatility and liquidity risks.
Share
Content
Introduction: Investment Comparison between SPO and XLM
I. Price History Comparison and Current Market Status
II. Core Factors Affecting the Investment Value of SPO vs XLM
III. 2025-2030 Price Prediction: SPO vs XLM
IV. Investment Strategy Comparison: SPO vs XLM
V. Potential Risk Comparison
VI. Conclusion: Which Is the Better Buy?
FAQ

