SERSH vs SAND: The Battle for Sustainable Energy Storage Solutions
Introduction: SERSH vs SAND Investment Comparison
In the cryptocurrency market, the comparison between SERSH and SAND has always been a topic that investors can't ignore. The two not only have significant differences in market cap ranking, application scenarios, and price performance but also represent different positioning in crypto assets.
Serenity Shield (SERSH): Since its launch, it has gained market recognition for its blockchain data storage and crypto inheritance security solutions.
Sandbox (SAND): Since its inception in 2020, it has been hailed as a virtual game world, becoming one of the cryptocurrencies with high global trading volume and market capitalization.
This article will comprehensively analyze the investment value comparison between SERSH and SAND, focusing on historical price trends, supply mechanisms, institutional adoption, technological ecosystems, and future predictions, and attempt to answer the question that investors are most concerned about:
"Which is the better buy right now?"
I. Price History Comparison and Current Market Status
SERSH (Coin A) and SAND (Coin B) Historical Price Trends
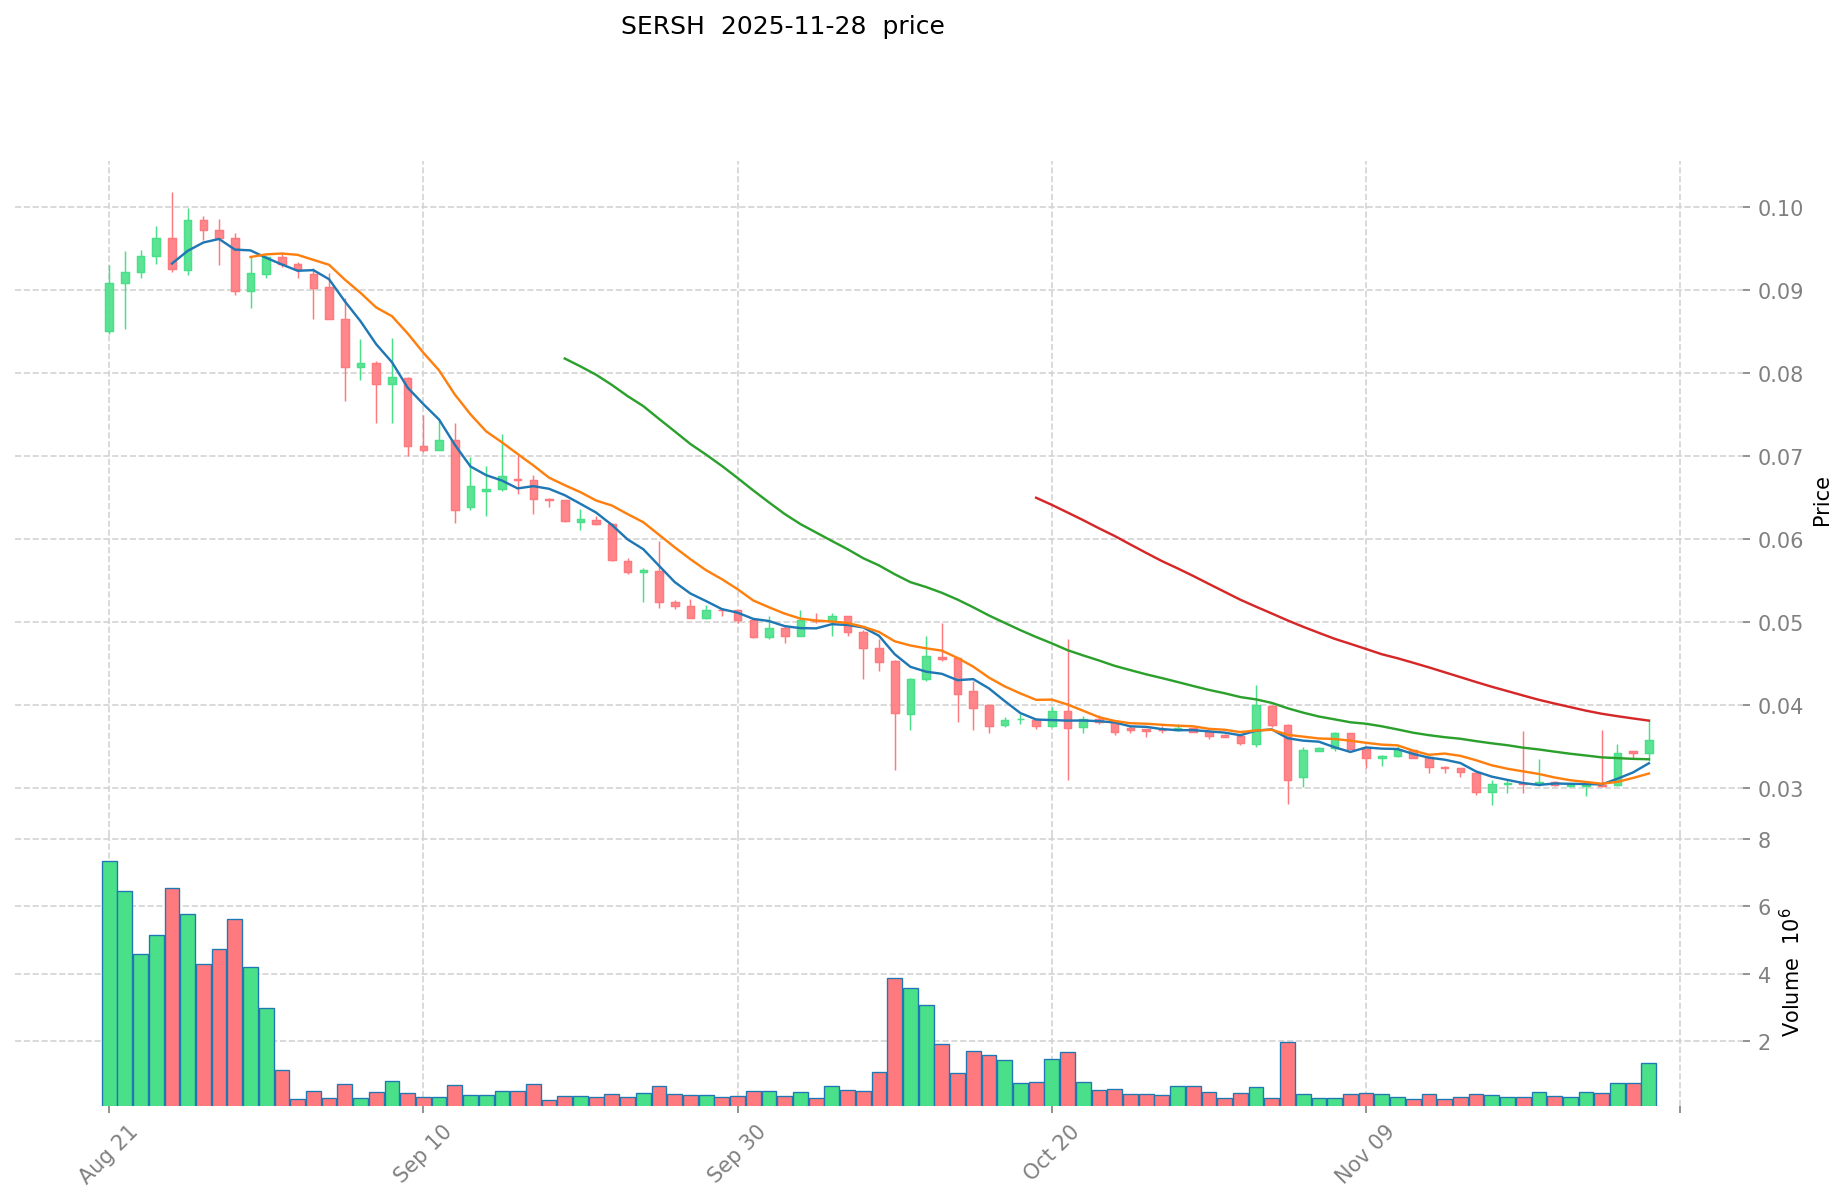
- 2023: SERSH reached its all-time high of $1.448 on December 18, 2023.
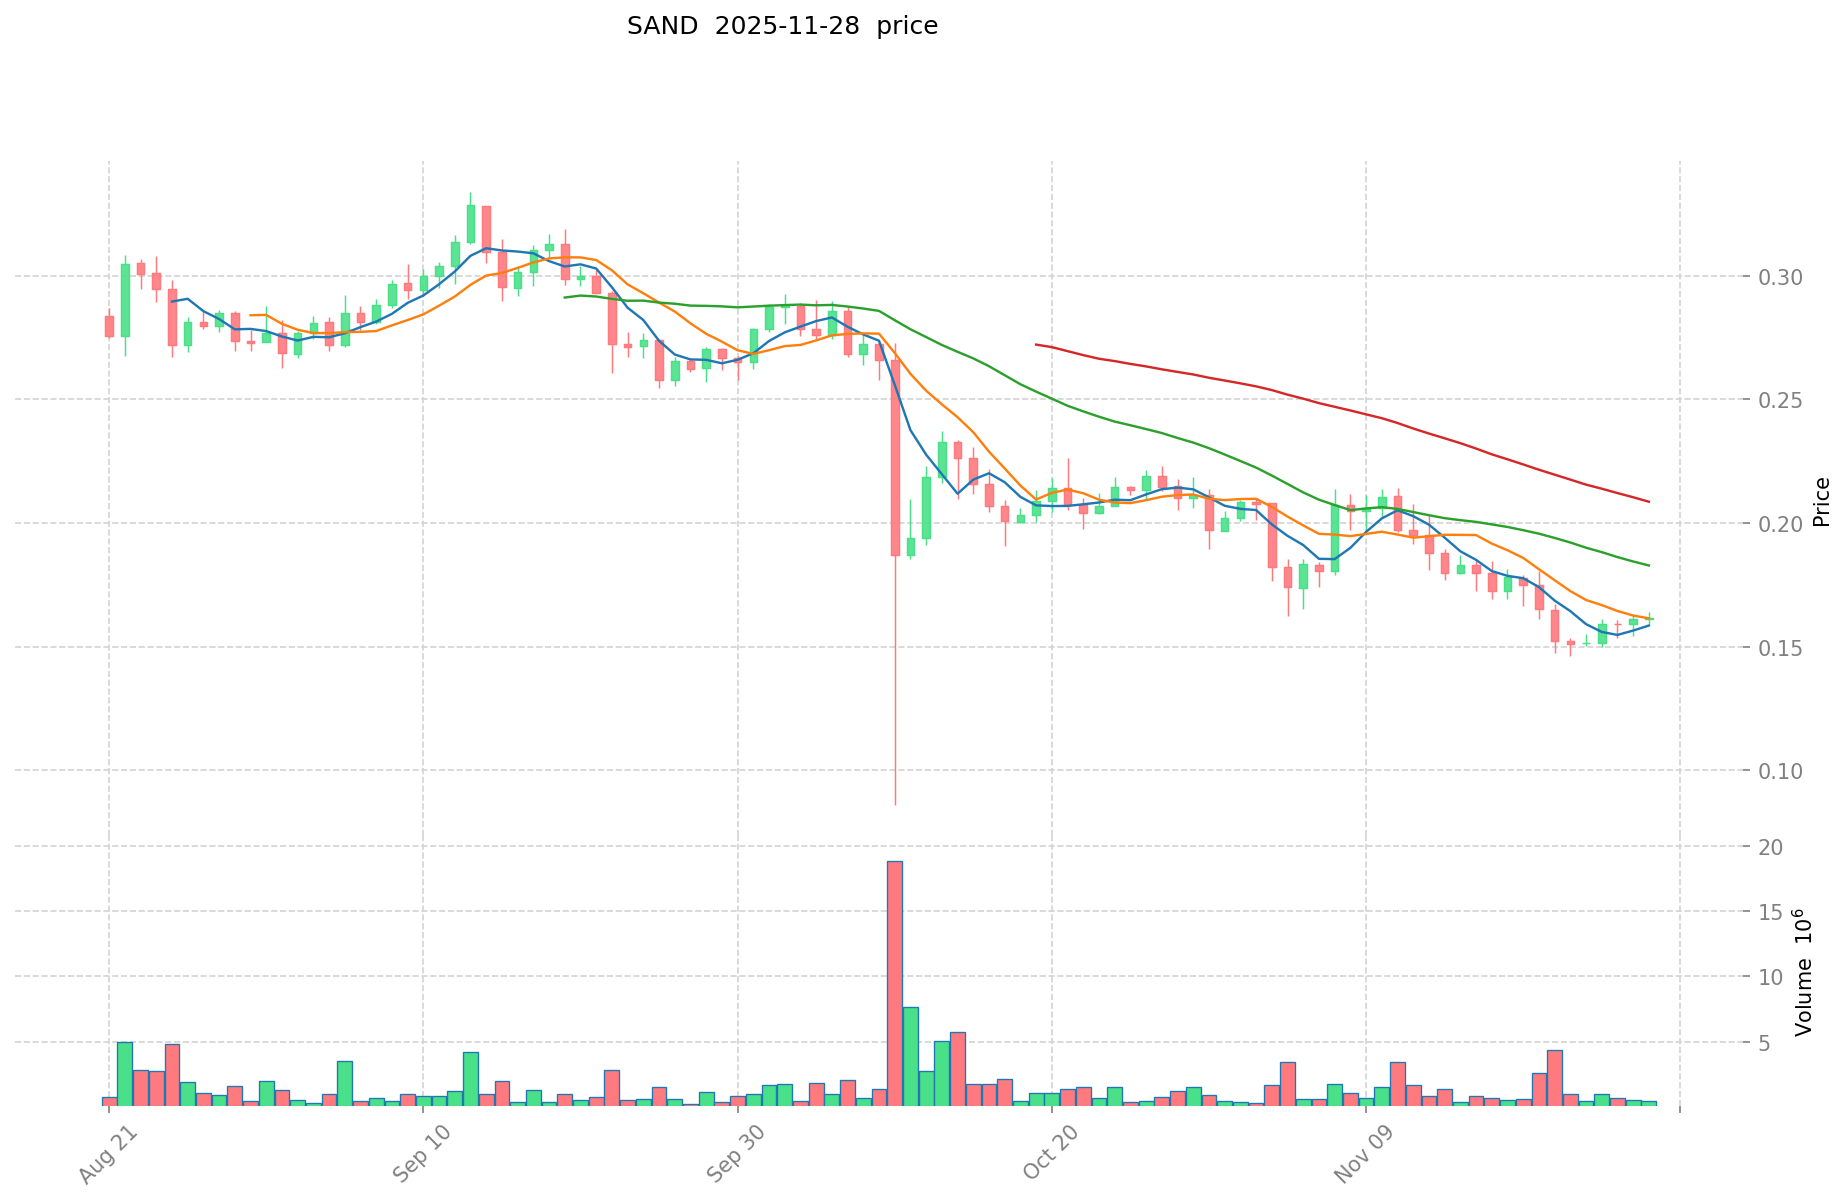
- 2021: SAND hit its all-time high of $8.4 on November 25, 2021, during the peak of the crypto bull market.
- Comparative analysis: In the recent market cycle, SERSH dropped from its high of $1.448 to a low of $0.02796, while SAND declined from $8.4 to its current price of $0.1596, representing a significant correction for both tokens.
Current Market Situation (2025-11-28)
- SERSH current price: $0.03571
- SAND current price: $0.1596
- 24-hour trading volume: SERSH $47,685.61 vs SAND $74,437.45
- Market Sentiment Index (Fear & Greed Index): 25 (Extreme Fear)
Click to view real-time prices:
- Check SERSH current price Market Price
- Check SAND current price Market Price
II. Core Factors Affecting SERSH vs SAND Investment Value
Supply Mechanism Comparison (Tokenomics)
- SERSH: Fixed supply of 2 billion tokens with deflationary mechanisms including 50% of tokens being burned
- SAND: Maximum supply of 3 billion tokens with 25.82% circulating currently
- 📌 Historical Pattern: Deflationary mechanisms like SERSH's burn policy typically create upward price pressure over time, while SAND's more gradual token release may result in more predictable price movements.
Institutional Adoption and Market Applications
- Institutional Holdings: SAND has attracted more institutional interest with backing from major VCs including SoftBank Vision Fund 2
- Enterprise Adoption: SAND has established partnerships with major brands like Adidas, Warner Music Group, and Snoop Dogg, while SERSH appears to have fewer major enterprise partnerships
- Regulatory Attitudes: Both tokens operate within the metaverse space with similar regulatory considerations across jurisdictions
Technical Development and Ecosystem Building
- SERSH Technical Development: Focus on building a play-to-earn gaming ecosystem with digital avatars
- SAND Technical Development: Robust development of metaverse platform with creator tools, marketplace, and virtual land economy
- Ecosystem Comparison: SAND has a more mature ecosystem with established NFT marketplace, virtual land economy, and numerous partnerships, while SERSH's ecosystem appears to be in earlier stages
Macroeconomic and Market Cycles
- Inflation Performance: Both tokens face similar challenges during inflationary periods as speculative digital assets
- Macroeconomic Monetary Policy: Interest rate hikes tend to negatively impact both tokens as risk assets
- Geopolitical Factors: Both metaverse tokens may benefit from increasing digital world adoption and cross-border virtual interaction trends
III. 2025-2030 Price Prediction: SERSH vs SAND
Short-term Prediction (2025)
- SERSH: Conservative $0.0305745 - $0.03597 | Optimistic $0.03597 - $0.0384879
- SAND: Conservative $0.119925 - $0.1599 | Optimistic $0.1599 - $0.199875
Mid-term Prediction (2027)
- SERSH may enter a growth phase, with prices expected to range $0.02313406953 - $0.061394261445
- SAND may enter a bullish market, with prices expected to range $0.13829751 - $0.301131675
- Key drivers: Institutional capital inflow, ETF, ecosystem development
Long-term Prediction (2030)
- SERSH: Base scenario $0.06077675974293 - $0.081440858055526 | Optimistic scenario $0.081440858055526+
- SAND: Base scenario $0.33443460765 - $0.448142374251 | Optimistic scenario $0.448142374251+
Disclaimer: The above predictions are based on historical data and market analysis. Cryptocurrency markets are highly volatile and subject to rapid changes. These projections should not be considered as financial advice. Always conduct your own research before making investment decisions.
SERSH:
| 年份 | 预测最高价 | 预测平均价格 | 预测最低价 | 涨跌幅 |
|---|---|---|---|---|
| 2025 | 0.0384879 | 0.03597 | 0.0305745 | 0 |
| 2026 | 0.0517482405 | 0.03722895 | 0.0204759225 | 4 |
| 2027 | 0.061394261445 | 0.04448859525 | 0.02313406953 | 24 |
| 2028 | 0.055588499764875 | 0.0529414283475 | 0.048176699796225 | 48 |
| 2029 | 0.067288555429672 | 0.054264964056187 | 0.037985474839331 | 51 |
| 2030 | 0.081440858055526 | 0.06077675974293 | 0.048621407794344 | 70 |
SAND:
| 年份 | 预测最高价 | 预测平均价格 | 预测最低价 | 涨跌幅 |
|---|---|---|---|---|
| 2025 | 0.199875 | 0.1599 | 0.119925 | 0 |
| 2026 | 0.2662335 | 0.1798875 | 0.115128 | 12 |
| 2027 | 0.301131675 | 0.2230605 | 0.13829751 | 39 |
| 2028 | 0.3459668355 | 0.2620960875 | 0.167741496 | 64 |
| 2029 | 0.3648377538 | 0.3040314615 | 0.20066076459 | 90 |
| 2030 | 0.448142374251 | 0.33443460765 | 0.2642033400435 | 109 |
IV. Investment Strategy Comparison: SERSH vs SAND
Long-term vs Short-term Investment Strategies
- SERSH: Suitable for investors focused on blockchain data storage and security solutions
- SAND: Suitable for investors interested in metaverse and virtual gaming worlds
Risk Management and Asset Allocation
- Conservative investors: SERSH: 30% vs SAND: 70%
- Aggressive investors: SERSH: 60% vs SAND: 40%
- Hedging tools: Stablecoin allocation, options, cross-currency portfolios
V. Potential Risk Comparison
Market Risk
- SERSH: Lower trading volume may lead to higher price volatility
- SAND: Susceptible to broader crypto market trends and metaverse hype cycles
Technical Risk
- SERSH: Scalability, network stability
- SAND: Ecosystem development pace, platform adoption
Regulatory Risk
- Global regulatory policies may affect both tokens, with potential greater scrutiny on metaverse platforms like SAND
VI. Conclusion: Which Is the Better Buy?
📌 Investment Value Summary:
- SERSH advantages: Focused blockchain security solutions, deflationary token mechanism
- SAND advantages: Established metaverse platform, strong partnerships, higher liquidity
✅ Investment Advice:
- Novice investors: Consider a smaller allocation to SAND due to its more established ecosystem
- Experienced investors: Balanced portfolio with both SERSH and SAND, adjusting based on risk tolerance
- Institutional investors: Deeper research into SAND's ecosystem growth and SERSH's technology development
⚠️ Risk Warning: The cryptocurrency market is highly volatile. This article does not constitute investment advice. None
VII. FAQ
Q1: What are the key differences between SERSH and SAND? A: SERSH focuses on blockchain data storage and crypto inheritance security solutions, while SAND is a virtual game world and metaverse platform. SERSH has a fixed supply with deflationary mechanisms, while SAND has a larger maximum supply with gradual token release.
Q2: Which token has shown better price performance recently? A: As of November 28, 2025, SAND is trading at a higher price ($0.1596) compared to SERSH ($0.03571). However, both tokens have experienced significant corrections from their all-time highs.
Q3: How do the ecosystems of SERSH and SAND compare? A: SAND has a more mature ecosystem with an established NFT marketplace, virtual land economy, and numerous partnerships with major brands. SERSH's ecosystem appears to be in earlier stages of development, focusing on building a play-to-earn gaming ecosystem.
Q4: What are the long-term price predictions for SERSH and SAND? A: By 2030, the base scenario for SERSH is $0.06077675974293 - $0.081440858055526, while for SAND it's $0.33443460765 - $0.448142374251. However, these predictions are subject to market volatility and should not be considered financial advice.
Q5: Which token is more suitable for different types of investors? A: SERSH may be more suitable for investors focused on blockchain security solutions, while SAND may appeal to those interested in metaverse and virtual gaming worlds. Conservative investors might consider allocating 30% to SERSH and 70% to SAND, while aggressive investors might opt for 60% SERSH and 40% SAND.
Q6: What are the main risks associated with investing in SERSH and SAND? A: Both tokens face market risks, technical risks, and regulatory risks. SERSH may have higher price volatility due to lower trading volume, while SAND is more susceptible to broader crypto market trends and metaverse hype cycles. Regulatory policies may affect both tokens, with potential greater scrutiny on metaverse platforms like SAND.
Share
Content
Introduction: SERSH vs SAND Investment Comparison
I. Price History Comparison and Current Market Status
II. Core Factors Affecting SERSH vs SAND Investment Value
III. 2025-2030 Price Prediction: SERSH vs SAND
IV. Investment Strategy Comparison: SERSH vs SAND
V. Potential Risk Comparison
VI. Conclusion: Which Is the Better Buy?
VII. FAQ

