This article delves into the differences between SAASGo and Kava as crypto investments, analyzing factors such as price history, supply mechanisms, institutional adoption, and technical ecosystems. It examines investment strategies, risks, and potential returns for both tokens, offering insights for new and experienced investors. The content is structured to guide readers through a detailed comparison, suggesting Kava might be favorable for stability, while SAAS offers growth potential. Discover which crypto asset could be a better buy through an informed analysis of market trends and data from Gate.
Introduction: SAAS vs KAVA Investment Comparison
In the cryptocurrency market, the comparison between SaaSGo vs Kava has been an unavoidable topic for investors. The two not only show significant differences in market cap ranking, application scenarios, and price performance, but also represent different positioning in the crypto asset space.
SaaSGo (SAAS): Since its launch, it has gained market recognition for enabling code-free deployment of peer-to-peer Dapp marketplaces.
Kava (KAVA): Introduced in 2019, it has been hailed as a cross-chain decentralized financial platform, providing mainstream digital asset lending and stablecoin services.
This article will comprehensively analyze the investment value comparison between SaaSGo and Kava, focusing on historical price trends, supply mechanisms, institutional adoption, technical ecosystems, and future predictions, attempting to answer the question that concerns investors the most:
"Which is the better buy right now?"
I. Price History Comparison and Current Market Status
SAAS and KAVA Historical Price Trends
- 2024: SAAS reached its all-time high of $0.1182 on December 20, 2024.
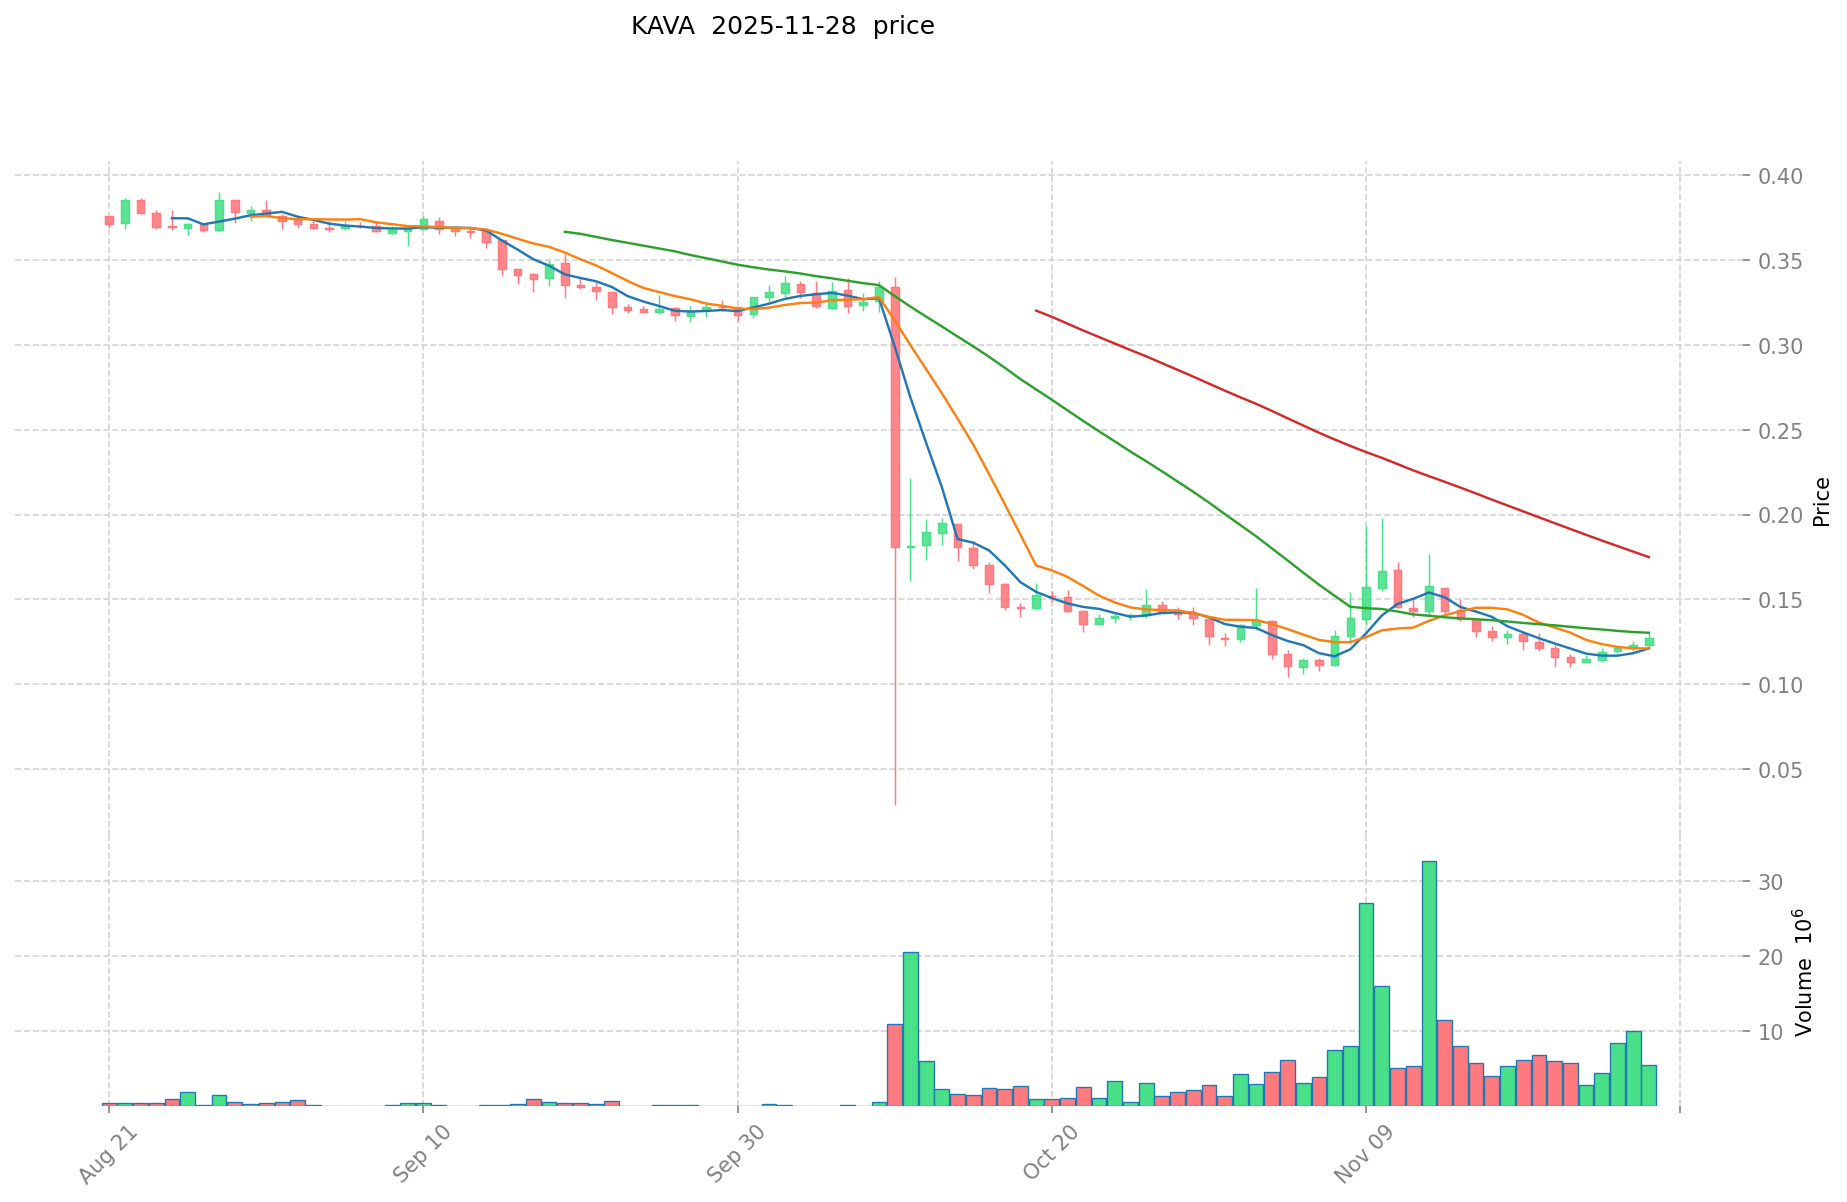
- 2025: KAVA hit its all-time low of $0.105588 on November 5, 2025.
- Comparative analysis: In the recent market cycle, SAAS dropped from its ATH of $0.1182 to its current price of $0.0003172, while KAVA has fallen from its ATH of $9.12 to $0.12788.
Current Market Situation (2025-11-28)
- SAAS current price: $0.0003172
- KAVA current price: $0.12788
- 24-hour trading volume: $17,319.67 (SAAS) vs $725,905.55 (KAVA)
- Market Sentiment Index (Fear & Greed Index): 25 (Extreme Fear)
Click to view real-time prices:
- Check SAAS current price Market Price
- Check KAVA current price Market Price

II. Core Factors Affecting the Investment Value of SAAS vs KAVA
Supply Mechanisms Comparison (Tokenomics)
- SAAS: Initial total supply of 1 billion tokens, with 27.3% allocated to the team, 13.6% to early contributors, 9.1% to early investors, and 50% to the community through ecosystem incentives and airdrops.
- KAVA: Maximum supply of 257,143,312 KAVA tokens, with an inflation rate between 3-20% depending on bonded tokens and block rewards that adjust based on protocol revenue.
- 📌 Historical Pattern: KAVA's controlled inflation model provides predictable issuance, while SAAS's large allocation to ecosystem incentives suggests potential for greater price volatility during distribution phases.
Institutional Adoption and Market Applications
- Institutional Holdings: KAVA has attracted institutional interest through its Ignition Fund with participants like Binance Labs, while SAAS's institutional backing information is limited in the provided context.
- Enterprise Adoption: KAVA has integrated with major platforms like Binance and offers cross-chain capabilities across multiple networks including Ethereum, Cosmos, and BNB Chain, enhancing its utility in cross-border payments and settlements.
- Regulatory Attitudes: Limited information provided about specific country regulations for either token.
Technical Development and Ecosystem Building
- SAAS Technical Upgrades: Building a financial infrastructure on Solana with governance token features enabling stake-weighted voting rights.
- KAVA Technical Development: Cosmos SDK-based platform with a co-chain architecture supporting Ethereum Virtual Machine and multi-chain capabilities; focuses on cross-chain DeFi services including lending and synthetic assets.
- Ecosystem Comparison: KAVA has a more established DeFi ecosystem with lending platforms, yield farming options, and cross-chain capabilities, while SAAS appears to be developing its ecosystem with a focus on staking and governance applications on Solana.
Macroeconomic Factors and Market Cycles
- Performance in Inflationary Environments: Insufficient data provided to determine which has better anti-inflation properties.
- Macroeconomic Monetary Policies: Limited information on how interest rates and USD index specifically affect these tokens.
- Geopolitical Factors: KAVA's cross-chain capabilities may provide advantages for cross-border transaction needs, but specific geopolitical impact information is not provided.
III. 2025-2030 Price Prediction: SAAS vs KAVA
Short-term Prediction (2025)
- SAAS: Conservative $0.000198765 - $0.0003155 | Optimistic $0.0003155 - $0.00039122
- KAVA: Conservative $0.1061985 - $0.12795 | Optimistic $0.12795 - $0.1906455
Mid-term Prediction (2027)
- SAAS may enter a growth phase, with expected prices ranging from $0.000299048568 to $0.000559757576
- KAVA may enter a bullish market, with expected prices ranging from $0.1130456482875 to $0.249890380425
- Key drivers: Institutional capital inflow, ETF, ecosystem development
Long-term Prediction (2030)
- SAAS: Base scenario $0.000551296610201 - $0.000788354152588 | Optimistic scenario $0.000788354152588+
- KAVA: Base scenario $0.234293749986751 - $0.260066062485294 | Optimistic scenario $0.260066062485294+
View detailed price predictions for SAAS and KAVA
Disclaimer: The above predictions are based on historical data and market trends. Cryptocurrency markets are highly volatile and subject to rapid changes. This information should not be considered as financial advice. Always conduct your own research before making any investment decisions.
SAAS:
| 年份 |
预测最高价 |
预测平均价格 |
预测最低价 |
涨跌幅 |
| 2025 |
0.00039122 |
0.0003155 |
0.000198765 |
0 |
| 2026 |
0.0004134312 |
0.00035336 |
0.0002544192 |
11 |
| 2027 |
0.000559757576 |
0.0003833956 |
0.000299048568 |
20 |
| 2028 |
0.00049987118328 |
0.000471576588 |
0.00031595631396 |
48 |
| 2029 |
0.000616869334762 |
0.00048572388564 |
0.000398293586224 |
52 |
| 2030 |
0.000788354152588 |
0.000551296610201 |
0.000490653983079 |
73 |
KAVA:
| 年份 |
预测最高价 |
预测平均价格 |
预测最低价 |
涨跌幅 |
| 2025 |
0.1906455 |
0.12795 |
0.1061985 |
0 |
| 2026 |
0.2373536475 |
0.15929775 |
0.09557865 |
24 |
| 2027 |
0.249890380425 |
0.19832569875 |
0.1130456482875 |
55 |
| 2028 |
0.23755452196275 |
0.2241080395875 |
0.1165361805855 |
75 |
| 2029 |
0.237756219198378 |
0.230831280775125 |
0.120032266003065 |
80 |
| 2030 |
0.260066062485294 |
0.234293749986751 |
0.199149687488739 |
83 |
IV. Investment Strategy Comparison: SAAS vs KAVA
Long-term vs Short-term Investment Strategy
- SAAS: Suitable for investors focusing on ecosystem potential and governance participation in the Solana network
- KAVA: Suitable for investors interested in cross-chain DeFi applications and yield farming opportunities
Risk Management and Asset Allocation
- Conservative investors: SAAS: 30% vs KAVA: 70%
- Aggressive investors: SAAS: 60% vs KAVA: 40%
- Hedging tools: Stablecoin allocation, options, cross-currency portfolio
V. Potential Risk Comparison
Market Risk
- SAAS: Higher volatility due to lower market cap and trading volume
- KAVA: Exposure to broader DeFi market fluctuations
Technical Risk
- SAAS: Scalability, network stability on Solana
- KAVA: Cross-chain vulnerabilities, smart contract risks
Regulatory Risk
- Global regulatory policies may impact both tokens differently, with potential higher scrutiny on cross-chain platforms like KAVA
VI. Conclusion: Which Is the Better Buy?
📌 Investment Value Summary:
- SAAS advantages: Potential for growth in Solana ecosystem, governance features
- KAVA advantages: Established DeFi platform, cross-chain capabilities, institutional backing
✅ Investment Advice:
- New investors: Consider a higher allocation to KAVA due to its more established ecosystem and lower volatility
- Experienced investors: Balanced approach with both tokens, leveraging KAVA's DeFi offerings and SAAS's potential growth
- Institutional investors: Focus on KAVA for its cross-chain DeFi services and institutional partnerships
⚠️ Risk Warning: Cryptocurrency markets are highly volatile. This article does not constitute investment advice.
None
VII. FAQ
Q1: What are the main differences between SAAS and KAVA?
A: SAAS is a token focused on enabling code-free deployment of peer-to-peer Dapp marketplaces on the Solana network, while KAVA is a cross-chain decentralized financial platform providing mainstream digital asset lending and stablecoin services across multiple networks including Ethereum, Cosmos, and BNB Chain.
Q2: Which token has shown better price performance recently?
A: Based on the provided data, KAVA has shown better price performance recently. While both tokens have declined from their all-time highs, KAVA's current price of $0.12788 is closer to its recent all-time low, potentially indicating a better entry point for investors.
Q3: How do the supply mechanisms of SAAS and KAVA differ?
A: SAAS has an initial total supply of 1 billion tokens, with 50% allocated to community incentives and airdrops. KAVA has a maximum supply of 257,143,312 tokens, with an inflation rate between 3-20% that adjusts based on protocol revenue and bonded tokens.
Q4: Which token has more institutional adoption?
A: KAVA appears to have more institutional adoption, with its Ignition Fund attracting participants like Binance Labs. The information provided about SAAS's institutional backing is limited.
Q5: What are the key technical developments for each token?
A: SAAS is building a financial infrastructure on Solana with governance token features. KAVA is developing a Cosmos SDK-based platform with a co-chain architecture supporting Ethereum Virtual Machine and multi-chain capabilities, focusing on cross-chain DeFi services.
Q6: What are the predicted price ranges for SAAS and KAVA in 2030?
A: For SAAS, the base scenario predicts a range of $0.000551296610201 - $0.000788354152588, with an optimistic scenario above $0.000788354152588. For KAVA, the base scenario predicts a range of $0.234293749986751 - $0.260066062485294, with an optimistic scenario above $0.260066062485294.
Q7: How should different types of investors approach SAAS and KAVA?
A: New investors might consider a higher allocation to KAVA due to its more established ecosystem and lower volatility. Experienced investors could take a balanced approach with both tokens. Institutional investors may focus on KAVA for its cross-chain DeFi services and institutional partnerships.
Q8: What are the main risks associated with investing in SAAS and KAVA?
A: For SAAS, main risks include higher volatility due to lower market cap and trading volume, as well as potential scalability issues on the Solana network. For KAVA, risks include exposure to broader DeFi market fluctuations, cross-chain vulnerabilities, and smart contract risks. Both tokens may face regulatory risks, with potentially higher scrutiny on cross-chain platforms like KAVA.
* The information is not intended to be and does not constitute financial advice or any other recommendation of any sort offered or endorsed by Gate.


