RINGAI vs TRX: Comparing Performance and Features of Two Leading Cryptocurrency Platforms
Introduction: RINGAI vs TRX Investment Comparison
In the cryptocurrency market, the comparison between Ring AI vs TRON has been an unavoidable topic for investors. The two not only show significant differences in market cap ranking, application scenarios, and price performance, but also represent different positioning in the crypto asset space.
Ring AI (RINGAI): Launched in 2024, it has gained market recognition for its AI-powered hotlines for Web2 and Web3 projects.
TRON (TRX): Since its inception in 2017, it has been hailed as a decentralized platform for content sharing and entertainment, becoming one of the largest public blockchains with sovereign state collaboration.
This article will comprehensively analyze the investment value comparison between Ring AI vs TRON, focusing on historical price trends, supply mechanisms, institutional adoption, technological ecosystems, and future predictions, attempting to answer the question investors care about most:
"Which is the better buy right now?"
I. Price History Comparison and Current Market Status
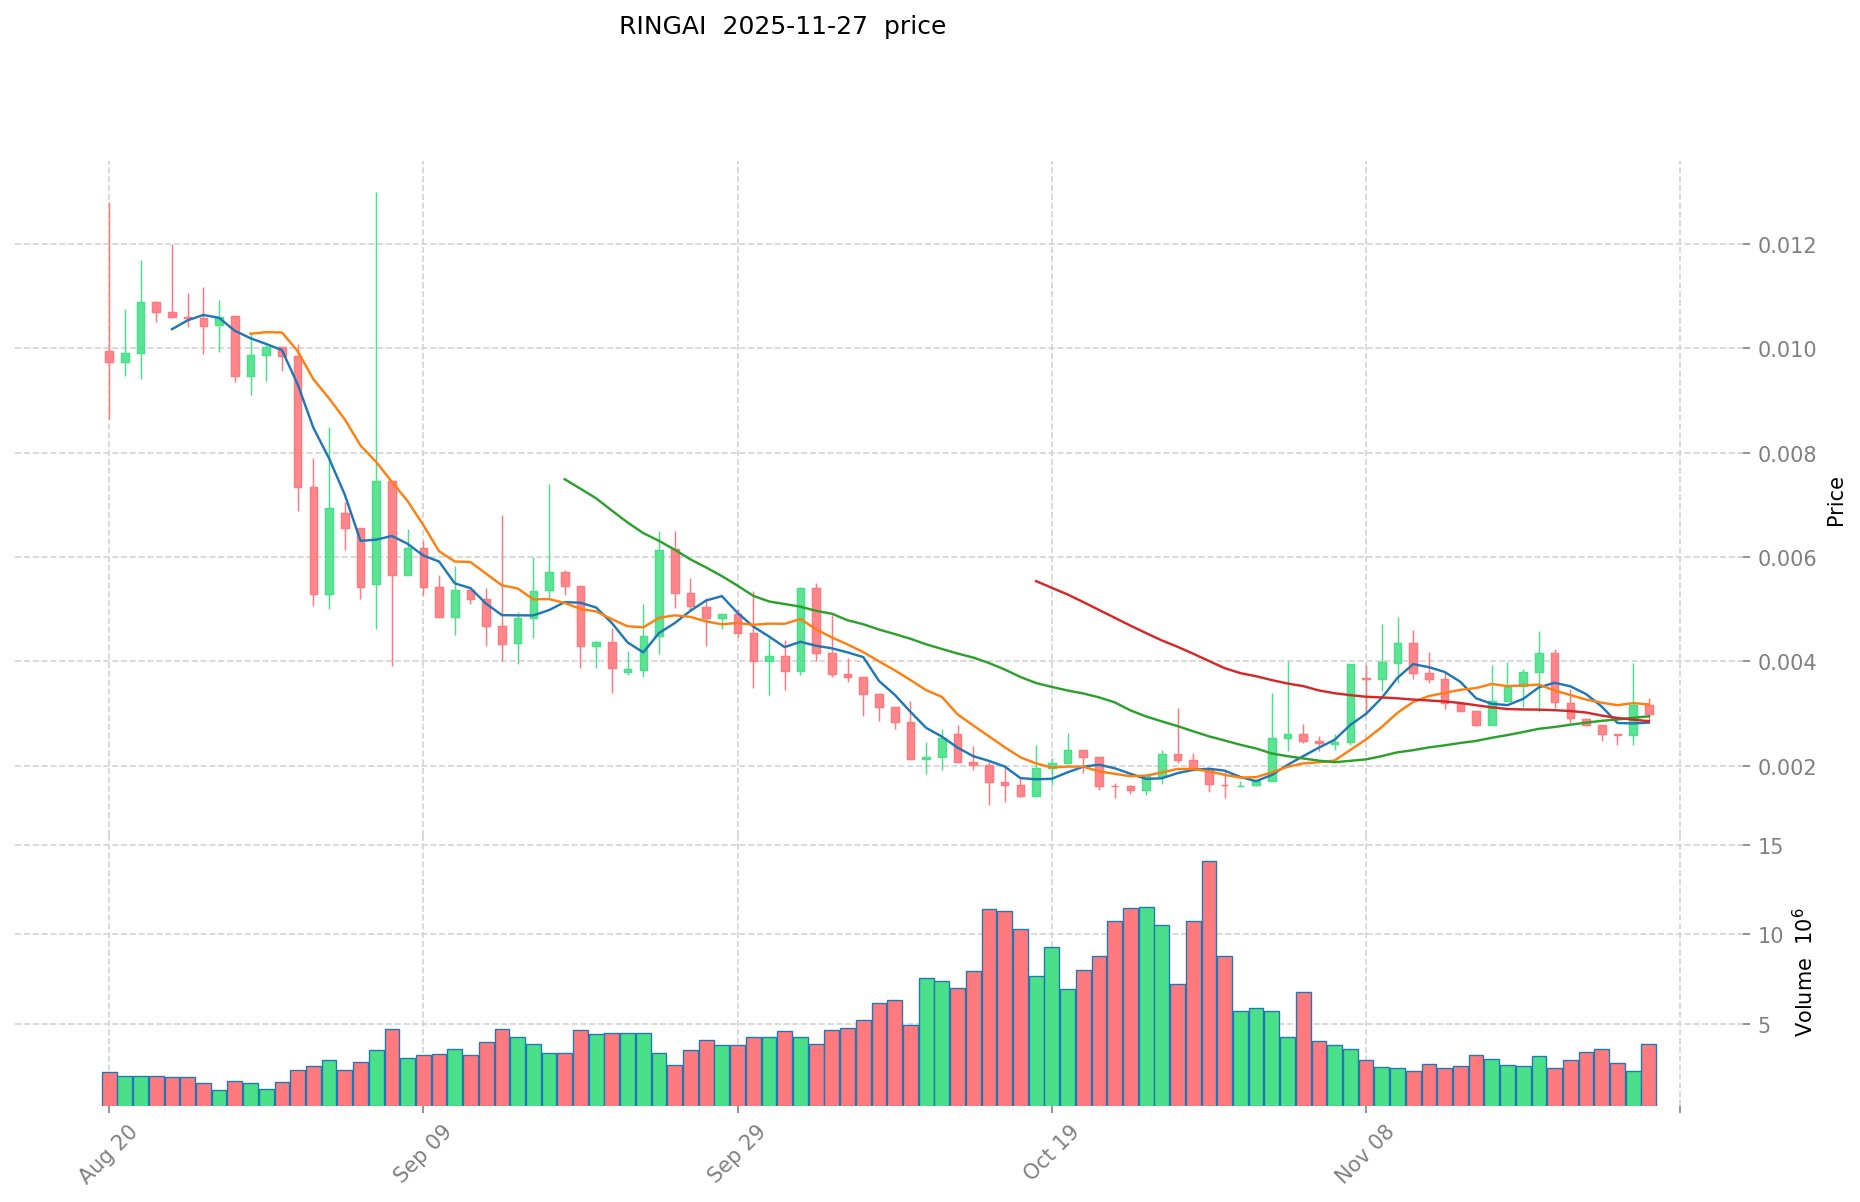
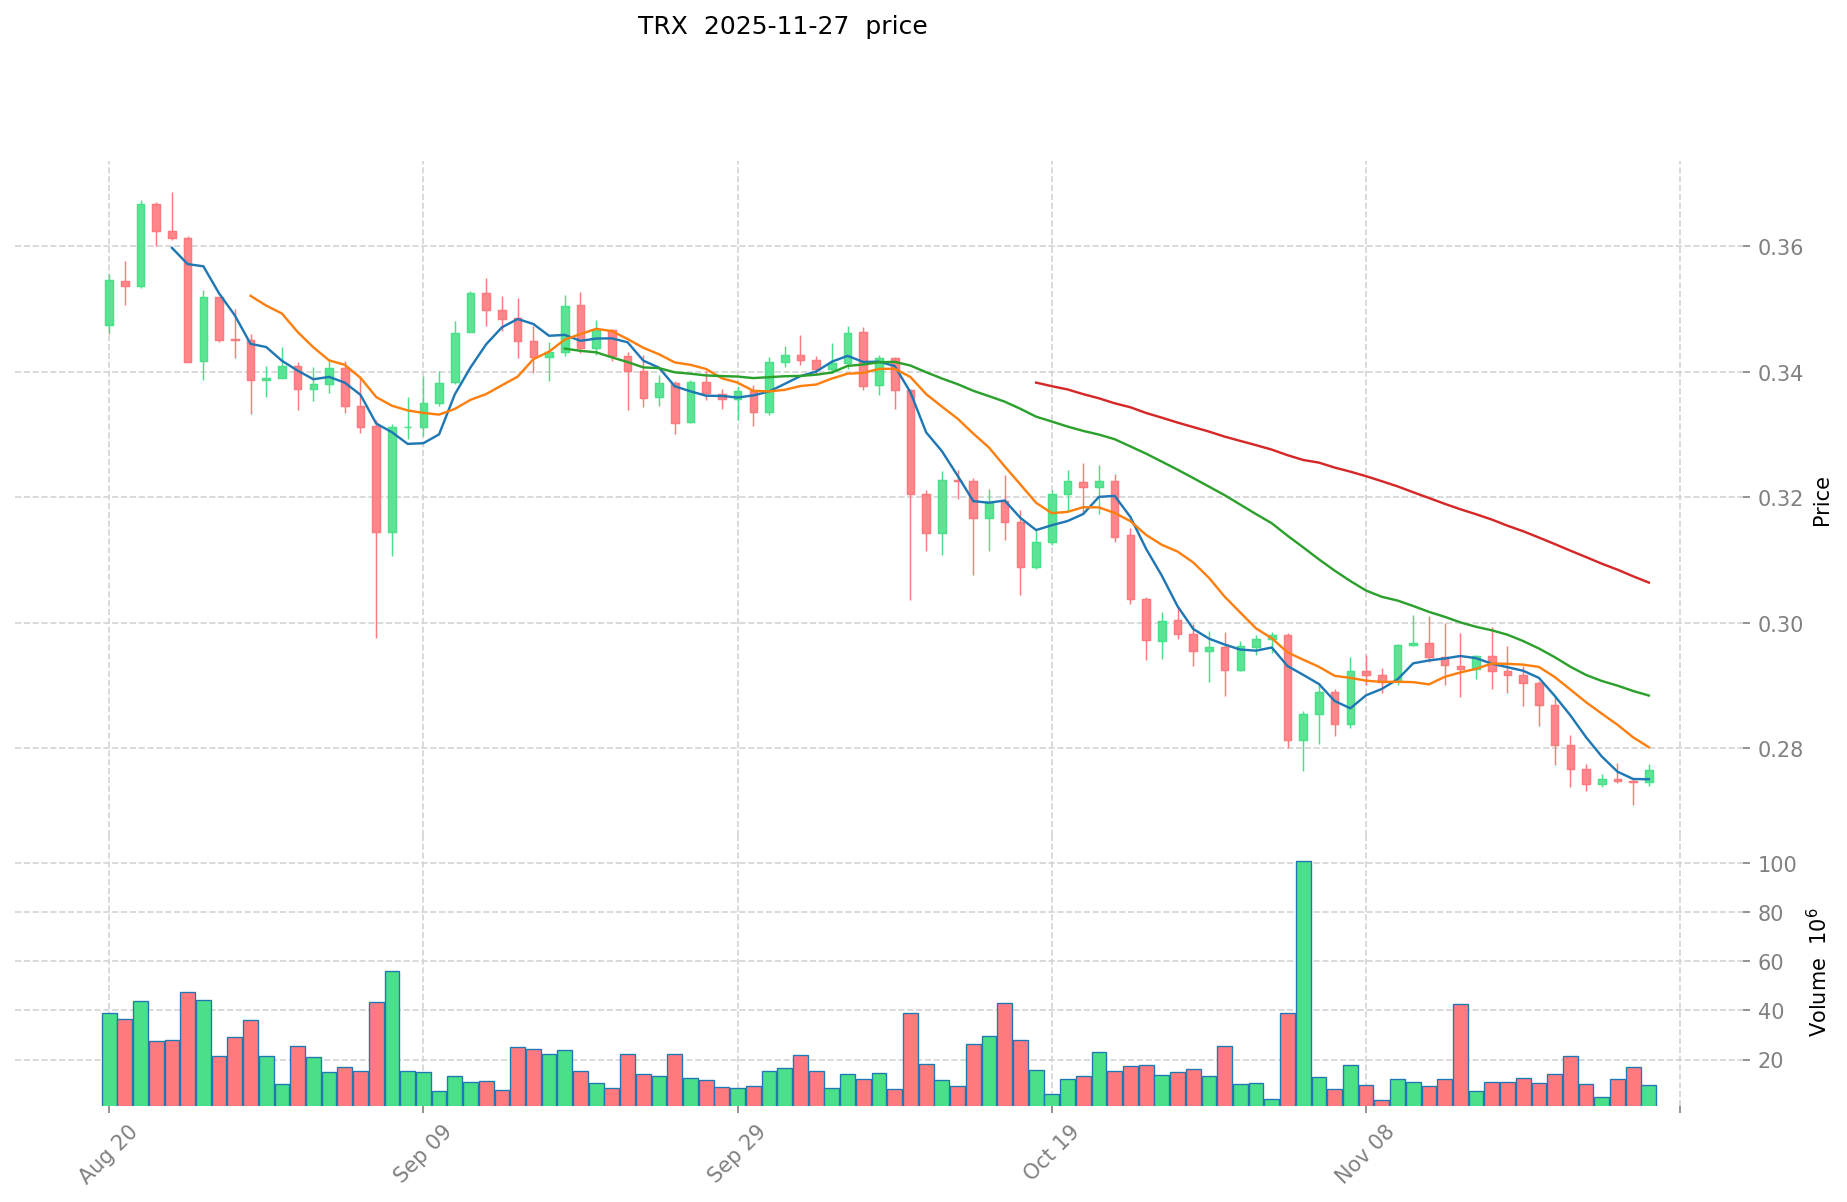
RINGAI (Coin A) and TRX (Coin B) Historical Price Trends
- 2024: RINGAI reached its all-time high of $0.329 on April 23, 2024.
- 2025: RINGAI hit its all-time low of $0.001238 on October 15, 2025.
- 2024: TRX achieved its all-time high of $0.431288 on December 4, 2024.
- Comparative analysis: In the recent market cycle, RINGAI dropped from its peak of $0.329 to its current price of $0.002919, while TRX has shown more stability, currently trading at $0.27958.
Current Market Situation (2025-11-28)
- RINGAI current price: $0.002919
- TRX current price: $0.27958
- 24-hour trading volume: RINGAI $11,808.74 vs TRX $4,678,793.63
- Market Sentiment Index (Fear & Greed Index): 22 (Extreme Fear)
Click to view real-time prices:
- Check RINGAI current price Market Price
- Check TRX current price Market Price
II. Core Factors Affecting RINGAI vs TRX Investment Value
Supply Mechanism Comparison (Tokenomics)
- RINGAI: Limited supply with deflationary model and percentage of transaction fees burned
- TRX: Inflationary model with controlled issuance through Super Representative rewards and staking mechanisms
- 📌 Historical pattern: Deflationary models like RINGAI tend to create upward price pressure during high demand periods, while TRX's controlled inflation allows for sustainable network incentives.
Institutional Adoption and Market Applications
- Institutional holdings: TRX has broader institutional adoption with partnerships across gaming, entertainment and DeFi sectors
- Enterprise adoption: TRX leads in payment systems and blockchain infrastructure with integration into BitTorrent and other TRON ecosystem applications
- Regulatory attitudes: TRX faces mixed regulatory reception across jurisdictions while RINGAI's newer status means regulatory positioning is still developing
Technical Development and Ecosystem Building
- RINGAI technical upgrades: Focus on AI integration within the Ring ecosystem and enhanced scalability
- TRX technical development: TRON has established scalability solutions and continues development on cross-chain capabilities
- Ecosystem comparison: TRX has a mature ecosystem spanning DeFi, NFTs, payments and dApps, while RINGAI is building its ecosystem with focus on AI applications and user engagement
Macroeconomic Factors and Market Cycles
- Performance during inflation: TRX has demonstrated relative stability during inflationary periods due to its established market position
- Macroeconomic monetary policy: Interest rate changes impact both assets, with TRX showing more correlation to broader crypto market movements
- Geopolitical factors: TRX's wider global adoption provides some hedge against regional regulatory challenges
III. 2025-2030 Price Prediction: RINGAI vs TRX
Short-term Prediction (2025)
- RINGAI: Conservative $0.00210888 - $0.002929 | Optimistic $0.002929 - $0.00328048
- TRX: Conservative $0.1705438 - $0.27958 | Optimistic $0.27958 - $0.321517
Mid-term Prediction (2027)
- RINGAI may enter a growth phase, with estimated price range $0.001764734216 - $0.004254269985
- TRX may enter a steady growth phase, with estimated price range $0.3000676224 - $0.4657299556
- Key drivers: Institutional capital inflow, ETF, ecosystem development
Long-term Prediction (2030)
- RINGAI: Base scenario $0.002612933390963 - $0.005024871905699 | Optimistic scenario $0.005024871905699 - $0.007487059139492
- TRX: Base scenario $0.382800044872299 - $0.45571433913369 | Optimistic scenario $0.45571433913369 - $0.58787149748246
Disclaimer: This analysis is based on historical data and market projections. Cryptocurrency markets are highly volatile and unpredictable. This information should not be considered as financial advice. Always conduct your own research before making investment decisions.
RINGAI:
| 年份 | 预测最高价 | 预测平均价格 | 预测最低价 | 涨跌幅 |
|---|---|---|---|---|
| 2025 | 0.00328048 | 0.002929 | 0.00210888 | 0 |
| 2026 | 0.0031978822 | 0.00310474 | 0.0030115978 | 6 |
| 2027 | 0.004254269985 | 0.0031513111 | 0.001764734216 | 7 |
| 2028 | 0.005517157908325 | 0.0037027905425 | 0.00199950689295 | 26 |
| 2029 | 0.005439769585986 | 0.004609974225412 | 0.003180882215534 | 57 |
| 2030 | 0.007487059139492 | 0.005024871905699 | 0.002612933390963 | 72 |
TRX:
| 年份 | 预测最高价 | 预测平均价格 | 预测最低价 | 涨跌幅 |
|---|---|---|---|---|
| 2025 | 0.321517 | 0.27958 | 0.1705438 | 0 |
| 2026 | 0.32459238 | 0.3005485 | 0.21038395 | 7 |
| 2027 | 0.4657299556 | 0.31257044 | 0.3000676224 | 11 |
| 2028 | 0.431956719558 | 0.3891501978 | 0.29186264835 | 39 |
| 2029 | 0.50087521958838 | 0.410553458679 | 0.26275421355456 | 46 |
| 2030 | 0.58787149748246 | 0.45571433913369 | 0.382800044872299 | 62 |
IV. Investment Strategy Comparison: RINGAI vs TRX
Long-term vs Short-term Investment Strategy
- RINGAI: Suitable for investors focused on AI integration and ecosystem potential
- TRX: Suitable for investors seeking stability and established ecosystem applications
Risk Management and Asset Allocation
- Conservative investors: RINGAI 10% vs TRX 90%
- Aggressive investors: RINGAI 30% vs TRX 70%
- Hedging tools: Stablecoin allocation, options, cross-currency portfolios
V. Potential Risk Comparison
Market Risk
- RINGAI: Higher volatility due to newer market status and smaller market cap
- TRX: Susceptible to broader cryptocurrency market trends
Technical Risk
- RINGAI: Scalability, network stability
- TRX: Hash power concentration, security vulnerabilities
Regulatory Risk
- Global regulatory policies have differing impacts on both assets
VI. Conclusion: Which Is the Better Buy?
📌 Investment Value Summary:
- RINGAI advantages: AI integration potential, deflationary model
- TRX advantages: Established ecosystem, broader institutional adoption
✅ Investment Advice:
- Novice investors: Consider a larger allocation to TRX for stability
- Experienced investors: Balanced portfolio with both assets, adjusting based on risk tolerance
- Institutional investors: Strategic allocation to both, with emphasis on TRX for established market presence
⚠️ Risk Warning: The cryptocurrency market is highly volatile. This article does not constitute investment advice. None
VII. FAQ
Q1: What are the main differences between RINGAI and TRX? A: RINGAI is a newer cryptocurrency focused on AI integration, with a deflationary model and limited supply. TRX is an established platform for content sharing and entertainment, with a controlled inflationary model and a mature ecosystem spanning DeFi, NFTs, payments, and dApps.
Q2: Which coin has shown better price stability? A: TRX has demonstrated more price stability compared to RINGAI. While RINGAI dropped from its peak of $0.329 to $0.002919, TRX has maintained a more stable trading range, currently at $0.27958.
Q3: How do the supply mechanisms of RINGAI and TRX differ? A: RINGAI has a limited supply with a deflationary model, burning a percentage of transaction fees. TRX uses an inflationary model with controlled issuance through Super Representative rewards and staking mechanisms.
Q4: Which coin has better institutional adoption? A: TRX has broader institutional adoption with partnerships across gaming, entertainment, and DeFi sectors. It also leads in payment systems and blockchain infrastructure integration.
Q5: What are the key factors affecting the future price of RINGAI and TRX? A: Key factors include institutional capital inflow, potential ETF approval, ecosystem development, technological upgrades, regulatory changes, and overall market sentiment.
Q6: How do the long-term price predictions for RINGAI and TRX compare? A: By 2030, RINGAI's base scenario price range is predicted to be $0.002612933390963 - $0.005024871905699, while TRX's base scenario range is $0.382800044872299 - $0.45571433913369.
Q7: What investment strategy is recommended for each coin? A: RINGAI may be suitable for investors focused on AI integration and ecosystem potential, while TRX is more suitable for those seeking stability and established ecosystem applications. Conservative investors might consider allocating 10% to RINGAI and 90% to TRX, while aggressive investors might opt for 30% RINGAI and 70% TRX.
Q8: What are the main risks associated with investing in RINGAI and TRX? A: RINGAI faces higher volatility due to its newer market status and smaller market cap, as well as potential scalability and network stability issues. TRX is susceptible to broader cryptocurrency market trends and faces risks related to hash power concentration and security vulnerabilities. Both are subject to regulatory risks that vary by jurisdiction.
Share
Content
Introduction: RINGAI vs TRX Investment Comparison
I. Price History Comparison and Current Market Status
II. Core Factors Affecting RINGAI vs TRX Investment Value
III. 2025-2030 Price Prediction: RINGAI vs TRX
IV. Investment Strategy Comparison: RINGAI vs TRX
V. Potential Risk Comparison
VI. Conclusion: Which Is the Better Buy?
VII. FAQ

