PMG vs QNT: A Comparative Analysis of Two Promising Blockchain Platforms for Enterprise Solutions
Introduction: PMG vs QNT Investment Comparison
In the cryptocurrency market, the comparison between Pomerium (PMG) vs Quant (QNT) has been an unavoidable topic for investors. The two not only differ significantly in market cap ranking, application scenarios, and price performance, but also represent different positions in the crypto asset landscape.
Pomerium (PMG): Since its launch in 2023, it has gained market recognition for its role as a blockchain Web3 game onboarding platform.
Quant (QNT): Introduced in 2018, it has been hailed as a technology provider enabling trusted digital interaction, and is one of the leading cryptocurrencies in terms of global trading volume and market capitalization.
This article will provide a comprehensive analysis of the investment value comparison between PMG and QNT, focusing on historical price trends, supply mechanisms, institutional adoption, technical ecosystems, and future predictions, attempting to answer the question investors care about most:
"Which is the better buy right now?"
I. Price History Comparison and Current Market Status
PMG and QNT Historical Price Trends
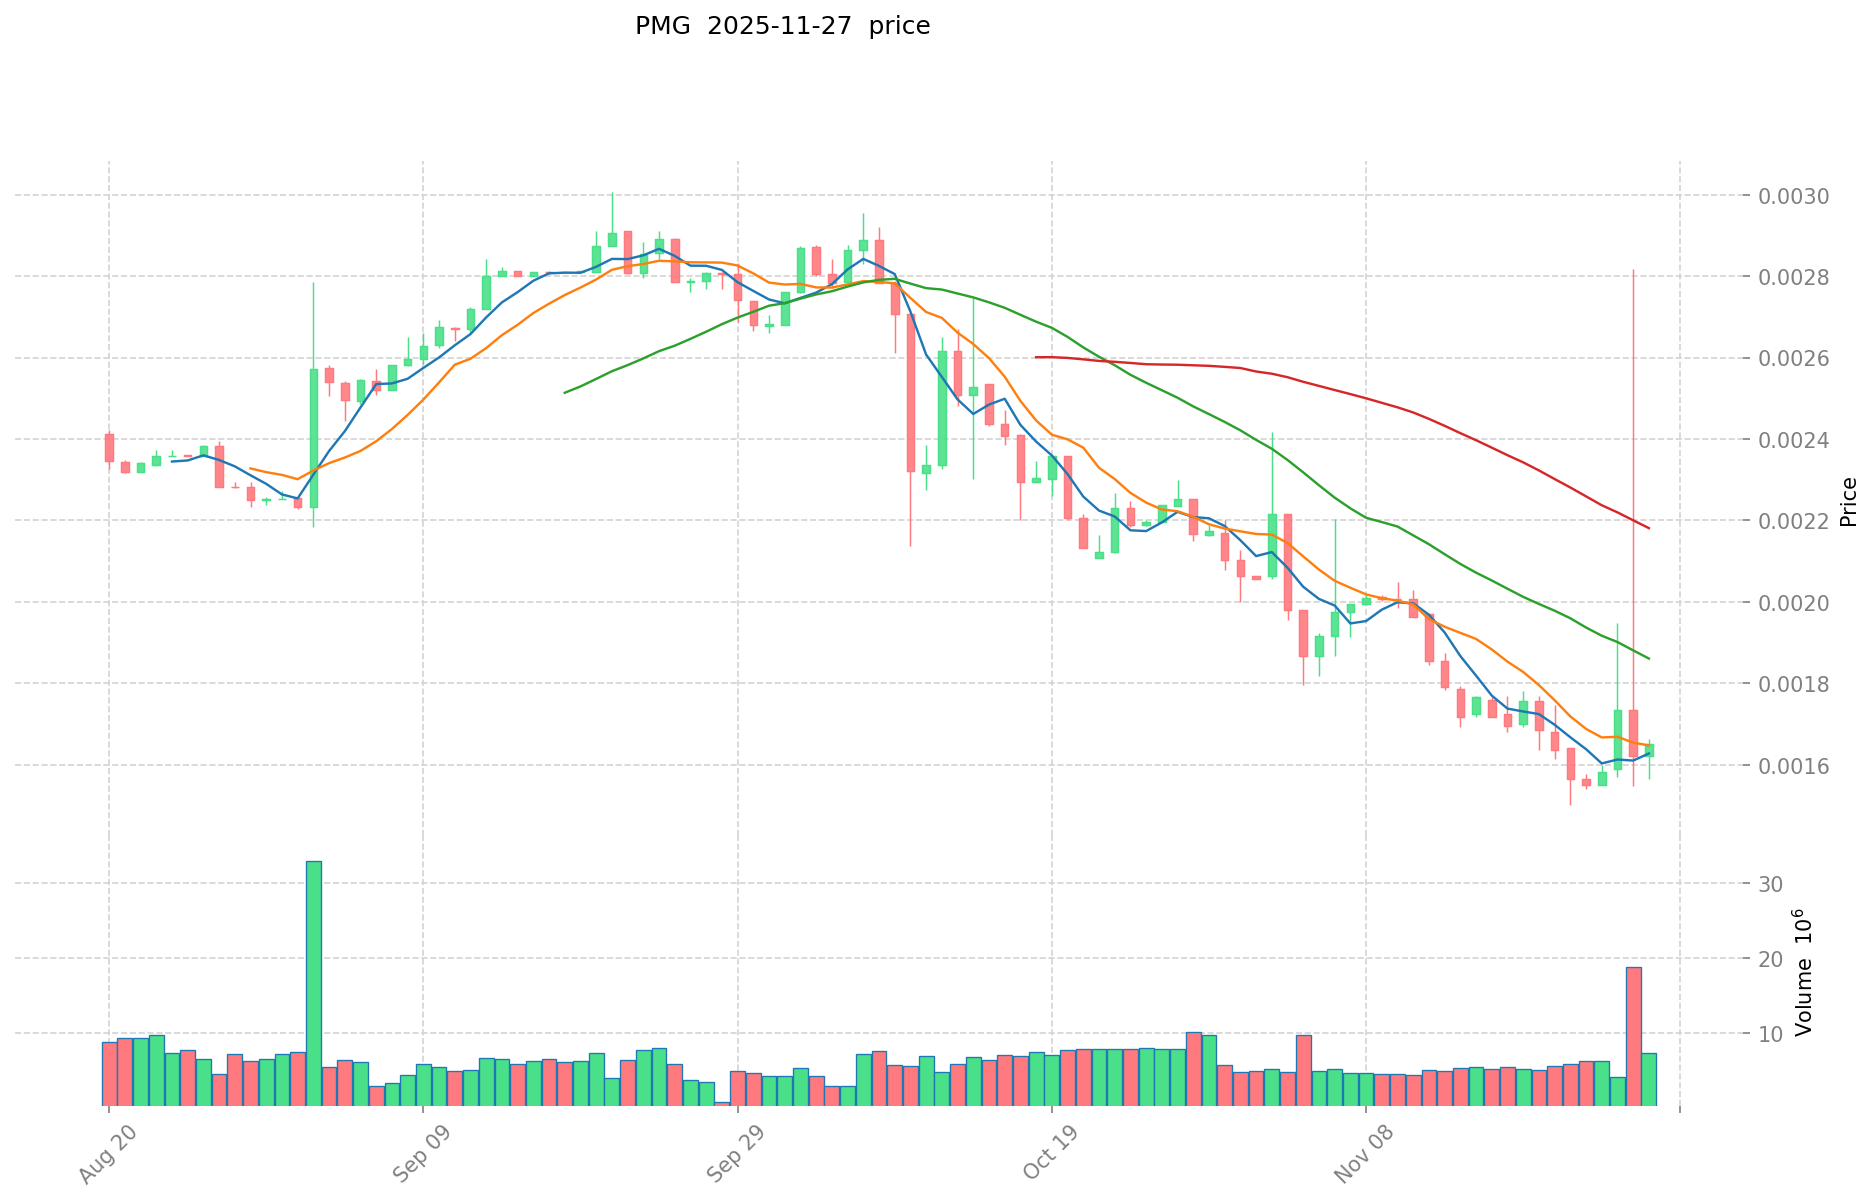
- 2024: PMG reached its all-time high of $0.29999 on June 29, 2024.
- 2025: PMG hit its all-time low of $0.0015 on November 21, 2025.
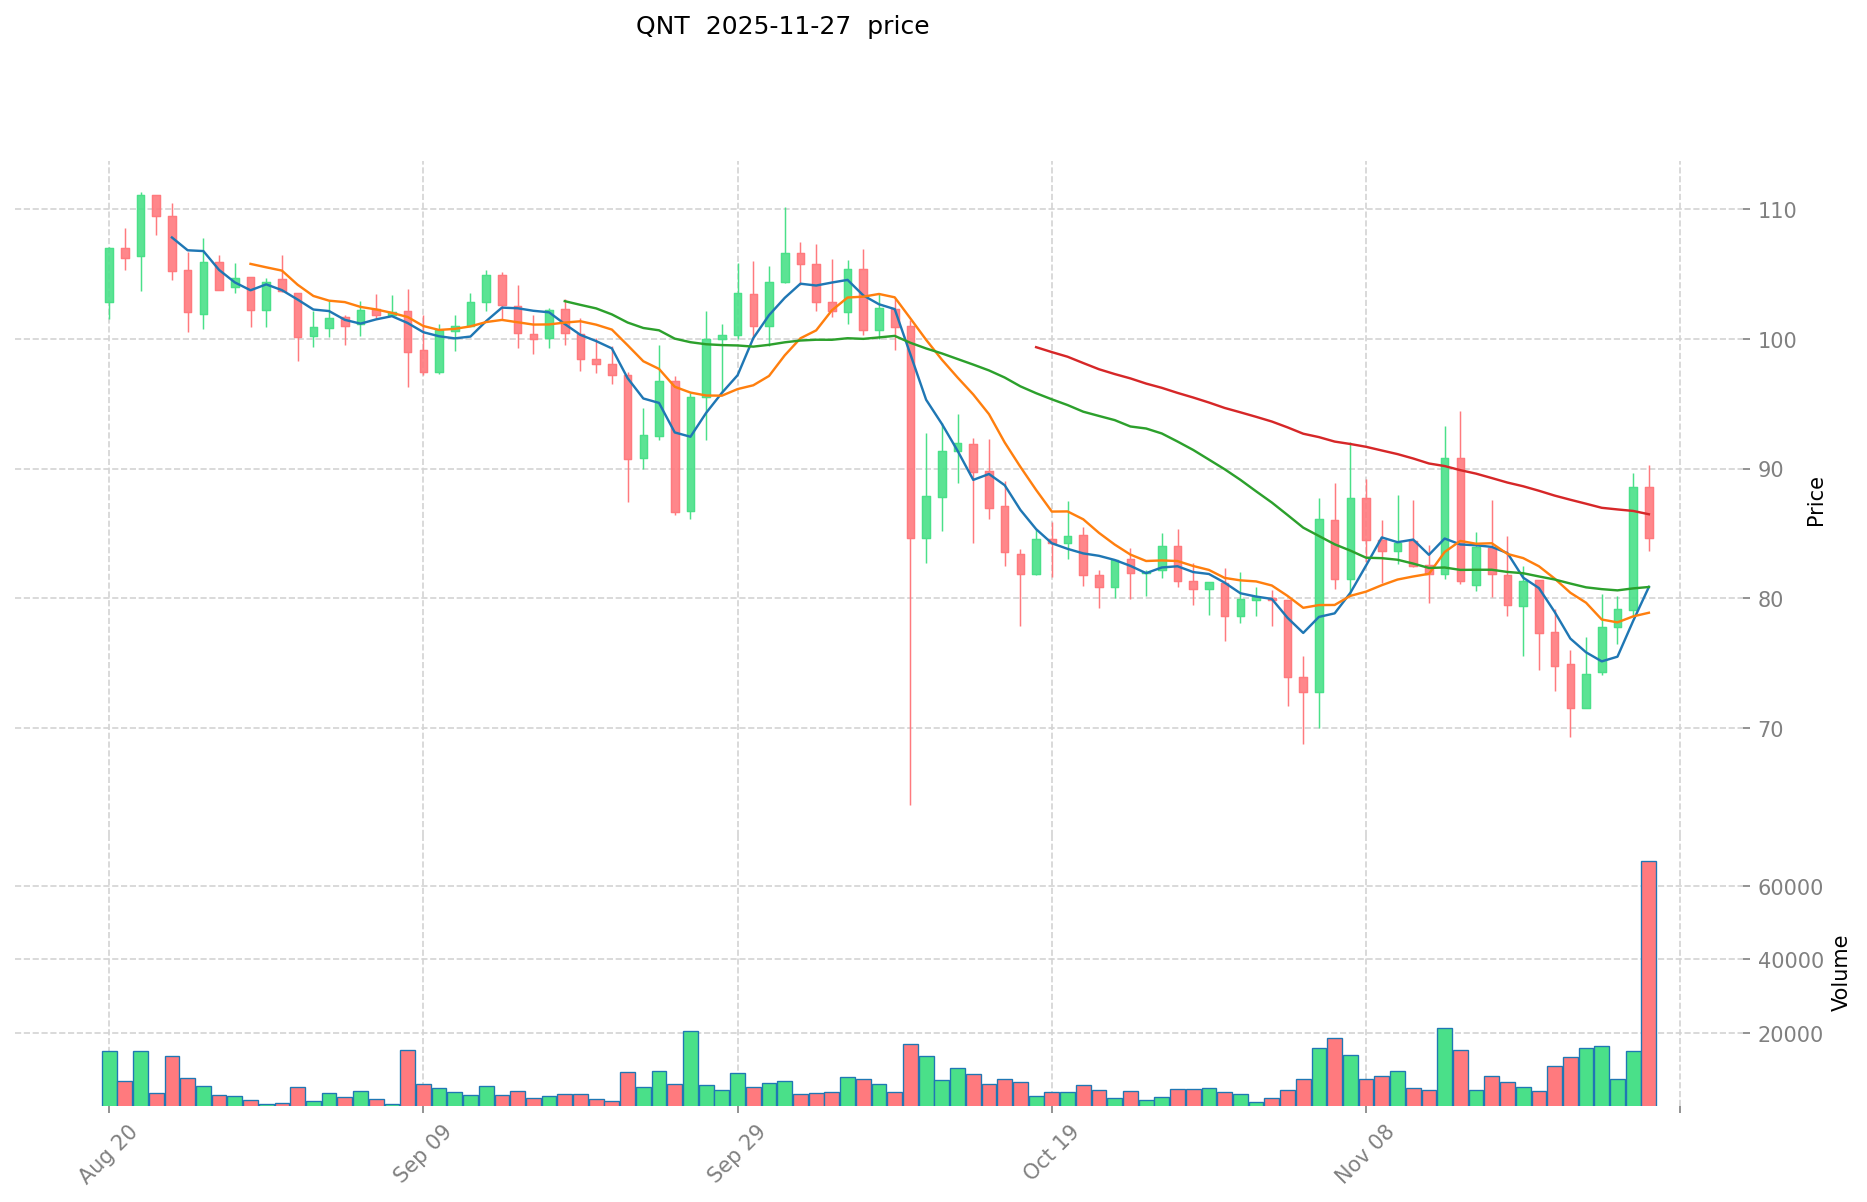
- Comparative Analysis: Over the past year, PMG has experienced a significant decline of 97.02%, dropping from its peak to near its all-time low. In contrast, QNT has shown more stability, with a more modest decline of 11.27% over the same period.
Current Market Situation (2025-11-28)
- PMG current price: $0.001621
- QNT current price: $83.36
- 24-hour trading volume: PMG $11,777.33 vs QNT $1,153,532.57
- Market Sentiment Index (Fear & Greed Index): 22 (Extreme Fear)
Click to view real-time prices:
- View PMG current price Market Price
- View QNT current price Market Price
II. Core Factors Affecting Investment Value of PMG vs QNT
Supply Mechanism Comparison (Tokenomics)
-
PMG: Fixed supply of 1 billion tokens with deflationary mechanism; 30% of tokens allocated to project growth and ecosystem development
-
QNT: Fixed total supply of 14.6 million tokens with a burning mechanism; tokens are removed from circulation when enterprises use the Overledger platform
-
📌 Historical Pattern: Deflationary tokenomics typically support price stability and potential appreciation over time as utility increases.
Institutional Adoption and Market Applications
- Institutional Holdings: QNT has stronger institutional backing with partnerships including Oracle, Amazon AWS, and SIA; PMG shows growing institutional interest but less established relationships
- Enterprise Adoption: QNT leads with enterprise integration through Overledger operating system connecting various blockchain networks; PMG focuses on cross-chain interoperability but with less enterprise penetration
- Regulatory Stance: QNT benefits from established regulatory compliance frameworks; PMG's regulatory position is still developing in major jurisdictions
Technical Development and Ecosystem Building
- PMG Technical Development: Layer-1 blockchain with cross-chain compatibility focusing on Web3 gaming infrastructure
- QNT Technical Development: Established Overledger operating system enabling multi-DLT interoperability; positioned for CBDC and enterprise blockchain solutions
- Ecosystem Comparison: QNT has stronger enterprise ecosystem integration particularly in finance and payments; PMG shows promising gaming and NFT applications but less mature DeFi and payment implementation
Macroeconomic Factors and Market Cycles
- Inflation Performance: QNT shows stronger positioning as inflation hedge due to established enterprise utility and limited supply
- Monetary Policy Impact: Both tokens face similar pressures from interest rates and dollar strength, though QNT's enterprise adoption provides some insulation
- Geopolitical Factors: QNT's positioning for CBDC development and cross-border payments gives it advantage in uncertain geopolitical environments; PMG's gaming focus is less directly impacted by cross-border trade concerns
III. Price Predictions for 2025-2030: PMG vs QNT
Short-term Forecast (2025)
- PMG: Conservative $0.00149868 - $0.001629 | Optimistic $0.001629 - $0.0022806
- QNT: Conservative $58.8661 - $82.91 | Optimistic $82.91 - $86.2264
Mid-term Forecast (2027)
- PMG may enter a growth phase, with projected prices $0.00155787786 - $0.00297413046
- QNT may enter a steady growth phase, with projected prices $62.23373838 - $123.52454133
- Key drivers: Institutional capital inflow, ETFs, ecosystem development
Long-term Forecast (2030)
- PMG: Base scenario $0.003423683429946 - $0.004998577807721 | Optimistic scenario $0.004998577807721+
- QNT: Base scenario $85.2169691324259 - $135.26503036893 | Optimistic scenario $135.26503036893 - $165.0233370500946
Disclaimer: The above predictions are based on historical data and market trends. Cryptocurrency markets are highly volatile and subject to rapid changes. These forecasts should not be considered as financial advice. Always conduct your own research before making any investment decisions.
PMG:
| 年份 | 预测最高价 | 预测平均价格 | 预测最低价 | 涨跌幅 |
|---|---|---|---|---|
| 2025 | 0.0022806 | 0.001629 | 0.00149868 | 0 |
| 2026 | 0.002091636 | 0.0019548 | 0.001094688 | 20 |
| 2027 | 0.00297413046 | 0.002023218 | 0.00155787786 | 24 |
| 2028 | 0.0030233958183 | 0.00249867423 | 0.002248806807 | 54 |
| 2029 | 0.004086331835742 | 0.00276103502415 | 0.00165662101449 | 70 |
| 2030 | 0.004998577807721 | 0.003423683429946 | 0.002773183578256 | 111 |
QNT:
| 年份 | 预测最高价 | 预测平均价格 | 预测最低价 | 涨跌幅 |
|---|---|---|---|---|
| 2025 | 86.2264 | 82.91 | 58.8661 | 0 |
| 2026 | 104.018886 | 84.5682 | 60.043422 | 1 |
| 2027 | 123.52454133 | 94.293543 | 62.23373838 | 13 |
| 2028 | 152.472659031 | 108.909042165 | 64.25633487735 | 30 |
| 2029 | 139.83921013986 | 130.690850598 | 125.46321657408 | 56 |
| 2030 | 165.0233370500946 | 135.26503036893 | 85.2169691324259 | 62 |
IV. Investment Strategy Comparison: PMG vs QNT
Long-term vs Short-term Investment Strategies
- PMG: Suitable for investors focused on Web3 gaming potential and ecosystem growth
- QNT: Suitable for investors seeking enterprise adoption and interoperability solutions
Risk Management and Asset Allocation
- Conservative investors: PMG: 20% vs QNT: 80%
- Aggressive investors: PMG: 40% vs QNT: 60%
- Hedging tools: Stablecoin allocation, options, cross-currency portfolios
V. Potential Risk Comparison
Market Risks
- PMG: High volatility due to nascent market position and gaming sector dependencies
- QNT: Exposure to enterprise adoption rates and competition in interoperability solutions
Technical Risks
- PMG: Scalability, network stability in gaming environments
- QNT: Centralization concerns, potential security vulnerabilities in multi-chain operations
Regulatory Risks
- Global regulatory policies may impact PMG more significantly due to its focus on gaming and NFTs, while QNT may benefit from its enterprise-focused approach and existing compliance frameworks
VI. Conclusion: Which Is the Better Buy?
📌 Investment Value Summary:
- PMG advantages: Web3 gaming focus, potential for rapid growth in emerging market
- QNT advantages: Established enterprise partnerships, strong positioning for CBDC and interoperability solutions
✅ Investment Advice:
- Novice investors: Consider a higher allocation to QNT for its established market position and lower volatility
- Experienced investors: Balanced approach with both PMG and QNT, adjusting based on risk tolerance and market trends
- Institutional investors: Focus on QNT for its enterprise adoption and potential for integration with traditional financial systems
⚠️ Risk Warning: The cryptocurrency market is highly volatile, and this article does not constitute investment advice. None
VII. FAQ
Q1: What are the main differences between PMG and QNT? A: PMG is a blockchain Web3 game onboarding platform launched in 2023, while QNT is a technology provider enabling trusted digital interaction introduced in 2018. PMG focuses on the gaming sector, while QNT targets enterprise adoption and interoperability solutions.
Q2: Which token has shown better price performance recently? A: QNT has shown more stability, with a more modest decline of 11.27% over the past year, while PMG has experienced a significant decline of 97.02% in the same period.
Q3: How do their supply mechanisms differ? A: PMG has a fixed supply of 1 billion tokens with a deflationary mechanism, while QNT has a fixed total supply of 14.6 million tokens with a burning mechanism tied to platform usage.
Q4: Which token has stronger institutional adoption? A: QNT has stronger institutional backing with partnerships including Oracle, Amazon AWS, and SIA, while PMG shows growing institutional interest but less established relationships.
Q5: What are the long-term price predictions for PMG and QNT? A: By 2030, PMG's base scenario price range is predicted to be $0.003423683429946 - $0.004998577807721, while QNT's base scenario range is $85.2169691324259 - $135.26503036893.
Q6: How should investors allocate their portfolio between PMG and QNT? A: Conservative investors might consider allocating 20% to PMG and 80% to QNT, while aggressive investors might opt for 40% PMG and 60% QNT.
Q7: What are the main risks associated with investing in PMG and QNT? A: PMG faces high volatility and gaming sector dependencies, while QNT is exposed to enterprise adoption rates and competition in interoperability solutions. Both face regulatory risks, with PMG potentially more impacted due to its focus on gaming and NFTs.
Share
Content
Introduction: PMG vs QNT Investment Comparison
I. Price History Comparison and Current Market Status
II. Core Factors Affecting Investment Value of PMG vs QNT
III. Price Predictions for 2025-2030: PMG vs QNT
IV. Investment Strategy Comparison: PMG vs QNT
V. Potential Risk Comparison
VI. Conclusion: Which Is the Better Buy?
VII. FAQ

