MRLN vs QNT: Comparing Two Leading Blockchain Protocols for Enterprise Solutions
Introduction: MRLN vs QNT Investment Comparison
In the cryptocurrency market, the comparison between Project Merlin (MRLN) vs Quant (QNT) has been an unavoidable topic for investors. The two not only show significant differences in market cap ranking, application scenarios, and price performance, but also represent different positioning in the crypto asset space.
Project Merlin (MRLN): Since its launch, it has gained market recognition for its integrated Web3 ecosystem that unites blockchain entrepreneurs, investors, and communities.
Quant (QNT): Recognized since its inception for solving interoperability through the creation of a global blockchain operating system, it's one of the cryptocurrencies with a significant market cap.
This article will comprehensively analyze the investment value comparison between MRLN and QNT, focusing on historical price trends, supply mechanisms, institutional adoption, technological ecosystems, and future predictions, attempting to answer the question investors are most concerned about:
"Which is the better buy right now?"
I. Price History Comparison and Current Market Status
MRLN (Coin A) and QNT (Coin B) Historical Price Trends
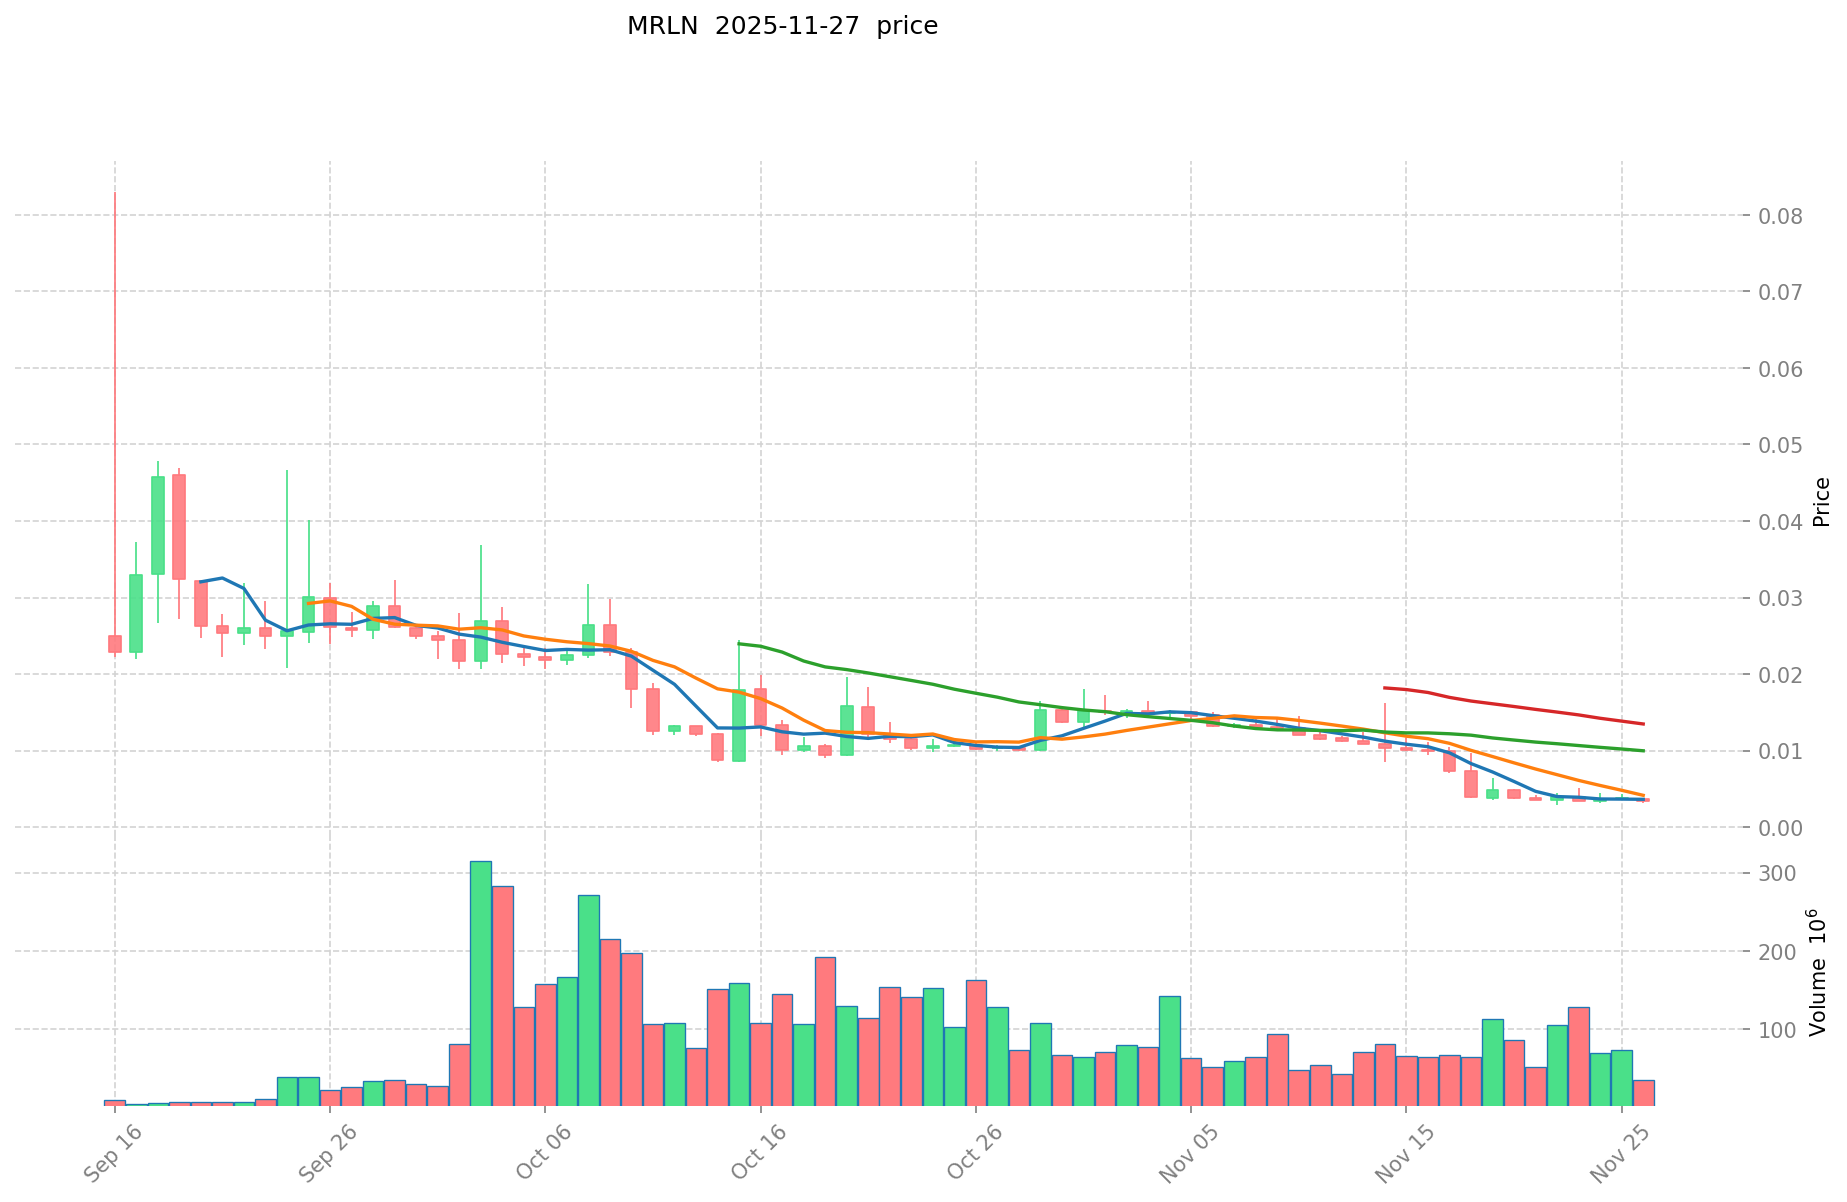
- 2025: MRLN reached its all-time high of $0.08302 on September 16, but has since experienced a significant decline.
- 2021: QNT reached its all-time high of $427.42 on September 11, demonstrating strong performance during the bull market.
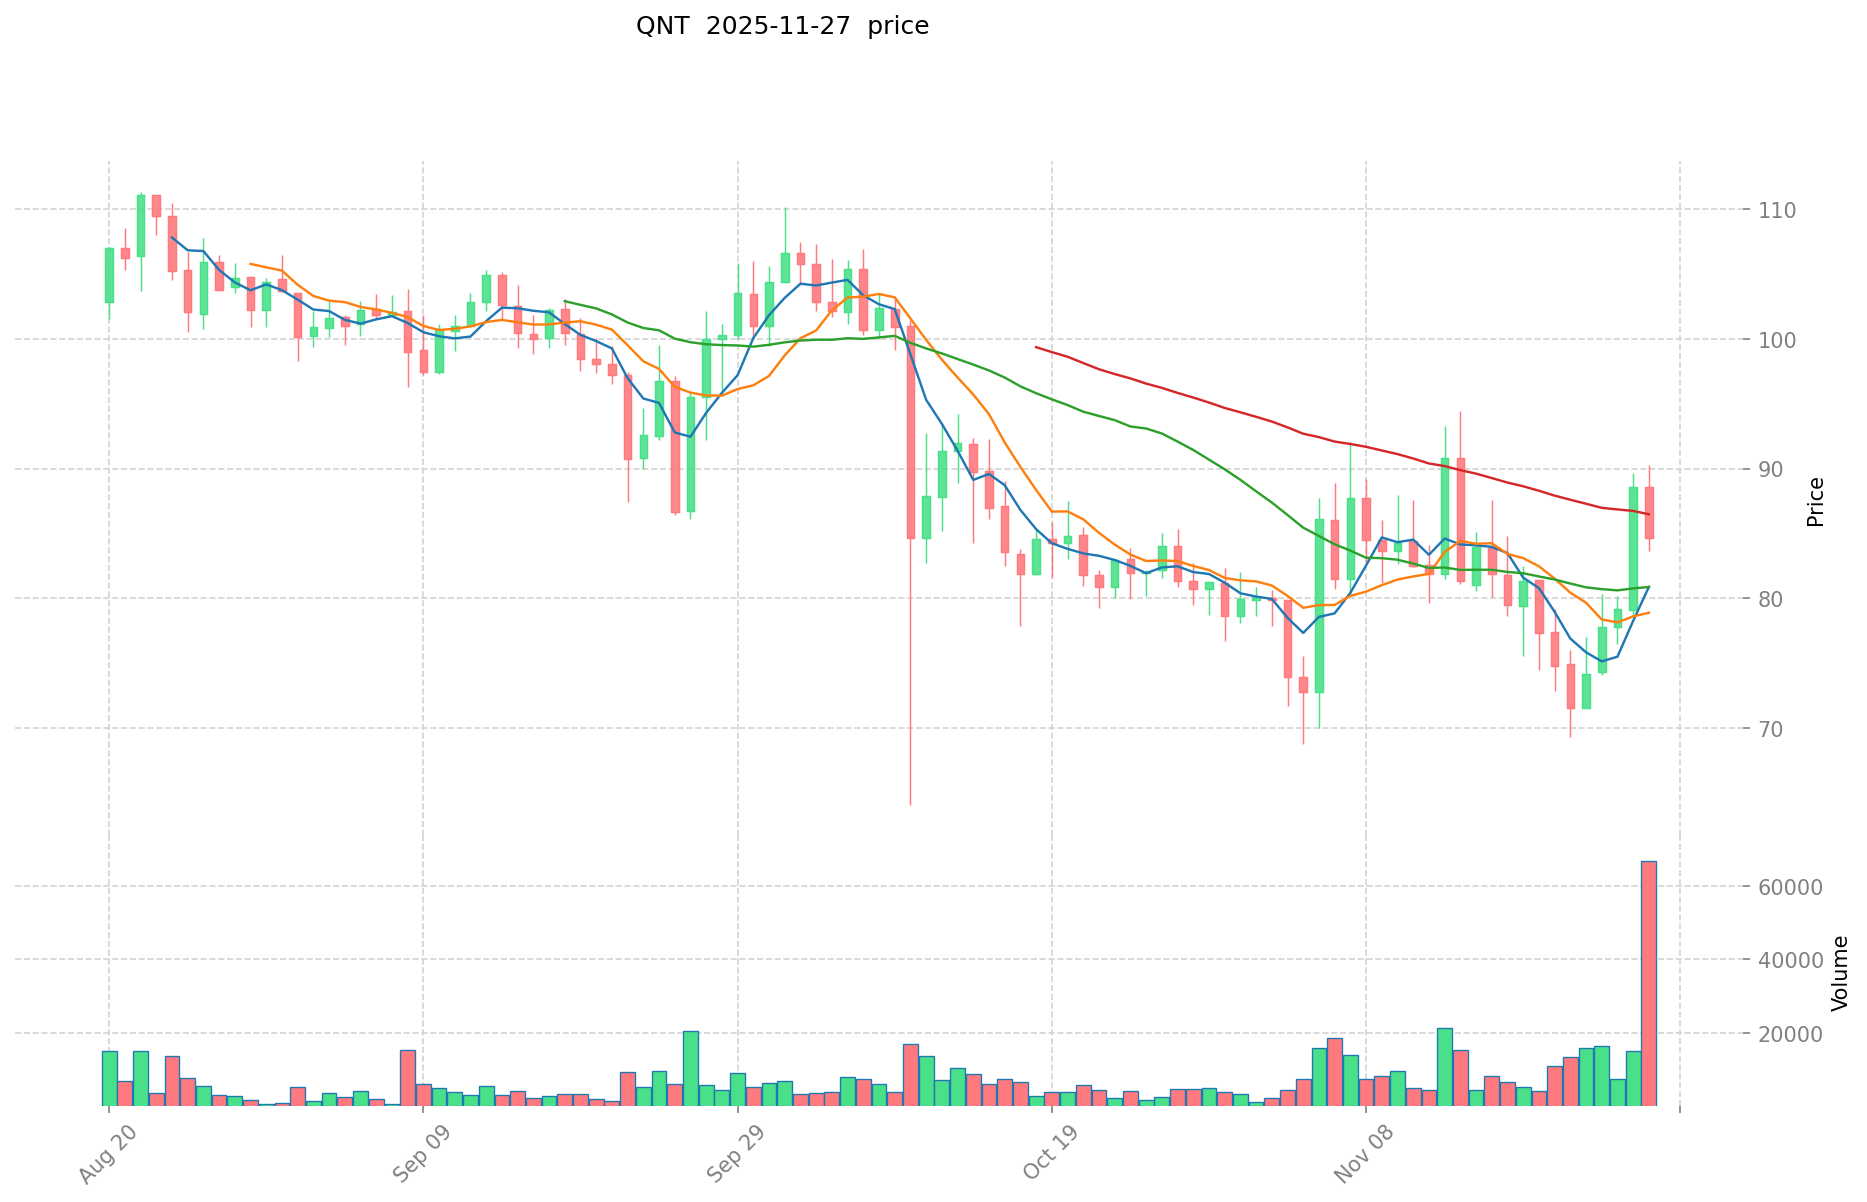
- Comparative analysis: In the recent market cycle, MRLN dropped from its high of $0.08302 to a low of $0.002827, while QNT has shown more resilience, currently trading at $84.21, though still well below its all-time high.
Current Market Situation (2025-11-28)
- MRLN current price: $0.003132
- QNT current price: $84.21
- 24-hour trading volume: MRLN $120,743.14 vs QNT $2,773,270.11
- Market Sentiment Index (Fear & Greed Index): 22 (Extreme Fear)
Click to view real-time prices:
- View MRLN current price Market Price
- View QNT current price Market Price
II. Core Factors Affecting the Investment Value of MRLN vs QNT
Supply Mechanisms Comparison (Tokenomics)
- MRLN: Maximum supply of 10 billion tokens, with 1.15 billion in circulation (11.5% of total supply). Follows an inflationary model with a decreasing emission rate.
- QNT: Fixed supply of 14.6 million tokens. All tokens are in circulation, creating a deflationary model through the token burning mechanism.
- 📌 Historical pattern: Fixed supply tokens like QNT tend to experience higher price appreciation during bull markets due to scarcity, while MRLN's larger supply may result in slower price growth but potentially more stable tokenomics.
Institutional Adoption and Market Applications
- Institutional holdings: QNT has gained more institutional adoption, with partnerships with Oracle, SIA, and integration into enterprise blockchain solutions.
- Enterprise adoption: QNT is positioned as an enterprise-focused solution for interoperability between different blockchains and legacy systems, while MRLN focuses more on DeFi lending and borrowing applications.
- Regulatory attitudes: QNT has focused on regulatory compliance and working with financial institutions, potentially giving it an advantage in regulated environments.
Technical Development and Ecosystem Building
- MRLN technical upgrades: Focuses on expanding lending protocol capabilities across multiple chains, with a multi-chain approach to DeFi lending.
- QNT technical development: Developed Overledger Network for enterprise-grade interoperability between blockchains, with a focus on connecting traditional finance with blockchain networks.
- Ecosystem comparison: QNT has stronger enterprise and CBDC integrations, while MRLN has focused more on cross-chain DeFi lending markets and decentralized collateral management.
Macroeconomic and Market Cycles
- Performance in inflationary environments: QNT's limited supply potentially offers better inflation resistance compared to MRLN's larger supply model.
- Macroeconomic monetary policy: Interest rate changes may impact MRLN's lending-focused ecosystem more directly than QNT's enterprise solutions.
- Geopolitical factors: QNT's focus on enterprise and government solutions may provide stability during market uncertainty, while MRLN's DeFi focus could experience higher volatility during geopolitical tensions. III. 2025-2030 Price Prediction: MRLN vs QNT
Short-term Prediction (2025)
- MRLN: Conservative $0.00257644 - $0.003142 | Optimistic $0.003142 - $0.00468158
- QNT: Conservative $54.691 - $84.14 | Optimistic $84.14 - $89.1884
Mid-term Prediction (2027)
- MRLN may enter a growth phase, with an estimated price range of $0.0036381602895 - $0.004414846194
- QNT may enter a bullish market, with an estimated price range of $82.46965272 - $133.22020824
- Key drivers: Institutional capital inflow, ETF, ecosystem development
Long-term Prediction (2030)
- MRLN: Base scenario $0.005749184402289 - $0.006496578374587 | Optimistic scenario $0.006496578374587+
- QNT: Base scenario $155.25810832294 - $173.8890813216928 | Optimistic scenario $173.8890813216928+
Disclaimer: The above predictions are based on historical data and market analysis. Cryptocurrency markets are highly volatile and subject to rapid changes. These projections should not be considered as financial advice. Always conduct your own research before making investment decisions.
MRLN:
| 年份 | 预测最高价 | 预测平均价格 | 预测最低价 | 涨跌幅 |
|---|---|---|---|---|
| 2025 | 0.00468158 | 0.003142 | 0.00257644 | 0 |
| 2026 | 0.0042638511 | 0.00391179 | 0.0028164888 | 24 |
| 2027 | 0.004414846194 | 0.00408782055 | 0.0036381602895 | 30 |
| 2028 | 0.00624946005684 | 0.004251333372 | 0.00378368670108 | 35 |
| 2029 | 0.006247972090159 | 0.00525039671442 | 0.004935372911554 | 67 |
| 2030 | 0.006496578374587 | 0.005749184402289 | 0.003449510641373 | 83 |
QNT:
| 年份 | 预测最高价 | 预测平均价格 | 预测最低价 | 涨跌幅 |
|---|---|---|---|---|
| 2025 | 89.1884 | 84.14 | 54.691 | 0 |
| 2026 | 124.796448 | 86.6642 | 62.398224 | 2 |
| 2027 | 133.22020824 | 105.730324 | 82.46965272 | 25 |
| 2028 | 150.5388353112 | 119.47526612 | 81.2431809616 | 41 |
| 2029 | 175.50916593028 | 135.0070507156 | 116.106063615416 | 60 |
| 2030 | 173.8890813216928 | 155.25810832294 | 121.1013244918932 | 84 |
IV. Investment Strategy Comparison: MRLN vs QNT
Long-term vs Short-term Investment Strategies
- MRLN: Suitable for investors focused on DeFi lending and cross-chain ecosystem potential
- QNT: Suitable for investors seeking enterprise adoption and interoperability solutions
Risk Management and Asset Allocation
- Conservative investors: MRLN: 30% vs QNT: 70%
- Aggressive investors: MRLN: 60% vs QNT: 40%
- Hedging tools: Stablecoin allocation, options, cross-currency portfolio
V. Potential Risk Comparison
Market Risk
- MRLN: Higher volatility due to smaller market cap and DeFi sector fluctuations
- QNT: Exposure to enterprise adoption cycles and competition in the interoperability space
Technical Risk
- MRLN: Scalability, network stability across multiple chains
- QNT: Centralization concerns, potential security vulnerabilities in the Overledger network
Regulatory Risk
- Global regulatory policies may have different impacts on both, with QNT potentially benefiting from its focus on compliance and enterprise solutions
VI. Conclusion: Which Is the Better Buy?
📌 Investment Value Summary:
- MRLN advantages: Cross-chain DeFi lending potential, growth in decentralized finance ecosystem
- QNT advantages: Strong enterprise adoption, interoperability solutions, fixed supply tokenomics
✅ Investment Advice:
- New investors: Consider a balanced approach with a higher allocation to QNT for its established market position
- Experienced investors: Explore MRLN for higher growth potential while maintaining a position in QNT
- Institutional investors: Focus on QNT for its enterprise-grade solutions and regulatory compliance focus
⚠️ Risk Warning: The cryptocurrency market is highly volatile, and this article does not constitute investment advice. None
VII. FAQ
Q1: What are the main differences between MRLN and QNT? A: MRLN focuses on DeFi lending and cross-chain ecosystems, while QNT specializes in enterprise blockchain interoperability solutions. MRLN has a larger total supply with an inflationary model, whereas QNT has a fixed supply with a deflationary mechanism.
Q2: Which coin has shown better price performance historically? A: QNT has demonstrated stronger historical price performance, reaching an all-time high of $427.42 in September 2021. MRLN's all-time high was $0.08302 in September 2025, but it has since experienced a significant decline.
Q3: How do the supply mechanisms of MRLN and QNT differ? A: MRLN has a maximum supply of 10 billion tokens with 1.15 billion in circulation, following an inflationary model. QNT has a fixed supply of 14.6 million tokens, all of which are in circulation, creating a deflationary model through token burning.
Q4: Which project has gained more institutional adoption? A: QNT has gained more institutional adoption, with partnerships with major companies like Oracle and SIA, and integration into enterprise blockchain solutions. It has also focused on regulatory compliance and working with financial institutions.
Q5: What are the key factors affecting the investment value of MRLN and QNT? A: Key factors include supply mechanisms, institutional adoption, market applications, technical development, ecosystem building, and macroeconomic conditions. QNT's limited supply and enterprise focus may provide advantages in certain market conditions, while MRLN's DeFi focus could offer growth potential in the expanding decentralized finance sector.
Q6: How do the long-term price predictions for MRLN and QNT compare? A: By 2030, MRLN's base scenario predicts a range of $0.005749184402289 - $0.006496578374587, while QNT's base scenario predicts a range of $155.25810832294 - $173.8890813216928. Both have potential for higher prices in optimistic scenarios.
Q7: What are the main risks associated with investing in MRLN and QNT? A: MRLN faces higher volatility due to its smaller market cap and exposure to DeFi sector fluctuations. QNT is exposed to enterprise adoption cycles and competition in the interoperability space. Both face technical risks related to scalability and security, as well as potential regulatory challenges.
Q8: Which coin might be more suitable for different types of investors? A: New investors might consider a balanced approach with a higher allocation to QNT for its established market position. Experienced investors could explore MRLN for higher growth potential while maintaining a position in QNT. Institutional investors may focus on QNT for its enterprise-grade solutions and regulatory compliance focus.
Share
Content

