MOOV vs BAT: The Battle for Dominance in China's Digital Entertainment Market
Introduction: MOOV vs BAT Investment Comparison
In the cryptocurrency market, the comparison between MOOV and BAT has always been an unavoidable topic for investors. The two not only have significant differences in market cap ranking, application scenarios, and price performance, but also represent different positioning in crypto assets.
MOOV (MOOV): Since its launch in 2021, it has gained market recognition as an ERC-20 token circulating on the dotmoovs platform.
BAT (BAT): Introduced in 2017, it has been hailed as a digital asset for circulating between advertisers and users, addressing issues of ad display and user incentives in browsers.
This article will comprehensively analyze the investment value comparison between MOOV and BAT, focusing on historical price trends, supply mechanisms, institutional adoption, technical ecosystems, and future predictions, attempting to answer the question investors care about most:
"Which is the better buy right now?"
I. Price History Comparison and Current Market Status
MOOV and BAT Historical Price Trends
- 2021: BAT reached its all-time high of $1.9 on November 28, 2021, likely due to overall crypto market bullishness.
- 2017: BAT had its all-time low of $0.072394 on July 16, 2017, shortly after its initial launch.
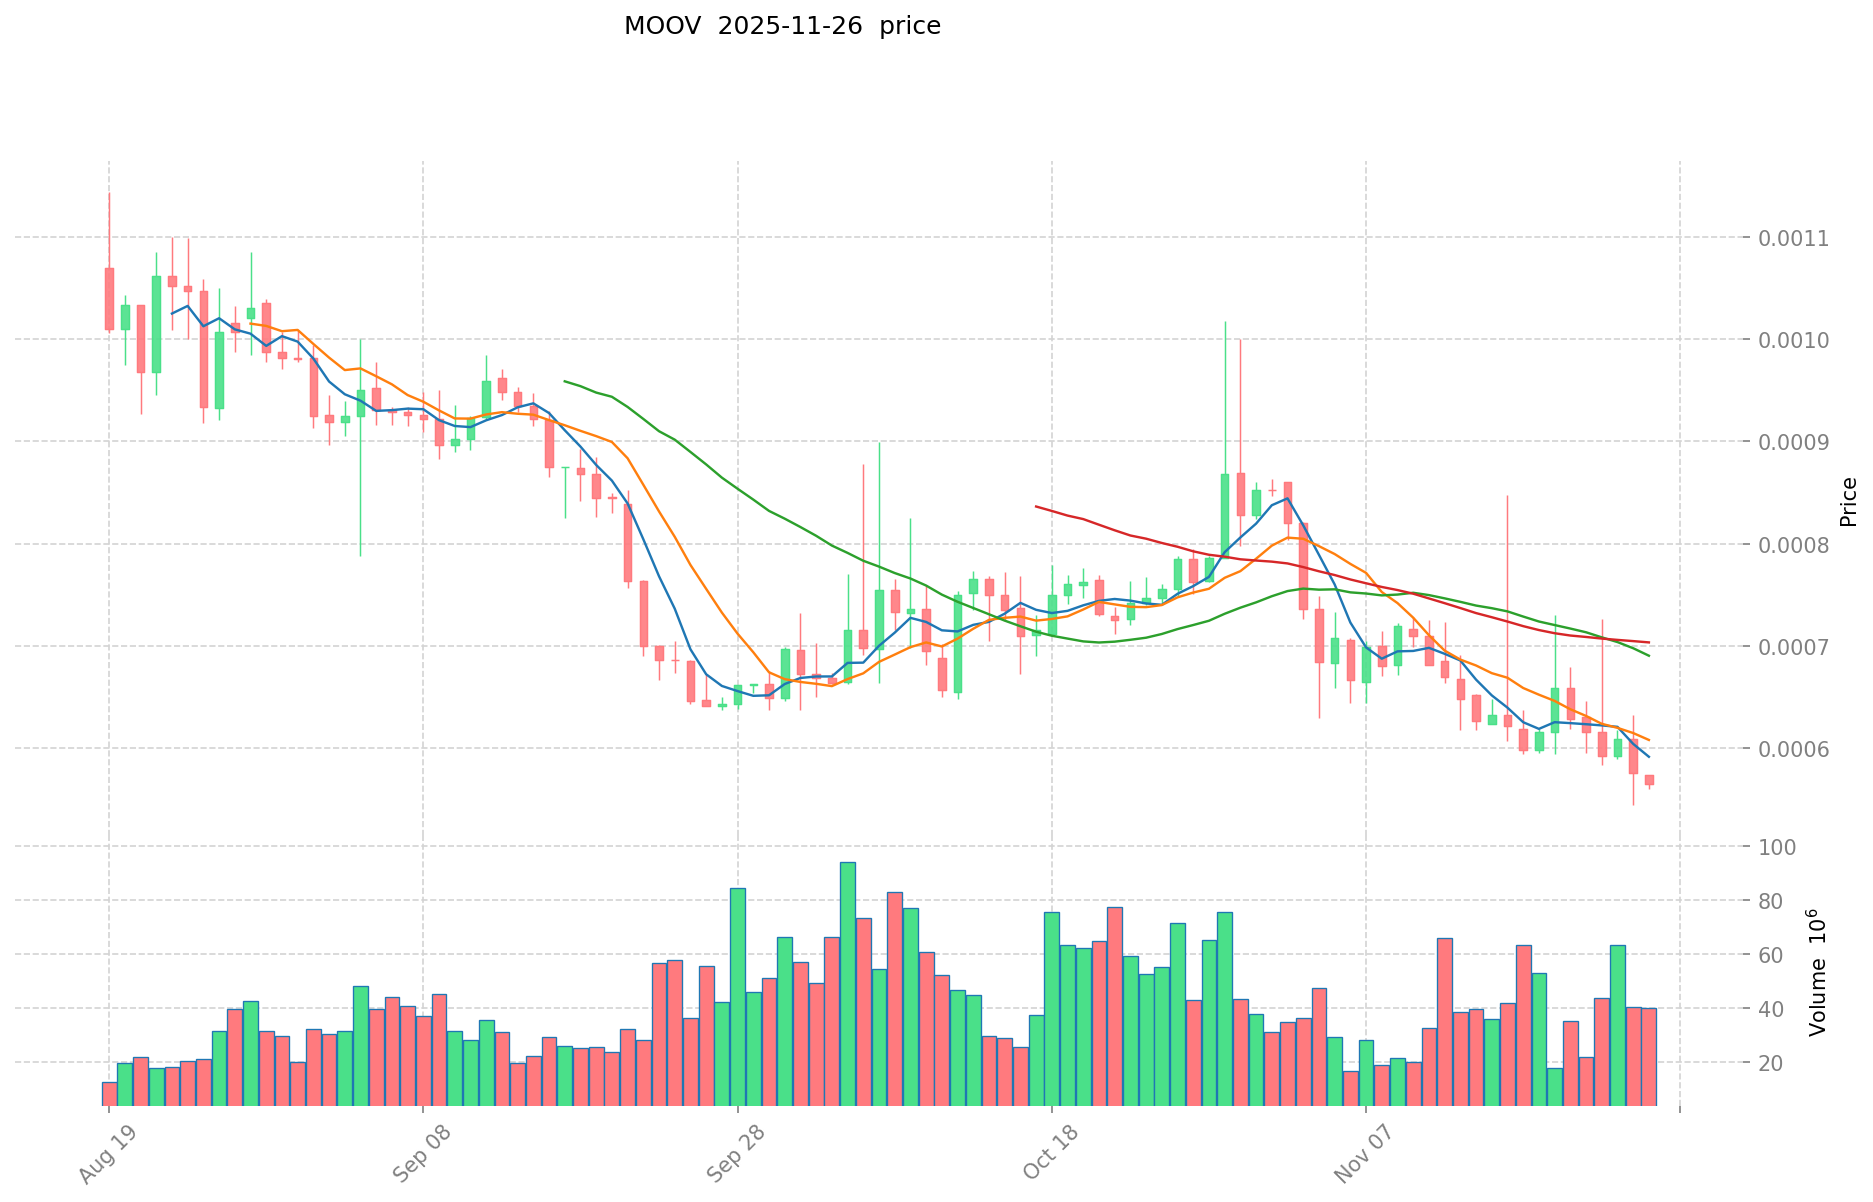
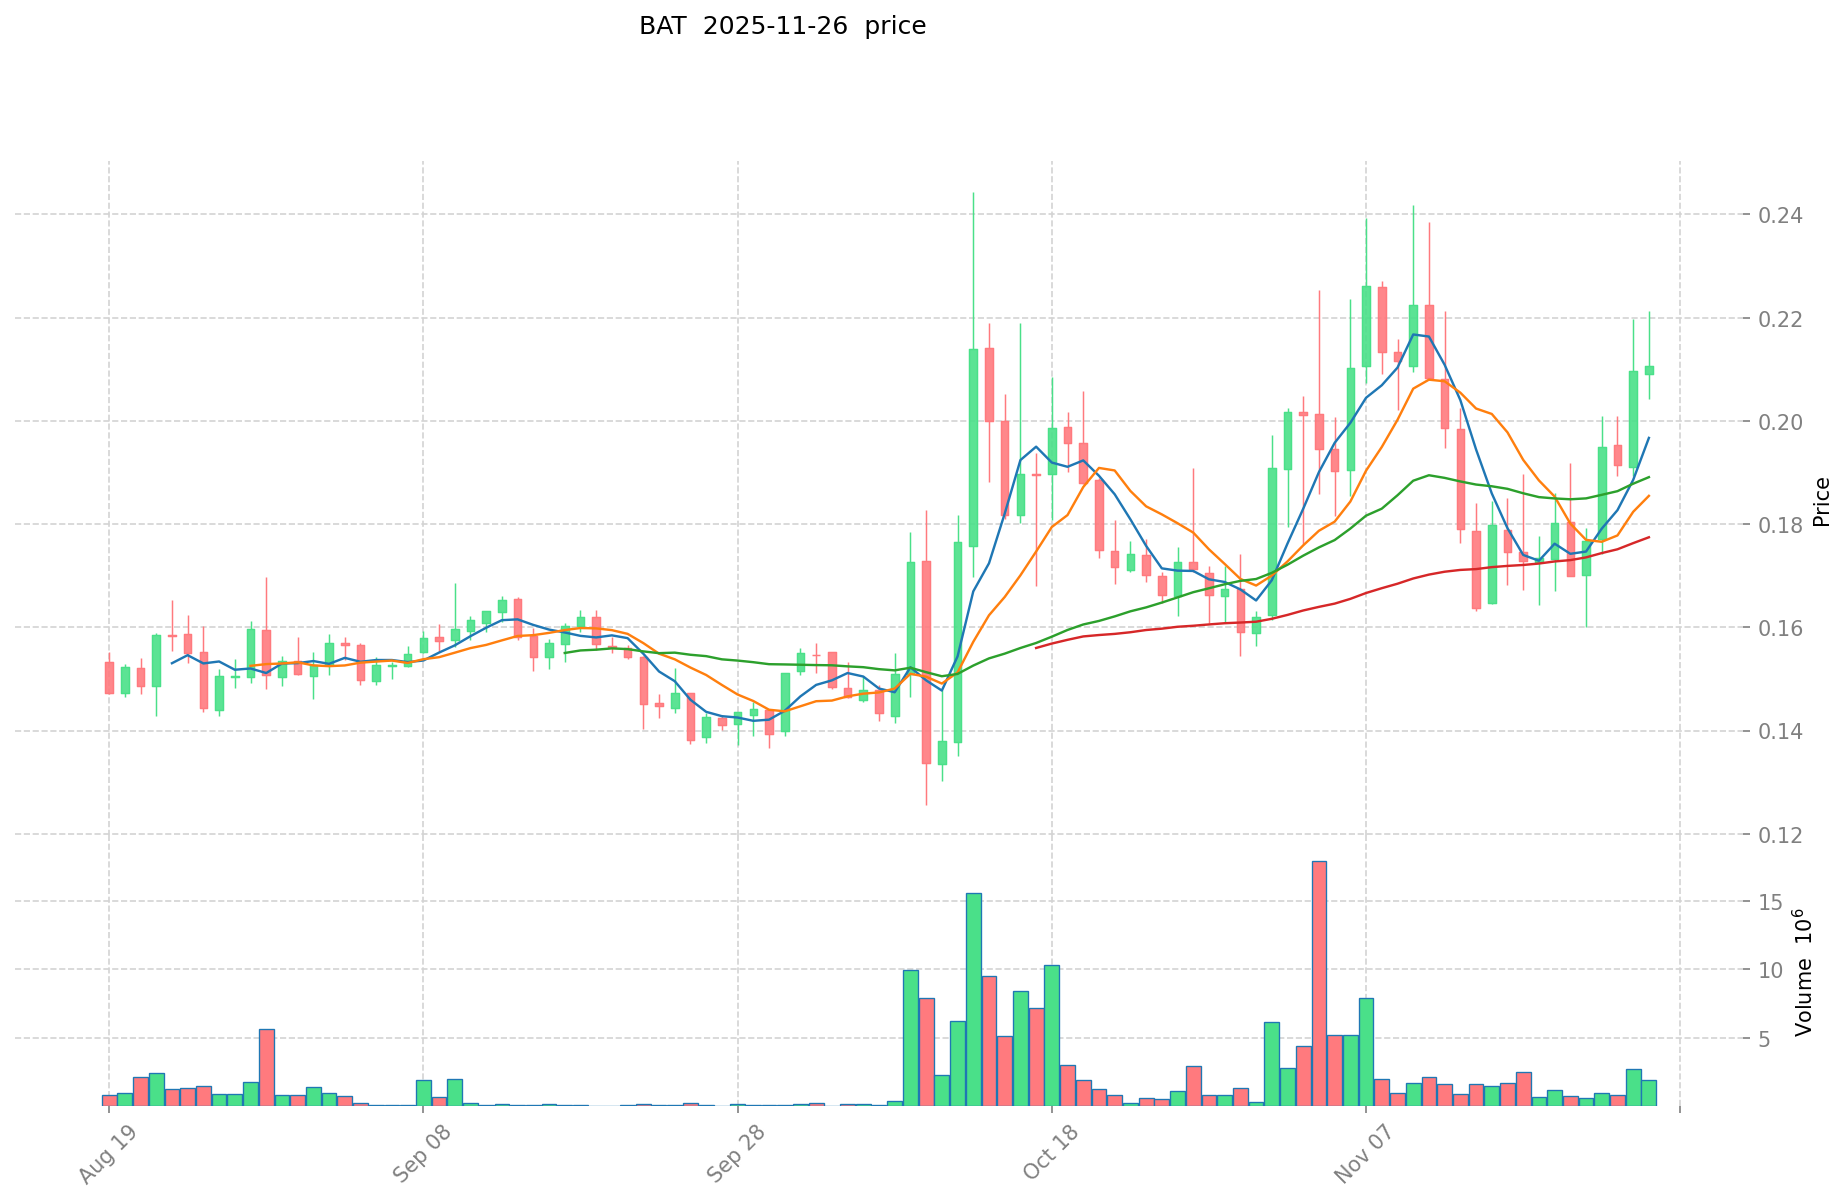
- Comparative analysis: MOOV has experienced a significant decline from its all-time high of $0.096391 on August 30, 2021, to its current price of $0.0005664. BAT, while also down from its peak, has shown more resilience, currently trading at $0.2207.
Current Market Situation (2025-11-27)
- MOOV current price: $0.0005664
- BAT current price: $0.2207
- 24-hour trading volume: MOOV $20,622.52 vs BAT $354,826.74
- Market Sentiment Index (Fear & Greed Index): 20 (Extreme Fear)
Click to view real-time prices:
- View MOOV current price Market Price
- View BAT current price Market Price
II. Core Factors Affecting Investment Value of MOOV vs BAT
Supply Mechanisms Comparison (Tokenomics)
- MOOV: Token launched via LBP (Liquidity Bootstrapping Pool) mechanism with initial circulating supply of 20% of total 1 billion tokens
- BAT: Fixed supply of 1.5 billion tokens, with approximately 1.49 billion already in circulation
- 📌 Historical pattern: Controlled token release with clear vesting schedules tends to provide better price stability during early token growth phases.
Institutional Adoption and Market Applications
- Institutional holdings: BAT has more established institutional support through Brave browser's corporate partnerships
- Enterprise adoption: BAT has wider adoption through Brave browser's advertiser network and creator economy; MOOV is still developing its applications through the Dtravel platform
- Regulatory attitudes: Both tokens face similar regulatory challenges in various jurisdictions, with neither having significant regulatory advantages
Technical Development and Ecosystem Building
- MOOV technical developments: Focus on integrating with Dtravel platform, transitioning from ERC-20 to multi-chain infrastructure
- BAT technical developments: Continuous integration with Brave browser ecosystem, development of self-serve advertising platform
- Ecosystem comparison: BAT has a more mature ecosystem centered around browser-based advertising and rewards; MOOV is building in the travel accommodation sector with limited current applications
Macroeconomic and Market Cycles
- Inflation performance: Neither token has demonstrated strong anti-inflationary properties compared to larger cryptocurrencies
- Macroeconomic monetary policy: Both tokens show high correlation with broader crypto market reactions to interest rate changes
- Geopolitical factors: BAT's browser-based utility provides more consistent cross-border usage regardless of geopolitical tensions
III. 2025-2030 Price Prediction: MOOV vs BAT
Short-term Prediction (2025)
- MOOV: Conservative $0.00038916 - $0.000564 | Optimistic $0.000564 - $0.00077268
- BAT: Conservative $0.149192 - $0.2194 | Optimistic $0.2194 - $0.309354
Mid-term Prediction (2027)
- MOOV may enter a growth phase, with prices estimated between $0.00043375266 - $0.00086015358
- BAT may enter a consolidation phase, with prices estimated between $0.1852225262 - $0.3316080711
- Key drivers: Institutional capital inflow, ETF developments, ecosystem growth
Long-term Prediction (2030)
- MOOV: Base scenario $0.001226487843504 - $0.00172934785934 | Optimistic scenario $0.00172934785934+
- BAT: Base scenario $0.363942808149098 - $0.462207366349355 | Optimistic scenario $0.462207366349355+
Disclaimer: The above predictions are based on historical data and market analysis. Cryptocurrency markets are highly volatile and subject to rapid changes. These projections should not be considered as financial advice. Always conduct your own research before making investment decisions.
MOOV:
| 年份 | 预测最高价 | 预测平均价格 | 预测最低价 | 涨跌幅 |
|---|---|---|---|---|
| 2025 | 0.00077268 | 0.000564 | 0.00038916 | 0 |
| 2026 | 0.000802008 | 0.00066834 | 0.0006416064 | 17 |
| 2027 | 0.00086015358 | 0.000735174 | 0.00043375266 | 29 |
| 2028 | 0.0011805424092 | 0.00079766379 | 0.0004068085329 | 40 |
| 2029 | 0.001463872587408 | 0.0009891030996 | 0.000909974851632 | 74 |
| 2030 | 0.00172934785934 | 0.001226487843504 | 0.001054779545413 | 116 |
BAT:
| 年份 | 预测最高价 | 预测平均价格 | 预测最低价 | 涨跌幅 |
|---|---|---|---|---|
| 2025 | 0.309354 | 0.2194 | 0.149192 | 0 |
| 2026 | 0.33311502 | 0.264377 | 0.17977636 | 19 |
| 2027 | 0.3316080711 | 0.29874601 | 0.1852225262 | 35 |
| 2028 | 0.3813642190655 | 0.31517704055 | 0.220623928385 | 42 |
| 2029 | 0.379614986490447 | 0.34827062980775 | 0.19503155269234 | 57 |
| 2030 | 0.462207366349355 | 0.363942808149098 | 0.338466811578661 | 64 |
IV. Investment Strategy Comparison: MOOV vs BAT
Long-term vs Short-term Investment Strategy
- MOOV: Suitable for investors focusing on emerging platforms and ecosystem potential
- BAT: Suitable for investors seeking established utility and broader market adoption
Risk Management and Asset Allocation
- Conservative investors: MOOV: 10% vs BAT: 90%
- Aggressive investors: MOOV: 30% vs BAT: 70%
- Hedging tools: Stablecoin allocation, options, cross-currency portfolios
V. Potential Risk Comparison
Market Risk
- MOOV: Higher volatility due to lower market cap and trading volume
- BAT: Susceptible to overall crypto market trends and browser adoption rates
Technical Risk
- MOOV: Scalability, network stability during platform growth
- BAT: Dependence on Brave browser adoption, potential security vulnerabilities
Regulatory Risk
- Global regulatory policies may impact both tokens, with BAT potentially facing more scrutiny due to its advertising-based model
VI. Conclusion: Which Is the Better Buy?
📌 Investment Value Summary:
- MOOV advantages: Potential for high growth, emerging platform in travel sector
- BAT advantages: Established ecosystem, wider adoption through Brave browser
✅ Investment Advice:
- New investors: Consider a small allocation to BAT as part of a diversified crypto portfolio
- Experienced investors: Balanced approach with higher allocation to BAT, small speculative position in MOOV
- Institutional investors: Focus on BAT for its more established market presence and ecosystem
⚠️ Risk Warning: Cryptocurrency markets are highly volatile. This article does not constitute investment advice. None
VII. FAQ
Q1: What are the key differences between MOOV and BAT? A: MOOV is an ERC-20 token used on the dotmoovs platform, launched in 2021. BAT, introduced in 2017, is a digital asset for circulation between advertisers and users in the Brave browser ecosystem. BAT has a larger market cap, higher trading volume, and a more established ecosystem compared to MOOV.
Q2: Which token has shown better price performance historically? A: BAT has shown better price performance and resilience. While both tokens are down from their all-time highs, BAT is currently trading at $0.2207, significantly higher than MOOV's $0.0005664. BAT also reached a higher all-time high of $1.9 in November 2021.
Q3: How do the supply mechanisms of MOOV and BAT compare? A: MOOV was launched via a Liquidity Bootstrapping Pool (LBP) mechanism with an initial circulating supply of 20% of its total 1 billion tokens. BAT has a fixed supply of 1.5 billion tokens, with approximately 1.49 billion already in circulation.
Q4: Which token has better institutional adoption? A: BAT has more established institutional support through Brave browser's corporate partnerships and wider adoption through its advertiser network and creator economy. MOOV is still developing its applications through the Dtravel platform.
Q5: What are the long-term price predictions for MOOV and BAT? A: By 2030, MOOV's base scenario price range is predicted to be $0.001226487843504 - $0.00172934785934, with an optimistic scenario above $0.00172934785934. BAT's base scenario price range is predicted to be $0.363942808149098 - $0.462207366349355, with an optimistic scenario above $0.462207366349355.
Q6: How should investors allocate their portfolio between MOOV and BAT? A: Conservative investors might consider allocating 10% to MOOV and 90% to BAT, while aggressive investors might allocate 30% to MOOV and 70% to BAT. The exact allocation should depend on individual risk tolerance and investment goals.
Q7: What are the main risks associated with investing in MOOV and BAT? A: MOOV faces higher volatility due to its lower market cap and trading volume, as well as scalability and network stability risks. BAT is susceptible to overall crypto market trends and browser adoption rates, and may face more regulatory scrutiny due to its advertising-based model. Both tokens are subject to general cryptocurrency market risks and potential regulatory challenges.
Share
Content
Introduction: MOOV vs BAT Investment Comparison
I. Price History Comparison and Current Market Status
II. Core Factors Affecting Investment Value of MOOV vs BAT
III. 2025-2030 Price Prediction: MOOV vs BAT
IV. Investment Strategy Comparison: MOOV vs BAT
V. Potential Risk Comparison
VI. Conclusion: Which Is the Better Buy?
VII. FAQ

