This article offers a comparative analysis between MAPO and GRT focusing on investment strategies and performance in the cryptocurrency market. Readers will gain insights into historical price trends, market strategies, tokenomics, and technical developments. It outlines core investment questions such as institutional adoption and price prediction, assisting investors in decision-making processes. With detailed analysis on investment risks and opportunities presented by both tokens, the article targets investors looking for potential growth in cross-chain interoperability (MAPO) and established data indexing services (GRT).
Introduction: Investment Comparison of MAPO vs GRT
In the cryptocurrency market, the comparison between MAPO vs GRT has been an unavoidable topic for investors. The two not only show significant differences in market cap ranking, application scenarios, and price performance but also represent different positioning in the crypto asset landscape.
Map Protocol (MAPO): Launched in 2021, it has gained market recognition for its role as an interoperable layer for the Bitcoin network.
The Graph (GRT): Since its inception in 2020, it has been hailed as a decentralized protocol for indexing and querying blockchain data, becoming one of the most traded and valuable cryptocurrencies globally.
This article will comprehensively analyze the investment value comparison between MAPO vs GRT, focusing on historical price trends, supply mechanisms, institutional adoption, technological ecosystems, and future predictions, attempting to answer the question most crucial to investors:
"Which is the better buy right now?"
I. Price History Comparison and Current Market Status
MAP Protocol (MAPO) and The Graph (GRT) Historical Price Trends
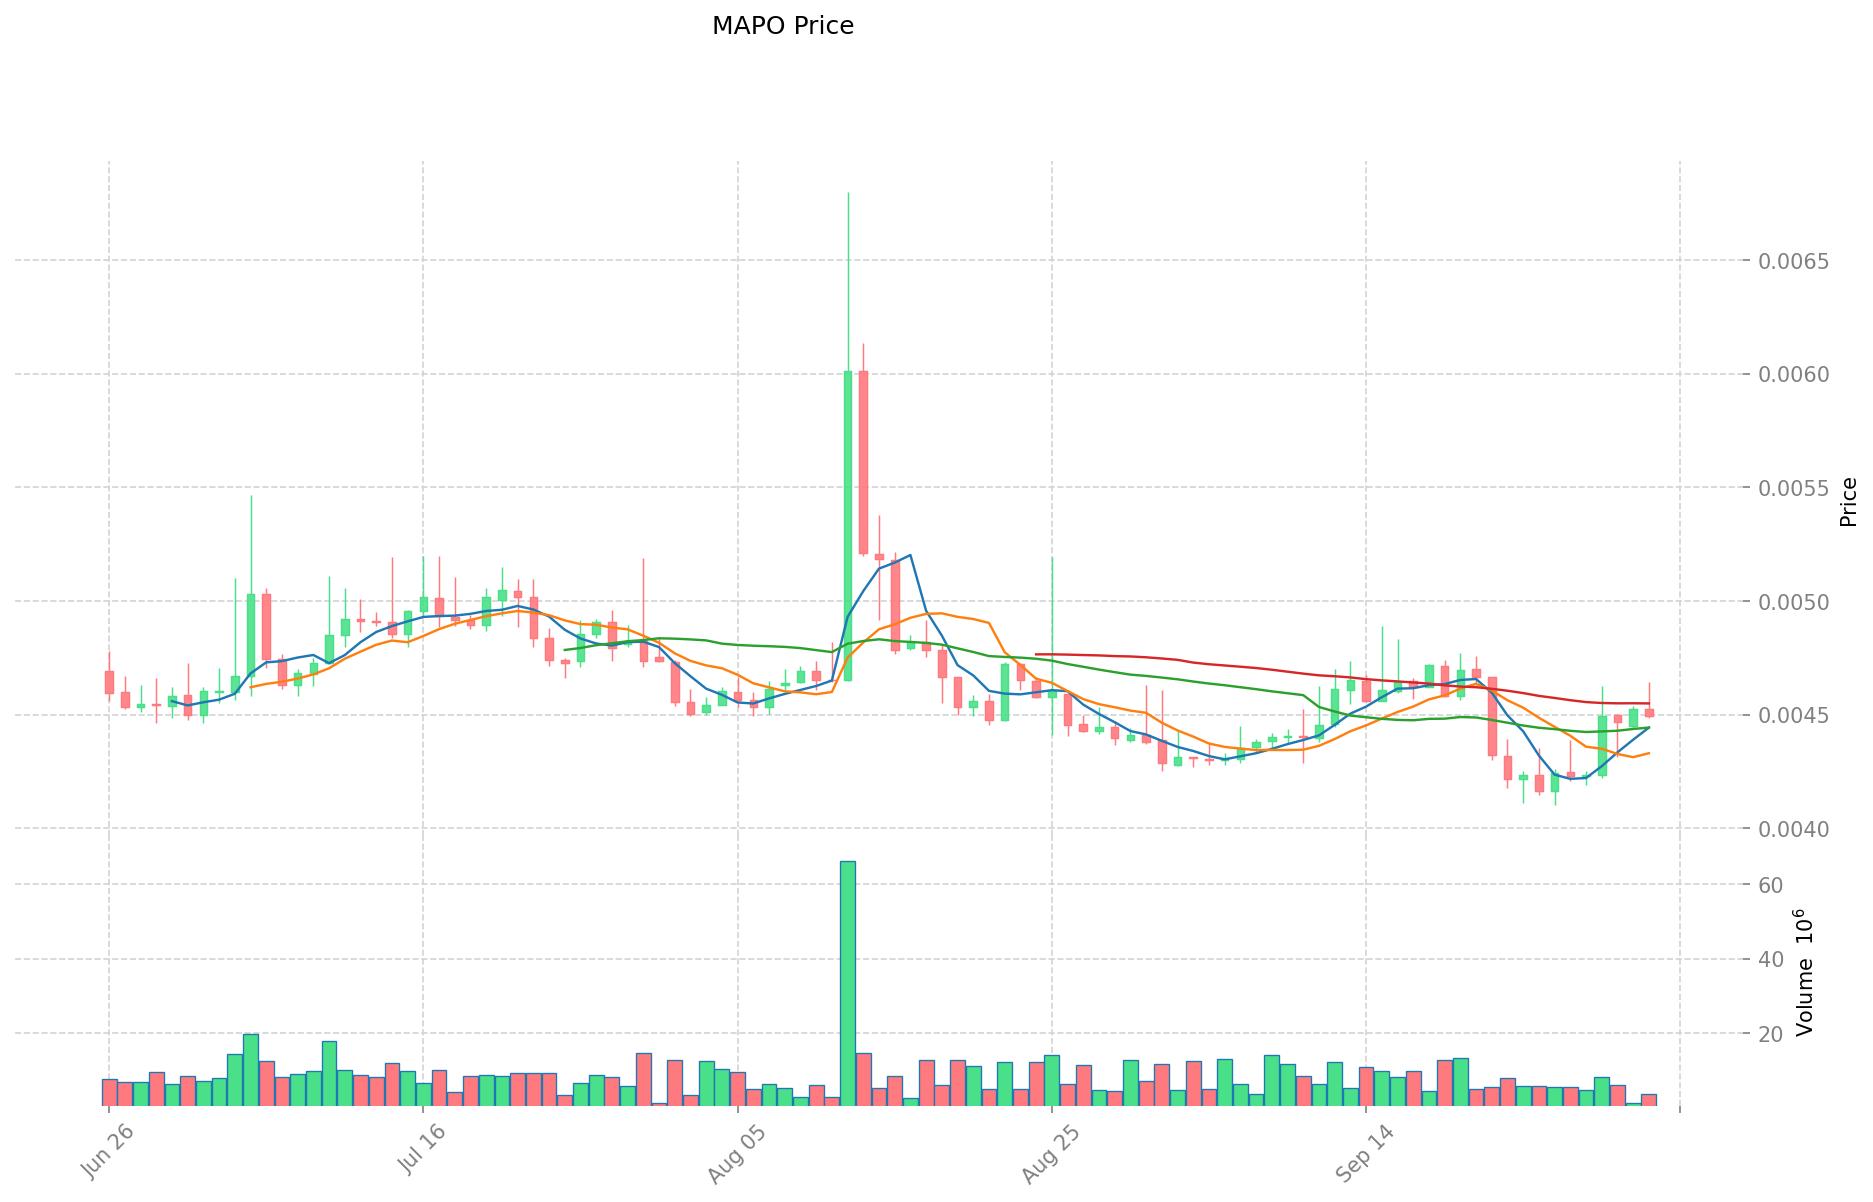
- 2024: MAPO reached its all-time high of $0.045 on March 14, 2024, due to increased adoption of its interoperability solutions.
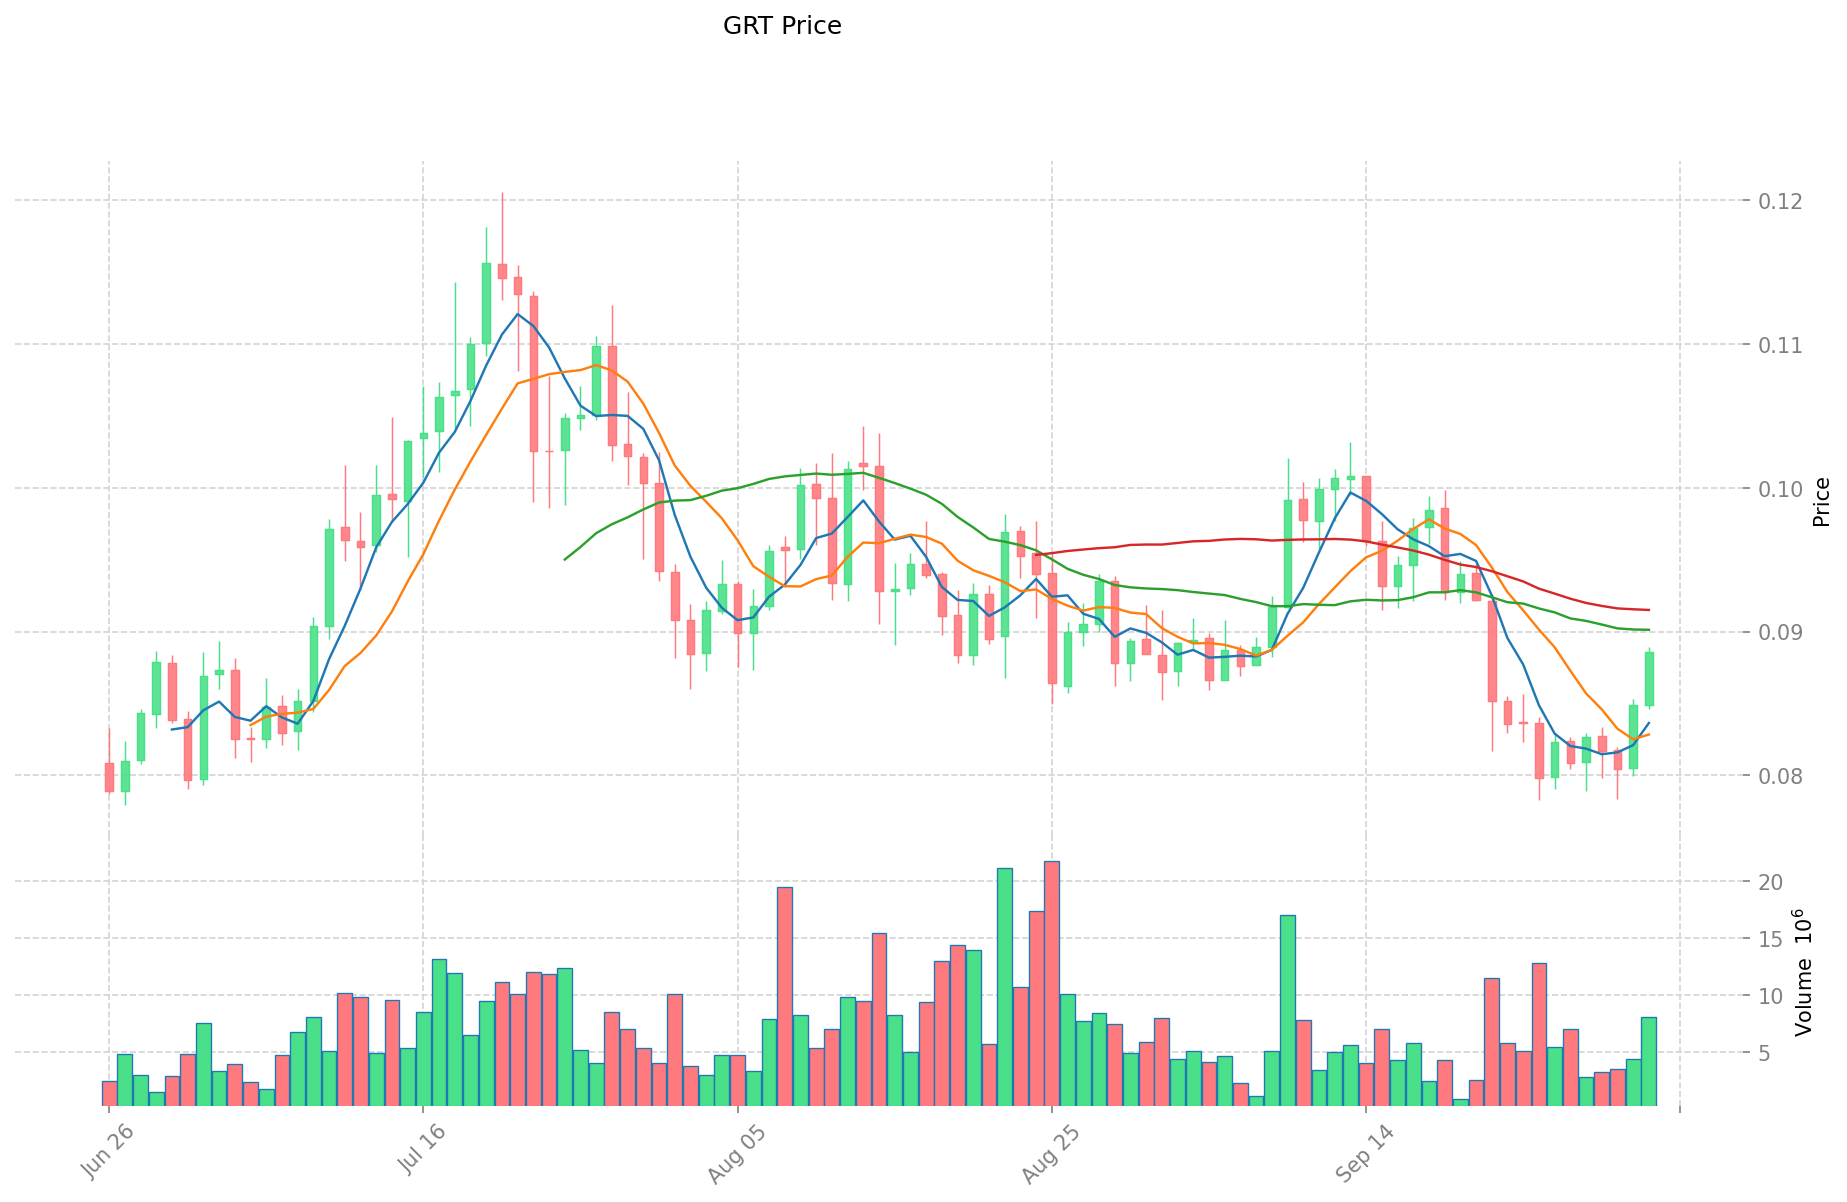
- 2021: GRT hit its all-time high of $2.84 on February 12, 2021, following its mainnet launch and growing demand for blockchain data indexing services.
- Comparative analysis: During the 2024-2025 market cycle, MAPO dropped from its high of $0.045 to a low of $0.003919, while GRT experienced a less severe decline, maintaining a higher market capitalization throughout.
Current Market Situation (2025-10-03)
- MAPO current price: $0.004534
- GRT current price: $0.08631
- 24-hour trading volume: $13,543.40 (MAPO) vs $461,437.14 (GRT)
- Market Sentiment Index (Fear & Greed Index): 64 (Greed)
Click to view real-time prices:
- Check MAPO current price Market Price
- Check GRT current price Market Price
Influence of Core Factors on MAPO vs GRT Investment Value
Supply Mechanism Comparison (Tokenomics)
- MAPO: Focus on trustless and code-based verification processes, eliminating the need for centralized intermediaries
- GRT: Based on decentralized governance and incentivization mechanisms
- 📌 Historical pattern: Both tokens align with core blockchain principles of decentralization and peer-to-peer communication
Institutional Adoption and Market Applications
- Institutional holdings: Information not available in the provided materials
- Enterprise adoption: MAPO specializes in efficient and secure cross-chain transactions, while GRT focuses on decentralized governance
- Regulatory attitudes: Information not available in the provided materials
Technical Development and Ecosystem Building
- MAPO technical upgrades: MAP Protocol's core focuses on meeting the needs for efficient and secure cross-chain transactions
- GRT technical development: Information not available in the provided materials
- Ecosystem comparison: MAPO aligns with blockchain industry's core principles of decentralization and peer-to-peer communications
Macroeconomic Factors and Market Cycles
- Performance in inflationary environments: Information not available in the provided materials
- Macroeconomic monetary policies: Information not available in the provided materials
- Geopolitical factors: Information not available in the provided materials
III. 2025-2030 Price Prediction: MAPO vs GRT
Short-term Forecast (2025)
- MAPO: Conservative $0.00253904 - $0.004534 | Optimistic $0.004534 - $0.0054408
- GRT: Conservative $0.0586976 - $0.08632 | Optimistic $0.08632 - $0.1199848
Mid-term Forecast (2027)
- MAPO may enter a growth phase, with an estimated price range of $0.00437320169 - $0.00806886509
- GRT may enter a consolidation phase, with an estimated price range of $0.06673444518 - $0.1229318727
- Key drivers: Institutional capital inflow, ETF, ecosystem development
Long-term Forecast (2030)
- MAPO: Base scenario $0.00523958365237 - $0.008316799448207 | Optimistic scenario $0.008316799448207 - $0.009148479393028
- GRT: Base scenario $0.075063349566502 - $0.147183038365691 | Optimistic scenario $0.147183038365691 - $0.20016893217734
View detailed price predictions for MAPO and GRT
Disclaimer: The above predictions are based on historical data and market analysis. Cryptocurrency markets are highly volatile and subject to rapid changes. These forecasts should not be considered as financial advice. Always conduct your own research before making investment decisions.
MAPO:
| 年份 |
预测最高价 |
预测平均价格 |
预测最低价 |
涨跌幅 |
| 2025 |
0.0054408 |
0.004534 |
0.00253904 |
0 |
| 2026 |
0.007331478 |
0.0049874 |
0.003291684 |
10 |
| 2027 |
0.00806886509 |
0.006159439 |
0.00437320169 |
35 |
| 2028 |
0.00903497309715 |
0.007114152045 |
0.00647387836095 |
56 |
| 2029 |
0.008559036325339 |
0.008074562571075 |
0.007428597565389 |
78 |
| 2030 |
0.009148479393028 |
0.008316799448207 |
0.00523958365237 |
83 |
GRT:
| 年份 |
预测最高价 |
预测平均价格 |
预测最低价 |
涨跌幅 |
| 2025 |
0.1199848 |
0.08632 |
0.0586976 |
0 |
| 2026 |
0.131003548 |
0.1031524 |
0.06704906 |
19 |
| 2027 |
0.1229318727 |
0.117077974 |
0.06673444518 |
35 |
| 2028 |
0.1644067449895 |
0.12000492335 |
0.0900036925125 |
39 |
| 2029 |
0.152160242561632 |
0.14220583416975 |
0.126563192411077 |
64 |
| 2030 |
0.20016893217734 |
0.147183038365691 |
0.075063349566502 |
70 |
IV. Investment Strategy Comparison: MAPO vs GRT
Long-term vs Short-term Investment Strategies
- MAPO: Suitable for investors focused on interoperability solutions and cross-chain transactions
- GRT: Suitable for investors interested in blockchain data indexing and querying services
Risk Management and Asset Allocation
- Conservative investors: MAPO: 30% vs GRT: 70%
- Aggressive investors: MAPO: 60% vs GRT: 40%
- Hedging tools: Stablecoin allocation, options, cross-currency portfolios
V. Potential Risk Comparison
Market Risks
- MAPO: Higher volatility due to lower market capitalization and trading volume
- GRT: Relatively more stable but still subject to overall crypto market trends
Technical Risks
- MAPO: Scalability, network stability
- GRT: Indexing accuracy, data reliability
Regulatory Risks
- Global regulatory policies may have different impacts on both tokens
VI. Conclusion: Which Is the Better Buy?
📌 Investment Value Summary:
- MAPO advantages: Focus on interoperability, potential for growth in cross-chain transactions
- GRT advantages: Established market position, essential service for blockchain data indexing
✅ Investment Advice:
- New investors: Consider a balanced approach with a slight preference for GRT due to its more established market position
- Experienced investors: Explore opportunities in both, with a higher allocation to MAPO for potential growth
- Institutional investors: Diversify portfolio with both tokens, focusing on their respective strengths in interoperability and data indexing
⚠️ Risk Warning: The cryptocurrency market is highly volatile, and this article does not constitute investment advice.
None
VII. FAQ
Q1: What are the main differences between MAPO and GRT?
A: MAPO focuses on interoperability solutions and cross-chain transactions, while GRT specializes in indexing and querying blockchain data. MAPO is newer and has a lower market cap, while GRT is more established in the market.
Q2: Which token has shown better price performance historically?
A: GRT has shown better price performance historically. It reached its all-time high of $2.84 in February 2021, while MAPO's all-time high was $0.045 in March 2024. GRT has also maintained a higher market capitalization throughout market cycles.
Q3: How do the current prices of MAPO and GRT compare?
A: As of 2025-10-03, MAPO's current price is $0.004534, while GRT's current price is $0.08631. GRT has a significantly higher price and trading volume compared to MAPO.
Q4: What are the short-term price predictions for MAPO and GRT?
A: For 2025, MAPO's conservative estimate ranges from $0.00253904 to $0.004534, with an optimistic range of $0.004534 to $0.0054408. GRT's conservative estimate ranges from $0.0586976 to $0.08632, with an optimistic range of $0.08632 to $0.1199848.
Q5: How do experts recommend allocating investments between MAPO and GRT?
A: For conservative investors, a suggested allocation is 30% MAPO and 70% GRT. For aggressive investors, the recommendation is 60% MAPO and 40% GRT. However, individual investment strategies should be based on personal risk tolerance and market research.
Q6: What are the main risks associated with investing in MAPO and GRT?
A: MAPO faces higher volatility due to its lower market capitalization and trading volume, as well as potential scalability and network stability issues. GRT, while more stable, is still subject to overall crypto market trends and faces risks related to indexing accuracy and data reliability. Both tokens are subject to regulatory risks.
Q7: Which token might be better for new investors?
A: For new investors, GRT might be a slightly better choice due to its more established market position and essential service in blockchain data indexing. However, a balanced approach considering both tokens could also be beneficial, depending on individual investment goals and risk tolerance.
* The information is not intended to be and does not constitute financial advice or any other recommendation of any sort offered or endorsed by Gate.


