KAT vs SOL: Battle of the Blockchain Titans in the DeFi Arena
Introduction: KAT vs SOL Investment Comparison
In the cryptocurrency market, the comparison between Karat Token (KAT) and Solana (SOL) has been an unavoidable topic for investors. The two not only show significant differences in market cap ranking, application scenarios, and price performance, but also represent different positioning in the crypto asset landscape.
Karat Token (KAT): Since its launch, KaratDAO has gained market recognition for its revolutionary crypto native engine in Web3, offering a bilateral service data marketplace.
Solana (SOL): Established in late 2017, it has been hailed as a high-performance blockchain protocol designed to enable scalability without compromising decentralization or security.
This article will provide a comprehensive analysis of the investment value comparison between KAT and SOL, focusing on historical price trends, supply mechanisms, institutional adoption, technological ecosystems, and future predictions, attempting to answer the question investors care about most:
"Which is the better buy right now?"
I. Price History Comparison and Current Market Status
KAT and SOL Historical Price Trends
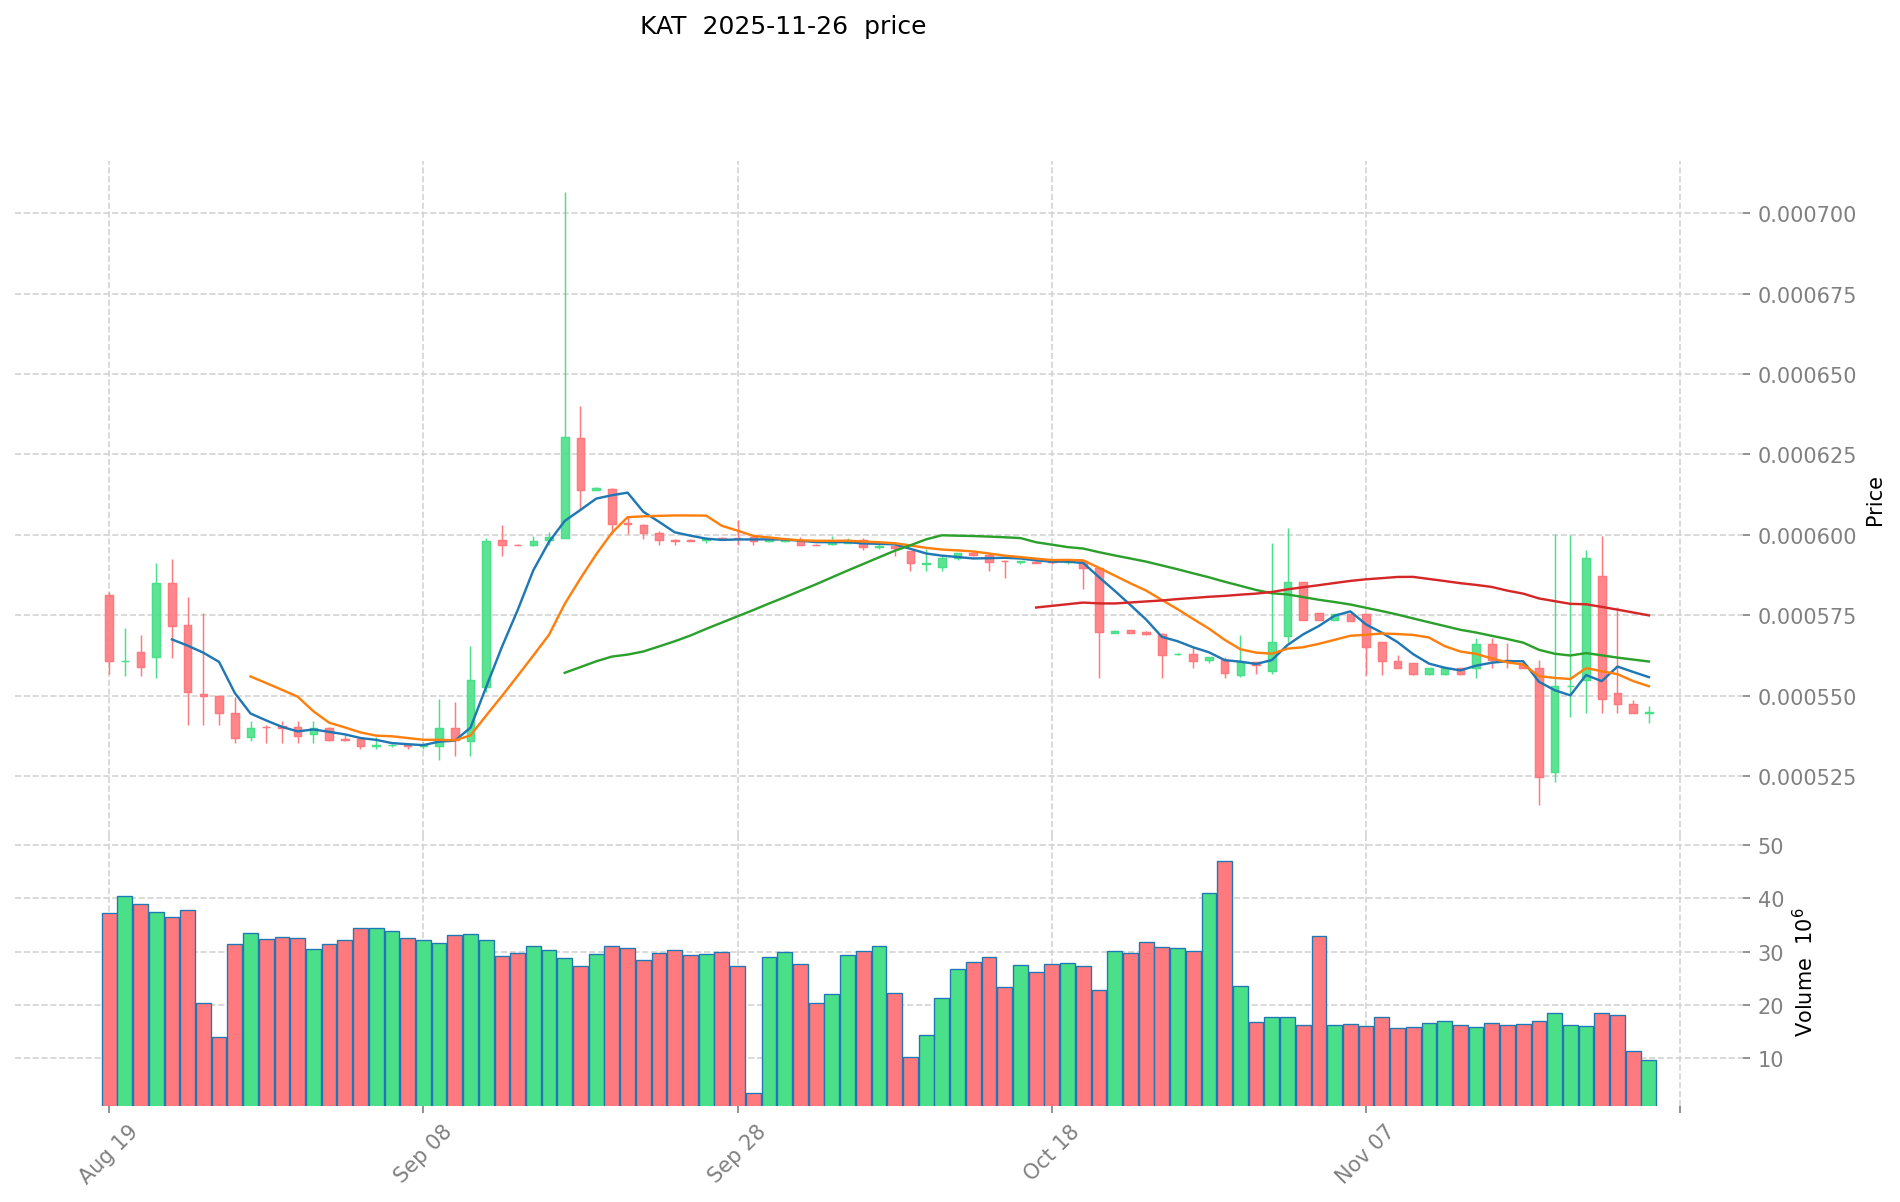
- 2023: KAT reached its all-time high of $0.07131 on August 22, 2023.
- 2024: KAT hit its all-time low of $0.00035 on July 14, 2024.
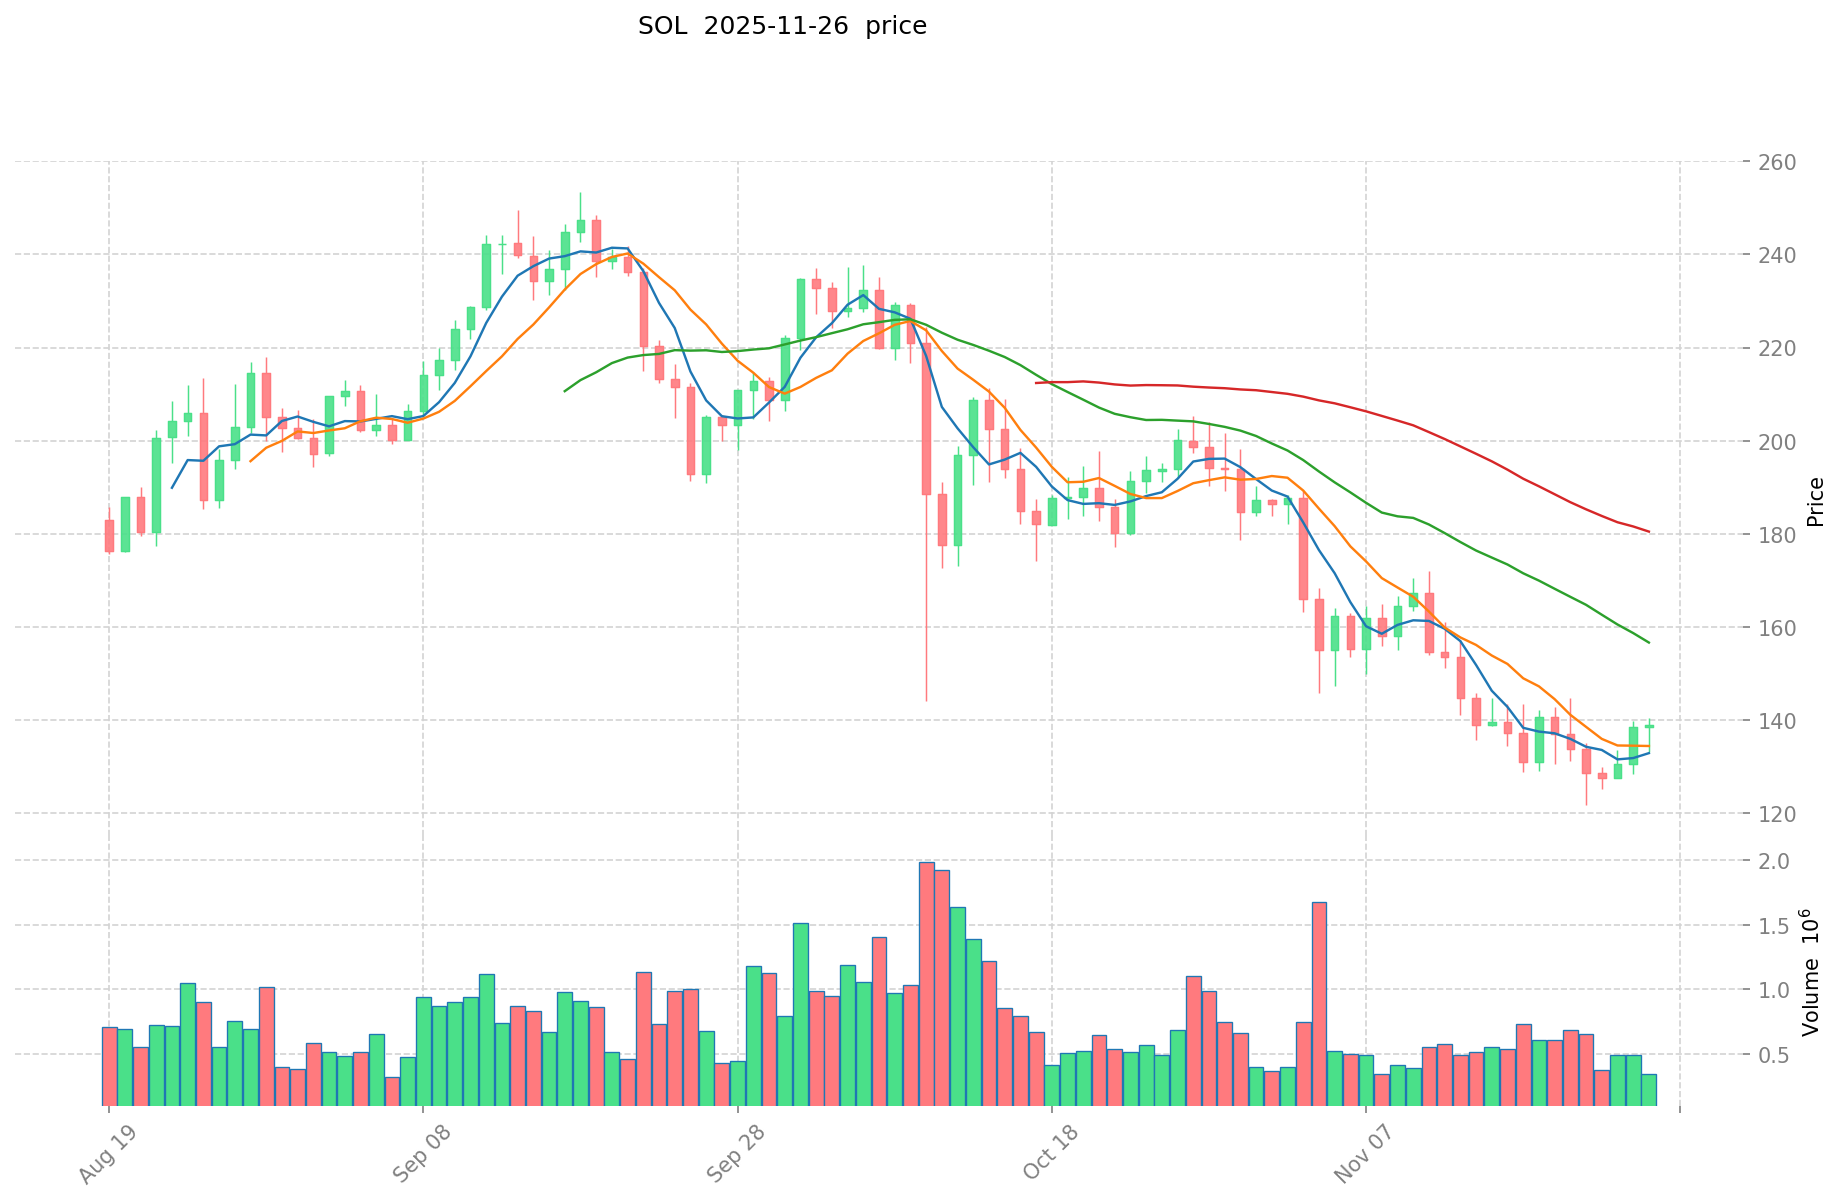
- 2025: SOL reached its all-time high of $293.31 on January 19, 2025.
- Comparative analysis: KAT has experienced a significant price decline from its ATH to its current price, while SOL has shown more stability and reached a new ATH in 2025.
Current Market Situation (2025-11-26)
- KAT current price: $0.0005432
- SOL current price: $136.48
- 24-hour trading volume: KAT $11,830.27 vs SOL $70,820,126.61
- Market Sentiment Index (Fear & Greed Index): 20 (Extreme Fear)
Click to view real-time prices:
- Check KAT current price Market Price
- Check SOL current price Market Price
II. Core Factors Affecting KAT vs SOL Investment Value
Supply Mechanism Comparison (Tokenomics)
- KAT: Limited supply with maximum cap of 2 billion tokens, designed to create scarcity with deflationary pressure
- SOL: Inflationary with annual issuance rate starting at 8% and decreasing by 15% yearly until reaching 1.5%
- 📌 Historical pattern: Deflationary tokens like KAT tend to retain value better during market downturns, while SOL's inflation schedule creates consistent selling pressure
Institutional Adoption and Market Applications
- Institutional holdings: SOL has gained more institutional interest with backing from major funds like Multicoin Capital, Andreessen Horowitz, and Alameda Research
- Enterprise adoption: SOL has wider enterprise integration in payments and settlements due to its established ecosystem, while KAT is newer with fewer enterprise partnerships
- Regulatory attitudes: Both face similar regulatory scrutiny in major jurisdictions, though SOL's longer history provides more regulatory clarity
Technical Development and Ecosystem Building
- KAT technical upgrades: Focus on enhanced security features and hybrid consensus mechanism
- SOL technical development: Continuous improvements to scalability with parallel transaction processing and reduced transaction fees
- Ecosystem comparison: SOL has a more mature ecosystem spanning DeFi, NFTs, and gaming applications with higher total value locked, while KAT's ecosystem is still in early development stages
Macroeconomic and Market Cycles
- Inflation environment performance: SOL has historically shown higher correlation with broader tech market movements, while KAT's limited supply model positions it as potentially more inflation-resistant
- Macroeconomic monetary policy: Both tokens show sensitivity to interest rate changes and dollar strength, with SOL demonstrating higher volatility during policy shifts
- Geopolitical factors: Cross-border transaction demand benefits both networks, though SOL's established liquidity and exchange presence provides advantage during geopolitical uncertainty
III. Price Prediction for 2025-2030: KAT vs SOL
Short-term Prediction (2025)
- KAT: Conservative $0.000499744 - $0.0005432 | Optimistic $0.0005432 - $0.000738752
- SOL: Conservative $131.1456 - $136.61 | Optimistic $136.61 - $165.2981
Mid-term Prediction (2027)
- KAT may enter a growth phase, with an estimated price range of $0.0005623923424 - $0.0007955794112
- SOL may enter a bullish market, with an estimated price range of $161.06797135 - $205.9013242
- Key drivers: Institutional capital inflow, ETF, ecosystem development
Long-term Prediction (2030)
- KAT: Base scenario $0.00102079353978 - $0.001408695084896 | Optimistic scenario $0.001408695084896+
- SOL: Base scenario $227.4943953282 - $318.49215345948 | Optimistic scenario $318.49215345948+
Disclaimer: These predictions are based on historical data and market analysis. Cryptocurrency markets are highly volatile and unpredictable. Always conduct your own research before making investment decisions.
KAT:
| 年份 | 预测最高价 | 预测平均价格 | 预测最低价 | 涨跌幅 |
|---|---|---|---|---|
| 2025 | 0.000738752 | 0.0005432 | 0.000499744 | 0 |
| 2026 | 0.00073071264 | 0.000640976 | 0.00047432224 | 18 |
| 2027 | 0.0007955794112 | 0.00068584432 | 0.0005623923424 | 26 |
| 2028 | 0.000925889832 | 0.0007407118656 | 0.00070367627232 | 36 |
| 2029 | 0.00120828623076 | 0.0008333008488 | 0.000466648475328 | 53 |
| 2030 | 0.001408695084896 | 0.00102079353978 | 0.000959545927393 | 87 |
SOL:
| 年份 | 预测最高价 | 预测平均价格 | 预测最低价 | 涨跌幅 |
|---|---|---|---|---|
| 2025 | 165.2981 | 136.61 | 131.1456 | 0 |
| 2026 | 181.14486 | 150.95405 | 98.1201325 | 10 |
| 2027 | 205.9013242 | 166.049455 | 161.06797135 | 21 |
| 2028 | 204.57292856 | 185.9753896 | 107.865725968 | 36 |
| 2029 | 259.7146315764 | 195.27415908 | 140.5973945376 | 43 |
| 2030 | 318.49215345948 | 227.4943953282 | 168.345852542868 | 66 |
IV. Investment Strategy Comparison: KAT vs SOL
Long-term vs Short-term Investment Strategy
- KAT: Suitable for investors focused on emerging Web3 ecosystems and potential high-risk, high-reward opportunities
- SOL: Suitable for investors seeking established blockchain platforms with proven scalability and ecosystem growth
Risk Management and Asset Allocation
- Conservative investors: KAT: 5% vs SOL: 15%
- Aggressive investors: KAT: 15% vs SOL: 30%
- Hedging tools: Stablecoin allocation, options, cross-currency portfolios
V. Potential Risk Comparison
Market Risk
- KAT: Higher volatility due to lower market cap and trading volume
- SOL: Susceptible to broader crypto market trends and macroeconomic factors
Technical Risk
- KAT: Scalability, network stability, and ecosystem development challenges
- SOL: Network outages, centralization concerns, and potential security vulnerabilities
Regulatory Risk
- Global regulatory policies may impact both, with SOL potentially facing more scrutiny due to its larger market presence
VI. Conclusion: Which Is the Better Buy?
📌 Investment Value Summary:
- KAT advantages: Limited supply, potential for high growth, focus on Web3 service marketplace
- SOL advantages: Established ecosystem, proven scalability, institutional backing
✅ Investment Advice:
- New investors: Consider a small allocation to SOL as part of a diversified crypto portfolio
- Experienced investors: Balanced approach with both KAT and SOL, adjusting based on risk tolerance
- Institutional investors: Focus on SOL for its liquidity and established market presence, with potential small allocation to KAT for diversification
⚠️ Risk Warning: Cryptocurrency markets are highly volatile. This article does not constitute investment advice. None
VII. FAQ
Q1: What are the main differences between KAT and SOL? A: KAT is a newer token with a limited supply cap of 2 billion, focusing on Web3 services. SOL is a more established blockchain platform with an inflationary supply model, known for its scalability and ecosystem development.
Q2: Which token has shown better price performance recently? A: SOL has shown better recent price performance, reaching an all-time high of $293.31 in January 2025, while KAT has experienced a significant price decline from its all-time high in 2023.
Q3: How do the supply mechanisms of KAT and SOL differ? A: KAT has a limited supply with a maximum cap of 2 billion tokens, creating scarcity. SOL has an inflationary model with an annual issuance rate starting at 8% and decreasing yearly until reaching 1.5%.
Q4: Which token has greater institutional adoption? A: SOL has gained more institutional interest with backing from major funds like Multicoin Capital and Andreessen Horowitz, while KAT has fewer enterprise partnerships due to its newer status.
Q5: What are the key risk factors for each token? A: KAT faces higher volatility due to lower market cap and trading volume, as well as ecosystem development challenges. SOL is susceptible to broader crypto market trends and has experienced network outages and centralization concerns.
Q6: How do the long-term price predictions compare for KAT and SOL? A: By 2030, KAT's base scenario price range is estimated at $0.00102079353978 - $0.001408695084896, while SOL's base scenario range is $227.4943953282 - $318.49215345948.
Q7: Which token might be more suitable for different types of investors? A: KAT may be suitable for investors focused on emerging Web3 ecosystems and high-risk, high-reward opportunities. SOL may be more appropriate for those seeking established blockchain platforms with proven scalability and ecosystem growth.
Share
Content
Introduction: KAT vs SOL Investment Comparison
I. Price History Comparison and Current Market Status
II. Core Factors Affecting KAT vs SOL Investment Value
III. Price Prediction for 2025-2030: KAT vs SOL
IV. Investment Strategy Comparison: KAT vs SOL
V. Potential Risk Comparison
VI. Conclusion: Which Is the Better Buy?
VII. FAQ

