INTR vs BAT: Comparing Investment Strategies in the Tech Sector
Introduction: INTR vs BAT Investment Comparison
In the cryptocurrency market, the comparison between Interlay (INTR) vs Basic Attention Token (BAT) has been an unavoidable topic for investors. The two not only differ significantly in market cap ranking, application scenarios, and price performance, but also represent different positioning in the crypto asset space.
Interlay (INTR): Since its launch, it has gained market recognition for its focus on connecting cryptocurrencies like Bitcoin with DeFi platforms such as Polkadot and Ethereum.
Basic Attention Token (BAT): Introduced in 2017, it has been hailed as a solution for digital advertising, aiming to revolutionize the browser-based ad ecosystem.
This article will comprehensively analyze the investment value comparison between INTR and BAT, focusing on historical price trends, supply mechanisms, institutional adoption, technological ecosystems, and future predictions, attempting to answer the question investors care about most:
"Which is the better buy right now?"
I. Price History Comparison and Current Market Status
INTR and BAT Historical Price Trends
- 2022: INTR reached its all-time high of $0.200574 on July 19, 2022.
- 2021: BAT reached its all-time high of $1.9 on November 28, 2021.
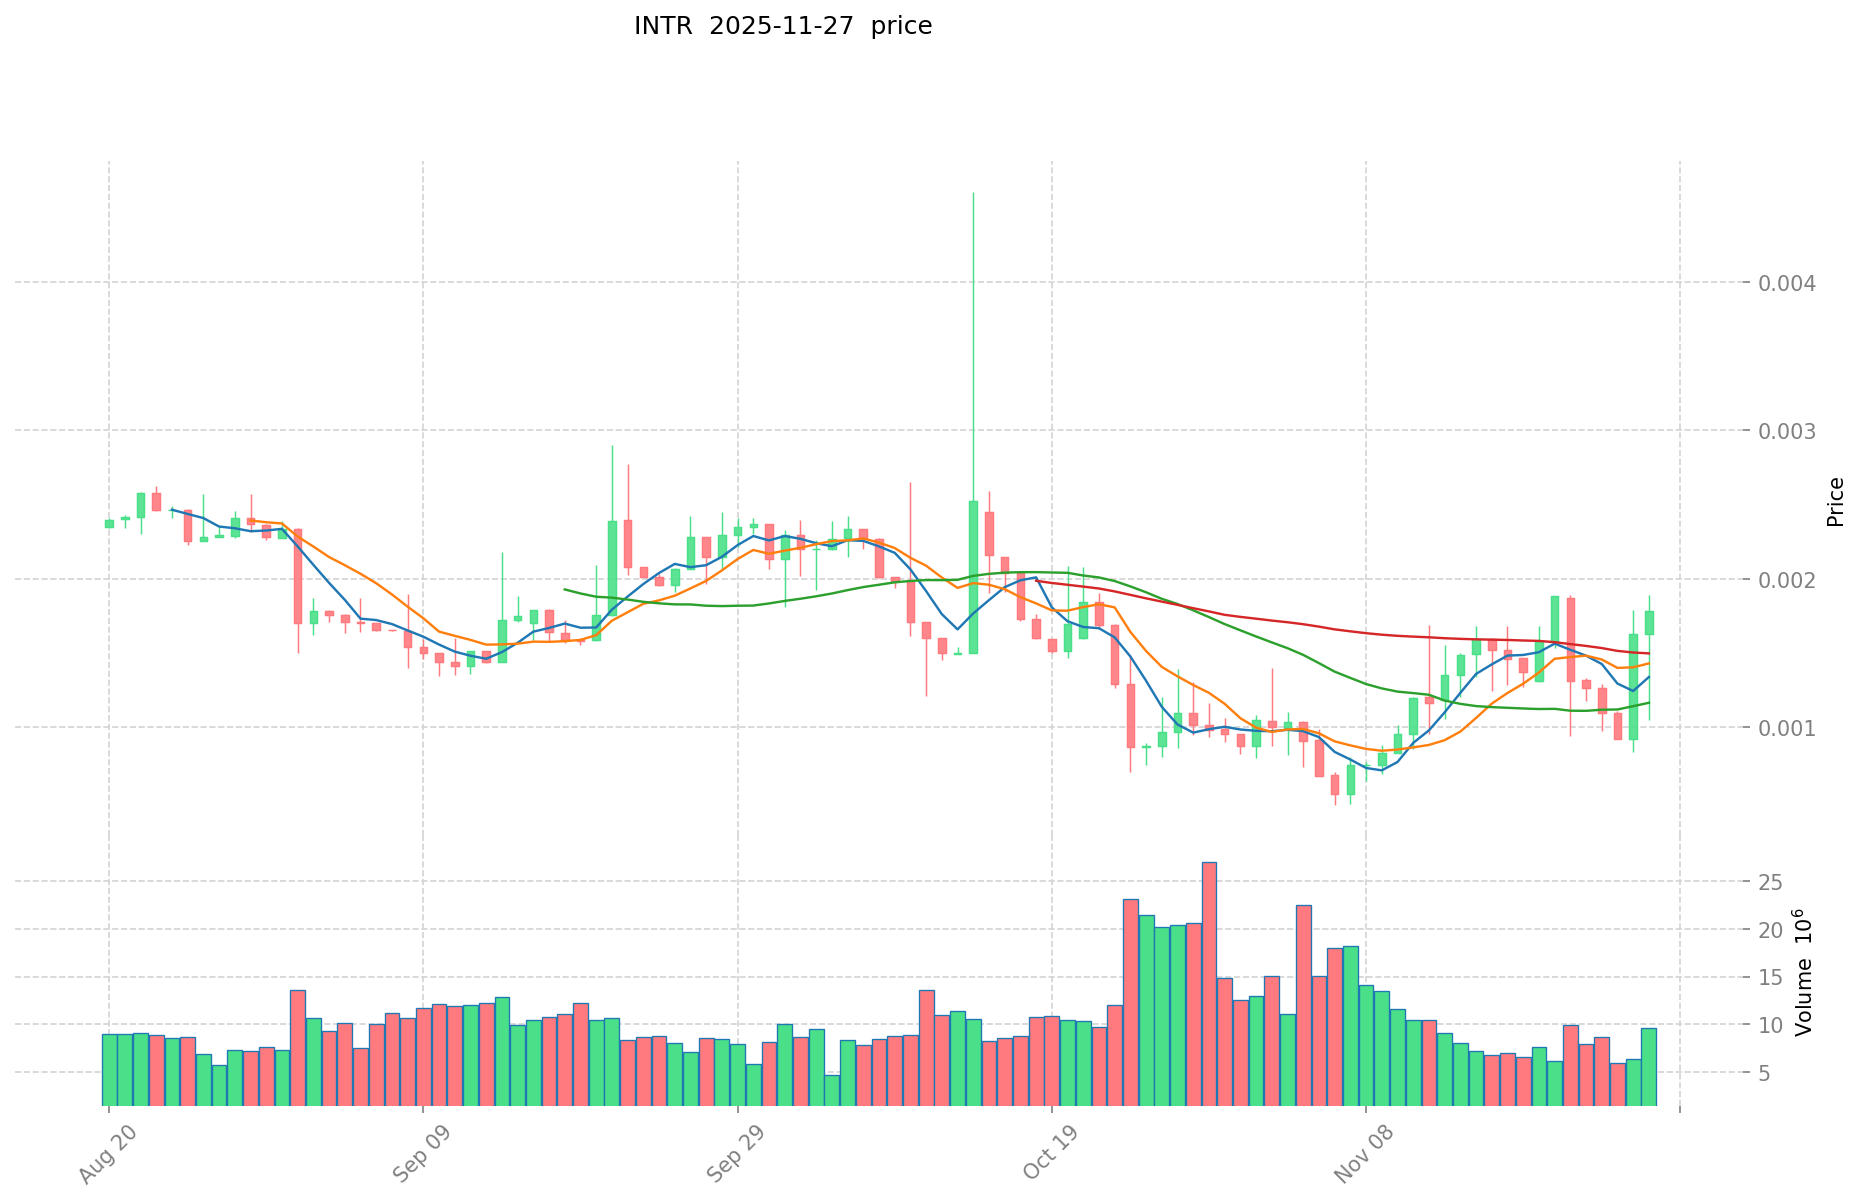
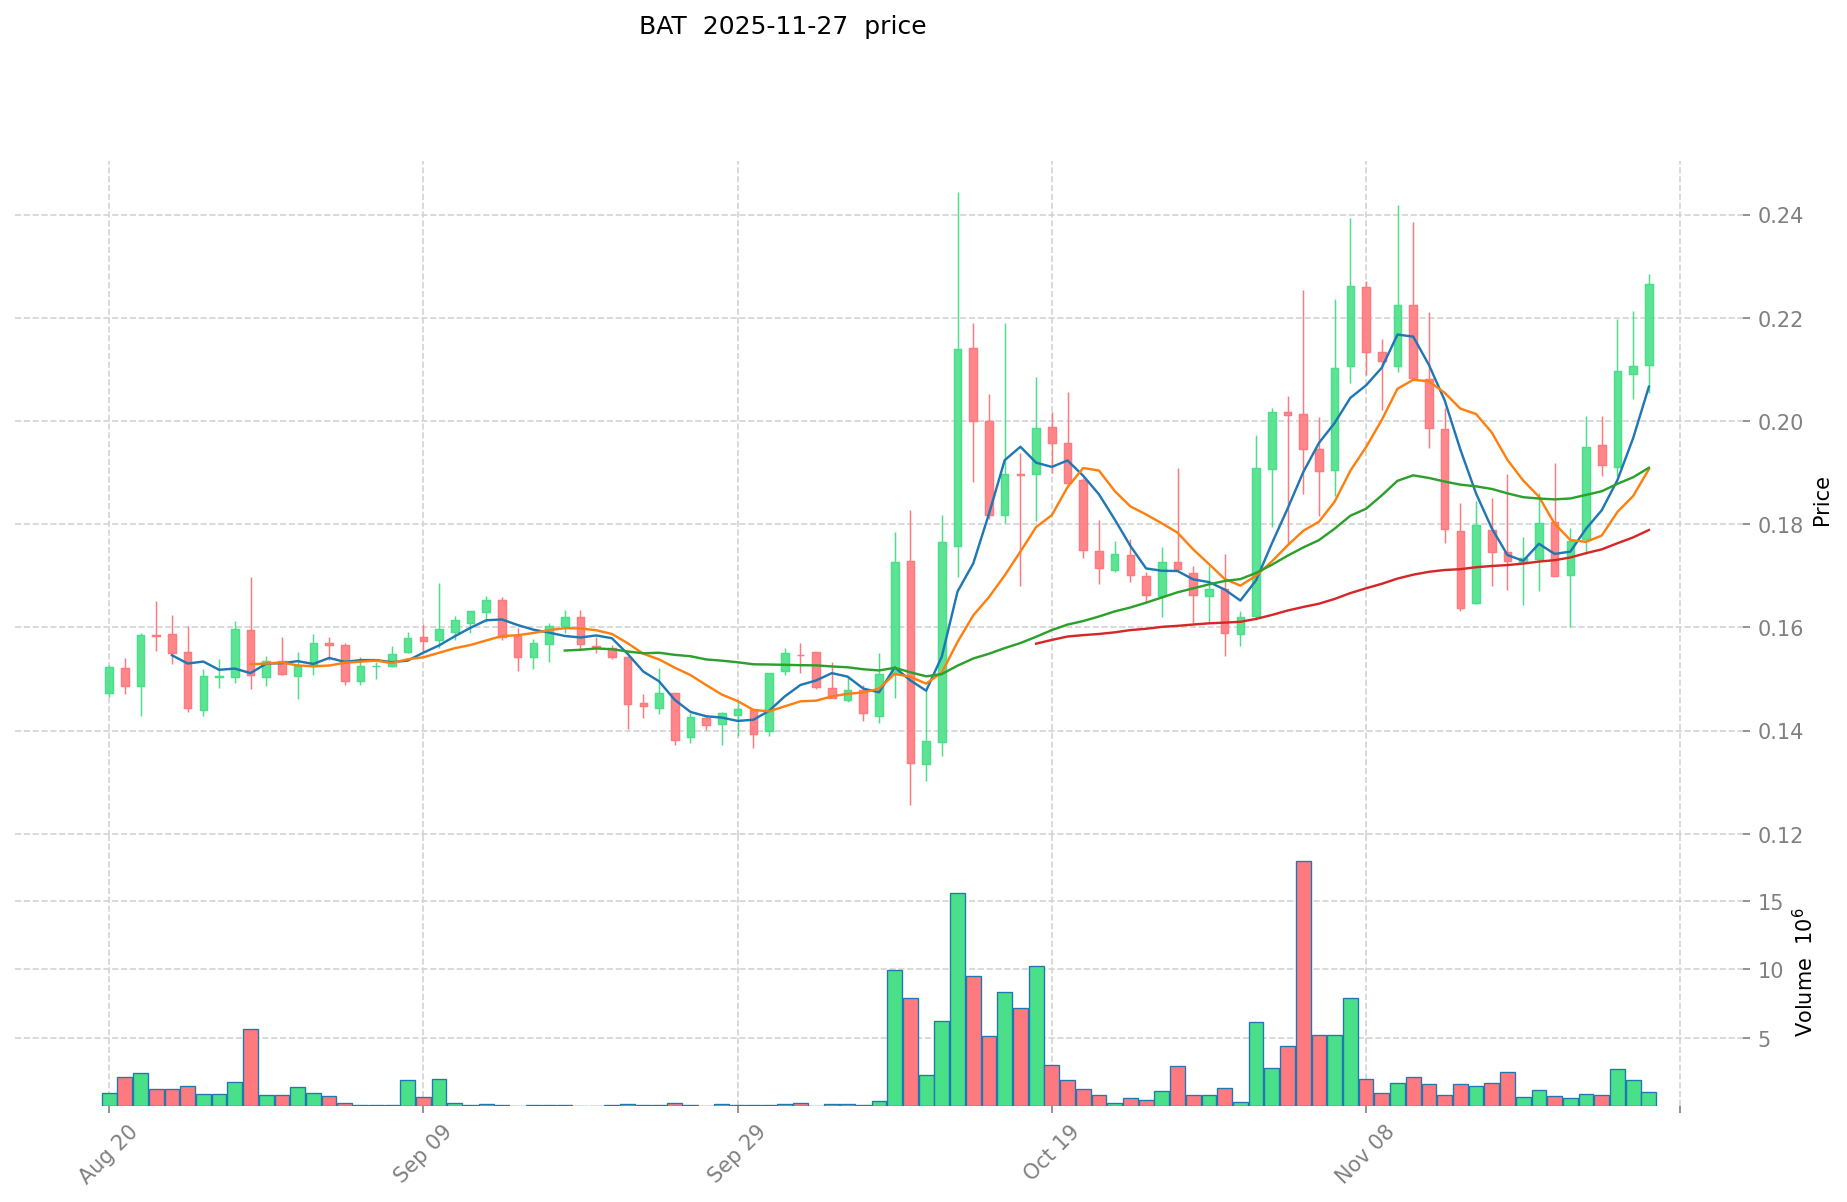
- Comparative analysis: INTR has experienced a significant decline from its all-time high, dropping to a low of $0.00046233 on November 6, 2025. BAT has also seen a decrease from its peak but has maintained a higher price level comparatively.
Current Market Situation (2025-11-27)
- INTR current price: $0.001898
- BAT current price: $0.2216
- 24-hour trading volume: INTR $14,717.99 vs BAT $250,924.78
- Market Sentiment Index (Fear & Greed Index): 22 (Extreme Fear)
Click to view real-time prices:
- Check INTR current price Market Price
- Check BAT current price Market Price
II. Core Factors Affecting Investment Value: INTR vs BAT
Supply Mechanism Comparison (Tokenomics)
- INTR: Fixed supply of 100 million tokens with a deflationary model through token burns
- BAT: Capped supply of 1.5 billion tokens with no new issuance
- 📌 Historical pattern: Fixed supply assets typically demonstrate increasing scarcity value over time, while deflationary mechanisms like INTR's burns can create additional upward price pressure during periods of high network activity.
Institutional Adoption and Market Applications
- Institutional holdings: BAT has greater institutional adoption through the Brave browser ecosystem and advertising partnerships
- Enterprise adoption: INTR offers institutional staking services and treasury management solutions, while BAT is integrated into the Brave browser's advertising system
- Regulatory attitudes: Both tokens face varying regulatory approaches across jurisdictions, with BAT's utility token status providing some regulatory clarity
Technical Development and Ecosystem Building
- INTR technical upgrades: Integration with major blockchains including Ethereum, BNB Chain, and Polygon, enhancing cross-chain functionality
- BAT technical development: Continuous improvements to the Brave browser and BAT ecosystem, focusing on privacy-preserving advertising technology
- Ecosystem comparison: BAT has established stronger real-world adoption through the Brave browser with over 50 million monthly active users, while INTR is building DeFi applications and cross-chain infrastructure
Macroeconomic Factors and Market Cycles
- Inflation environment performance: INTR's deflationary mechanism potentially provides stronger anti-inflationary properties
- Macroeconomic monetary policy: Both tokens show sensitivity to broader crypto market trends, which correlate with global liquidity conditions
- Geopolitical factors: INTR's focus on cross-chain infrastructure positions it well for increasing global blockchain interoperability needs
III. 2025-2030 Price Prediction: INTR vs BAT
Short-term Prediction (2025)
- INTR: Conservative $0.00173788 - $0.001889 | Optimistic $0.001889 - $0.0024557
- BAT: Conservative $0.126312 - $0.2216 | Optimistic $0.2216 - $0.26592
Mid-term Prediction (2027)
- INTR may enter a growth phase, estimated price range $0.00116351066 - $0.00237177173
- BAT may enter a steady growth phase, estimated price range $0.241176144 - $0.320739408
- Key drivers: Institutional fund inflows, ETF, ecosystem development
Long-term Prediction (2030)
- INTR: Base scenario $0.00320847070515 - $0.003785995432077 | Optimistic scenario $0.003785995432077+
- BAT: Base scenario $0.3474750888972 - $0.455192366455332 | Optimistic scenario $0.455192366455332+
Disclaimer: This information is for educational purposes only and should not be considered as financial advice. Cryptocurrency markets are highly volatile and unpredictable. Always conduct your own research before making any investment decisions.
INTR:
| 年份 | 预测最高价 | 预测平均价格 | 预测最低价 | 涨跌幅 |
|---|---|---|---|---|
| 2025 | 0.0024557 | 0.001889 | 0.00173788 | 0 |
| 2026 | 0.002302691 | 0.00217235 | 0.0016727095 | 14 |
| 2027 | 0.00237177173 | 0.0022375205 | 0.00116351066 | 18 |
| 2028 | 0.00320345809985 | 0.002304646115 | 0.0016132522805 | 21 |
| 2029 | 0.003662889302875 | 0.002754052107425 | 0.001679971785529 | 45 |
| 2030 | 0.003785995432077 | 0.00320847070515 | 0.002278014200656 | 69 |
BAT:
| 年份 | 预测最高价 | 预测平均价格 | 预测最低价 | 涨跌幅 |
|---|---|---|---|---|
| 2025 | 0.26592 | 0.2216 | 0.126312 | 0 |
| 2026 | 0.2535104 | 0.24376 | 0.134068 | 9 |
| 2027 | 0.320739408 | 0.2486352 | 0.241176144 | 11 |
| 2028 | 0.39002160648 | 0.284687304 | 0.21920922408 | 27 |
| 2029 | 0.3575957225544 | 0.33735445524 | 0.1922920394868 | 50 |
| 2030 | 0.455192366455332 | 0.3474750888972 | 0.19111129889346 | 55 |
IV. Investment Strategy Comparison: INTR vs BAT
Long-term vs Short-term Investment Strategies
- INTR: Suitable for investors focused on cross-chain infrastructure and DeFi potential
- BAT: Suitable for investors interested in digital advertising and browser-based ecosystems
Risk Management and Asset Allocation
- Conservative investors: INTR: 20% vs BAT: 80%
- Aggressive investors: INTR: 60% vs BAT: 40%
- Hedging tools: Stablecoin allocation, options, cross-currency portfolios
V. Potential Risk Comparison
Market Risks
- INTR: Higher volatility due to lower market cap and trading volume
- BAT: Dependent on Brave browser adoption and digital advertising market trends
Technical Risks
- INTR: Scalability, network stability across multiple chains
- BAT: Browser security, ad-tech implementation challenges
Regulatory Risks
- Global regulatory policies may impact both differently, with BAT potentially facing less scrutiny due to its established utility token status
VI. Conclusion: Which Is the Better Buy?
📌 Investment Value Summary:
- INTR advantages: Cross-chain functionality, deflationary mechanism, potential for high growth
- BAT advantages: Established user base through Brave browser, proven utility in digital advertising
✅ Investment Advice:
- New investors: Consider a higher allocation to BAT for its established ecosystem and lower volatility
- Experienced investors: Balanced approach with exposure to both, leveraging INTR's growth potential
- Institutional investors: Strategic allocation to both, with INTR for cross-chain infrastructure exposure and BAT for digital advertising sector participation
⚠️ Risk Warning: Cryptocurrency markets are highly volatile. This article does not constitute investment advice. None
VII. FAQ
Q1: What are the main differences between INTR and BAT? A: INTR focuses on cross-chain functionality and DeFi applications, while BAT is centered around digital advertising and browser-based ecosystems. INTR has a fixed supply of 100 million tokens with a deflationary model, while BAT has a capped supply of 1.5 billion tokens.
Q2: Which token has shown better price performance historically? A: BAT has shown better historical price performance, reaching an all-time high of $1.9 in November 2021, while INTR's all-time high was $0.200574 in July 2022. As of November 27, 2025, BAT is trading at a higher price of $0.2216 compared to INTR's $0.001898.
Q3: How do the market caps and trading volumes of INTR and BAT compare? A: BAT has a significantly larger market cap and higher trading volume compared to INTR. As of November 27, 2025, BAT's 24-hour trading volume was $250,924.78, while INTR's was $14,717.99.
Q4: What are the key factors affecting the investment value of INTR and BAT? A: Key factors include supply mechanisms, institutional adoption, technical development, ecosystem building, macroeconomic factors, and market cycles. BAT benefits from its established Brave browser ecosystem, while INTR offers potential in cross-chain infrastructure and DeFi applications.
Q5: How do the long-term price predictions for INTR and BAT compare? A: By 2030, INTR's base scenario price range is predicted to be $0.00320847070515 - $0.003785995432077, while BAT's is $0.3474750888972 - $0.455192366455332. Both tokens show potential for growth, with BAT maintaining a higher absolute price.
Q6: What are the main risks associated with investing in INTR and BAT? A: INTR faces higher volatility due to its lower market cap and trading volume, as well as technical risks related to cross-chain functionality. BAT's risks include dependence on Brave browser adoption and potential challenges in the digital advertising market. Both tokens are subject to regulatory risks, though BAT may face less scrutiny due to its established utility token status.
Q7: How should investors allocate their portfolio between INTR and BAT? A: Conservative investors might consider allocating 20% to INTR and 80% to BAT, while aggressive investors could opt for 60% INTR and 40% BAT. New investors may prefer a higher allocation to BAT for its established ecosystem, while experienced investors might take a balanced approach to leverage both tokens' potential.
Share
Content
Introduction: INTR vs BAT Investment Comparison
I. Price History Comparison and Current Market Status
II. Core Factors Affecting Investment Value: INTR vs BAT
III. 2025-2030 Price Prediction: INTR vs BAT
IV. Investment Strategy Comparison: INTR vs BAT
V. Potential Risk Comparison
VI. Conclusion: Which Is the Better Buy?
VII. FAQ

