INK vs TRX: Comparing Two Blockchain Platforms for Digital Content Creation and Distribution
Introduction: INK vs TRX Investment Comparison
In the cryptocurrency market, the comparison between INK and TRX has always been a topic that investors can't avoid. The two not only have significant differences in market cap ranking, application scenarios, and price performance, but also represent different cryptocurrency positioning.
INK (INK): Since its launch in 2017, it has gained market recognition for its focus on the original content industry and decentralized solutions for different cultural circles.
TRON (TRX): Introduced in 2017, it has been hailed as a decentralized platform for content entertainment, and has become one of the largest public blockchains collaborating with sovereign nations on blockchain infrastructure development.
This article will provide a comprehensive analysis of the investment value comparison between INK and TRX, focusing on historical price trends, supply mechanisms, institutional adoption, technological ecosystems, and future predictions, attempting to answer the question investors are most concerned about:
"Which is the better buy right now?"
I. Price History Comparison and Current Market Status
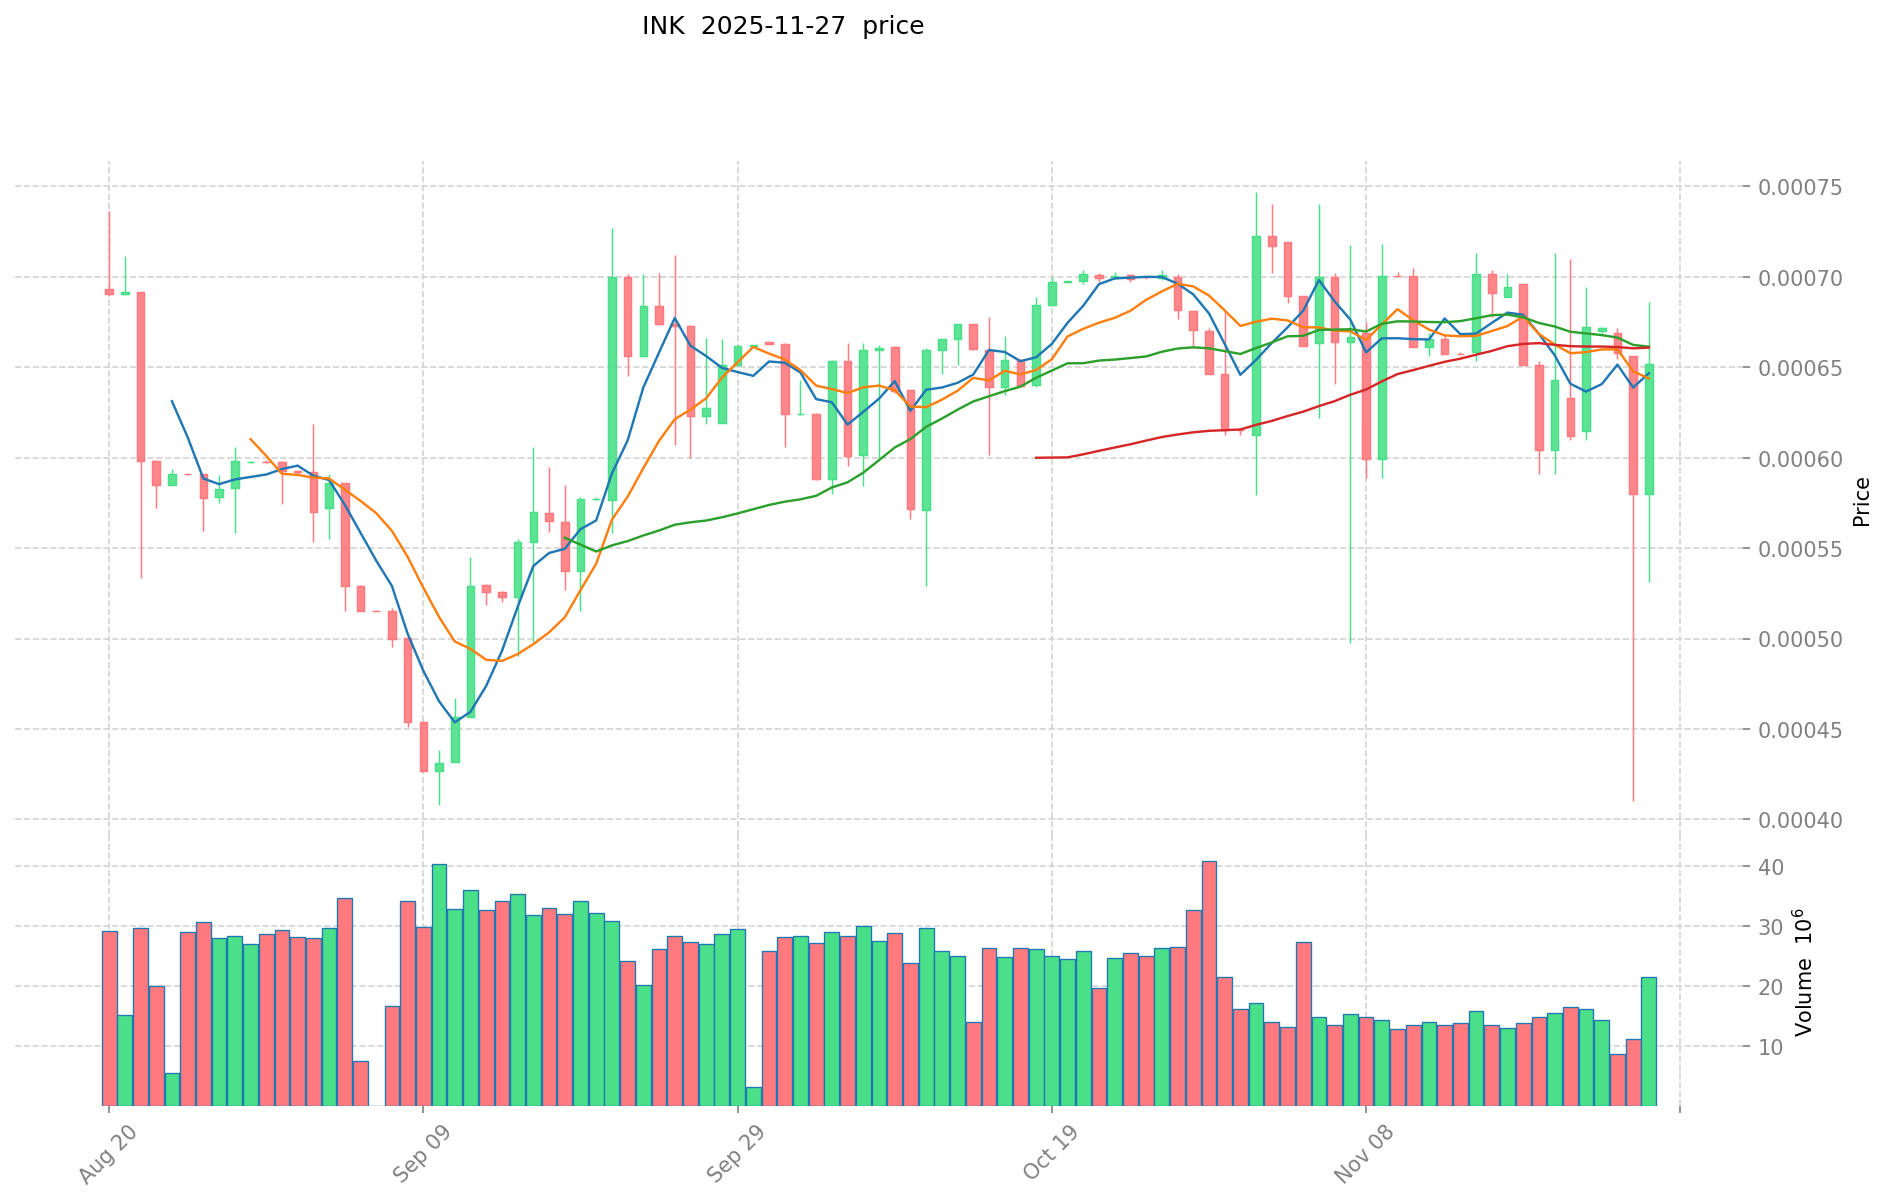
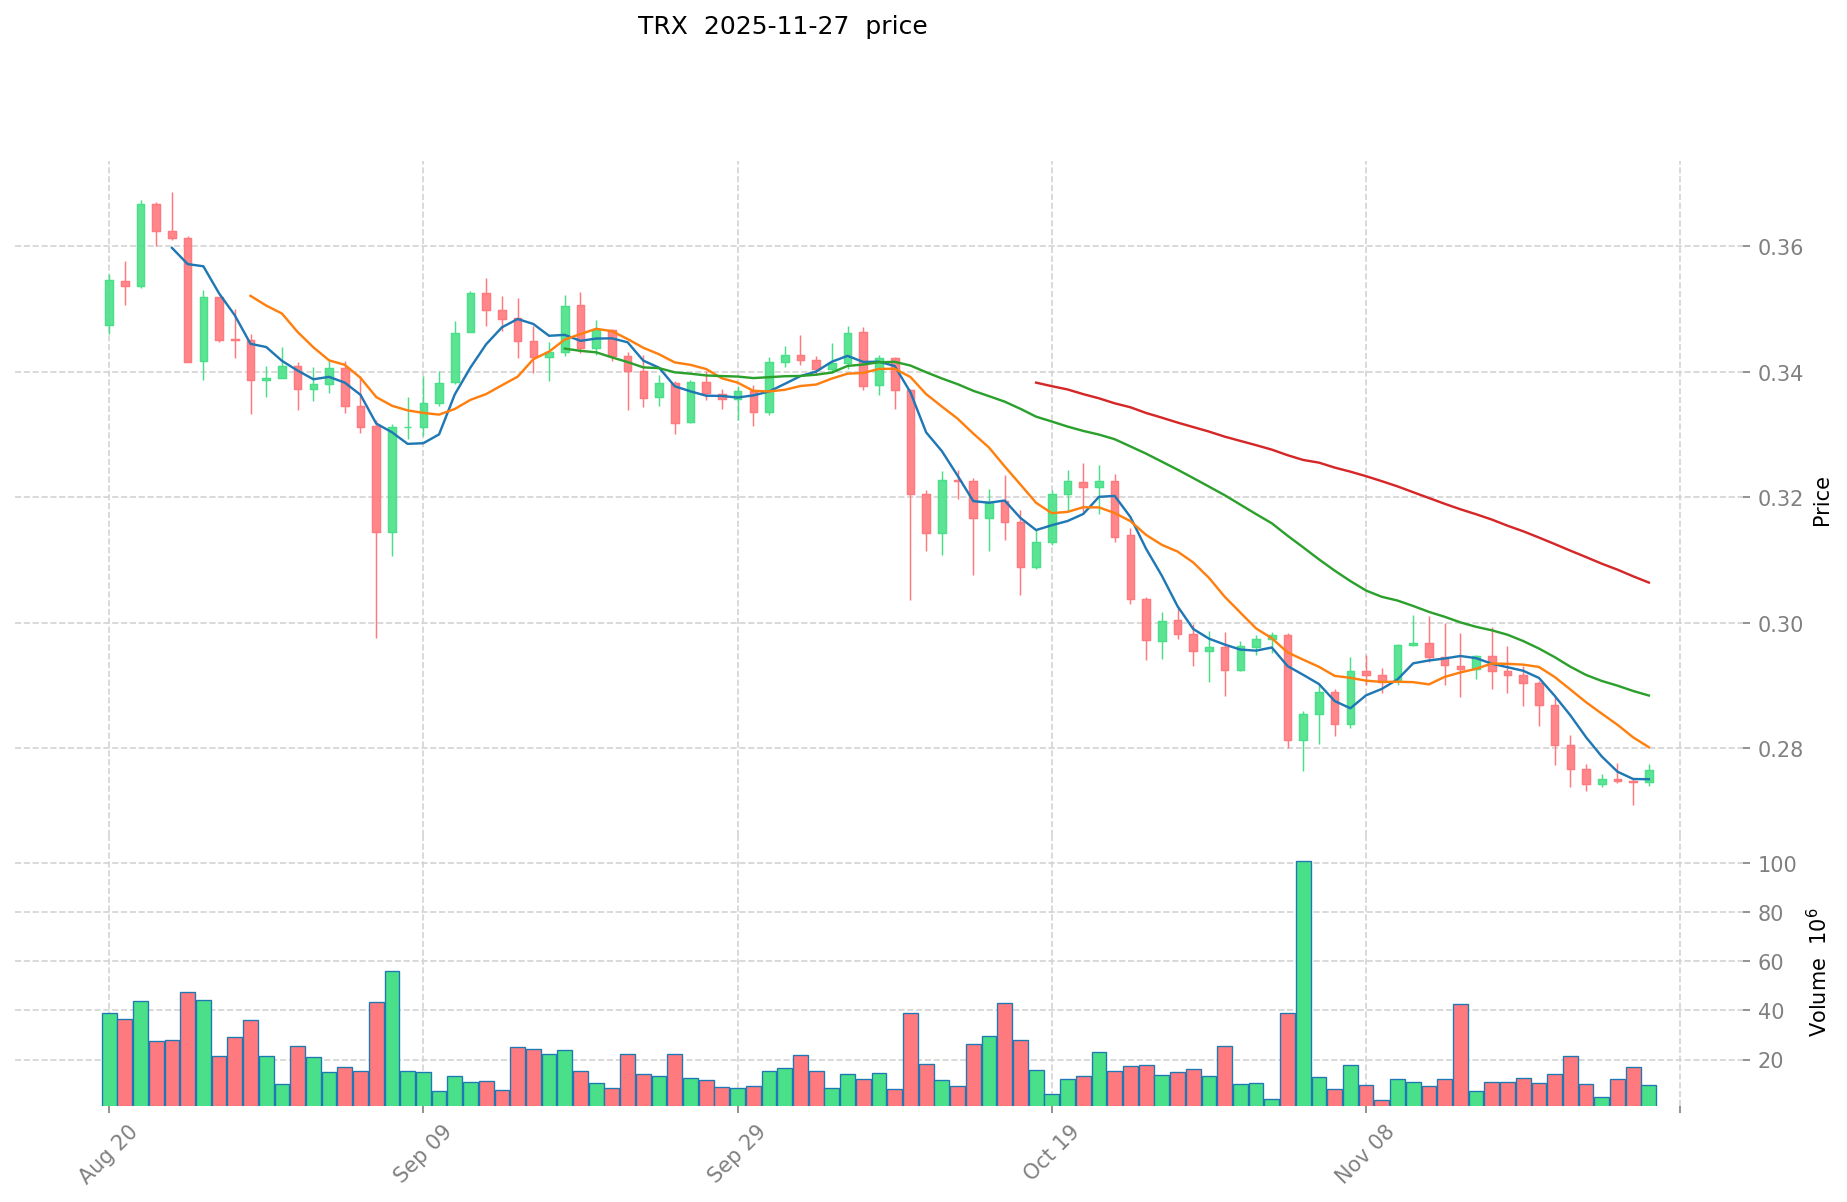
INK and TRX Historical Price Trends
- 2022: TRX launched decentralized stablecoin USDD, positively impacting its price.
- 2024: TRX reached its all-time high of $0.431288 on December 4th.
- Comparative analysis: While INK's all-time high of $0.94183 occurred in 2017, TRX has shown more recent growth, reaching its peak in 2024.
Current Market Situation (2025-11-28)
- INK current price: $0.000601
- TRX current price: $0.28026
- 24-hour trading volume: INK $11,800.31 vs TRX $4,591,111.43
- Market Sentiment Index (Fear & Greed Index): 22 (Extreme Fear)
Click to view real-time prices:
- Check INK current price Market Price
- Check TRX current price Market Price
II. Core Factors Affecting the Investment Value of INK vs TRX
Supply Mechanism Comparison (Tokenomics)
- INK: Currently limited information available about its specific supply mechanism
- TRX: Total supply of 100,842,357,371 TRX with a circulating supply of 88.7 billion TRX. TRON implements a deflationary model by burning TRX tokens
- 📌 Historical Pattern: Deflationary models like TRX's tend to support price appreciation over time as total supply decreases through burning mechanisms.
Institutional Adoption and Market Applications
- Institutional Holdings: TRX appears to have more institutional traction, with TRON DAO Reserve managing significant assets
- Enterprise Adoption: TRX has established itself in cross-border payments and settlements through the TRON network
- National Policies: Regulatory approaches vary, with TRON actively engaging in discussions with regulatory bodies across different jurisdictions
Technology Development and Ecosystem Building
- TRX Technology Development: TRON has focused on expanding its ecosystem with TVM compatibility, high throughput, and low transaction costs
- Ecosystem Comparison: TRX has developed a comprehensive ecosystem spanning DeFi, NFTs, payments, and smart contracts with notable applications like USDD and collaboration with BitTorrent
Macroeconomic and Market Cycles
- Performance in Inflationary Environments: TRX's deflationary model potentially provides some hedge against inflation
- Macroeconomic Monetary Policy: Interest rates and USD index fluctuations impact both assets as part of the broader crypto market
- Geopolitical Factors: TRX has positioned itself for cross-border transaction demand through its global network and partnerships
III. 2025-2030 Price Prediction: INK vs TRX
Short-term Prediction (2025)
- INK: Conservative $0.00033656 - $0.000601 | Optimistic $0.000601 - $0.00088347
- TRX: Conservative $0.145756 - $0.2803 | Optimistic $0.2803 - $0.361587
Mid-term Prediction (2027)
- INK may enter a growth phase, with an estimated price range of $0.0006563584105 - $0.00102001644875
- TRX may enter a growth phase, with an estimated price range of $0.226120742925 - $0.51155184465
- Key drivers: Institutional capital inflow, ETF, ecosystem development
Long-term Prediction (2030)
- INK: Base scenario $0.001259183696857 - $0.001825816360442 | Optimistic scenario $0.001825816360442+
- TRX: Base scenario $0.583205801185507 - $0.711511077446319 | Optimistic scenario $0.711511077446319+
Disclaimer: This analysis is based on historical data and market projections. Cryptocurrency markets are highly volatile and unpredictable. This information should not be considered as financial advice. Always conduct your own research before making any investment decisions.
INK:
| 年份 | 预测最高价 | 预测平均价格 | 预测最低价 | 涨跌幅 |
|---|---|---|---|---|
| 2025 | 0.00088347 | 0.000601 | 0.00033656 | 0 |
| 2026 | 0.00103170665 | 0.000742235 | 0.0004750304 | 23 |
| 2027 | 0.00102001644875 | 0.000886970825 | 0.0006563584105 | 47 |
| 2028 | 0.001077447809668 | 0.000953493636875 | 0.000877214145925 | 58 |
| 2029 | 0.001502896670442 | 0.001015470723271 | 0.000842840700315 | 68 |
| 2030 | 0.001825816360442 | 0.001259183696857 | 0.0008814285878 | 109 |
TRX:
| 年份 | 预测最高价 | 预测平均价格 | 预测最低价 | 涨跌幅 |
|---|---|---|---|---|
| 2025 | 0.361587 | 0.2803 | 0.145756 | 0 |
| 2026 | 0.420435985 | 0.3209435 | 0.23749819 | 14 |
| 2027 | 0.51155184465 | 0.3706897425 | 0.226120742925 | 32 |
| 2028 | 0.5558121999045 | 0.441120793575 | 0.2558500602735 | 57 |
| 2029 | 0.667945105631265 | 0.49846649673975 | 0.25920257830467 | 77 |
| 2030 | 0.711511077446319 | 0.583205801185507 | 0.548213453114377 | 108 |
IV. Investment Strategy Comparison: INK vs TRX
Long-term vs Short-term Investment Strategies
- INK: Suitable for investors focused on content industry potential and niche market opportunities
- TRX: Suitable for investors seeking ecosystem growth, DeFi exposure, and cross-border payment solutions
Risk Management and Asset Allocation
- Conservative investors: INK: 20% vs TRX: 80%
- Aggressive investors: INK: 40% vs TRX: 60%
- Hedging tools: Stablecoin allocation, options, cross-currency portfolios
V. Potential Risk Comparison
Market Risks
- INK: Limited market liquidity and potential for high volatility
- TRX: Susceptibility to broader cryptocurrency market trends and competition from other blockchain platforms
Technical Risks
- INK: Scalability, network stability
- TRX: Hash power concentration, security vulnerabilities
Regulatory Risks
- Global regulatory policies may have differing impacts on both assets, with TRX potentially facing more scrutiny due to its wider adoption and cross-border activities
VI. Conclusion: Which Is the Better Buy?
📌 Investment Value Summary:
- INK advantages: Niche focus on content industry, potential for growth in specialized markets
- TRX advantages: Established ecosystem, deflationary model, cross-border payment solutions, institutional adoption
✅ Investment Advice:
- Novice investors: Consider a higher allocation to TRX due to its established market position and ecosystem
- Experienced investors: Diversify between INK and TRX, with a bias towards TRX for its broader application and adoption
- Institutional investors: Focus on TRX for its liquidity, ecosystem development, and potential for cross-border payment solutions
⚠️ Risk Warning: The cryptocurrency market is highly volatile, and this article does not constitute investment advice. None
VII. FAQ
Q1: What are the key differences between INK and TRX? A: INK focuses on the original content industry, while TRX is a broader decentralized platform for content entertainment and blockchain infrastructure. TRX has a larger market cap, higher trading volume, and a more developed ecosystem compared to INK.
Q2: Which cryptocurrency has shown better recent price performance? A: TRX has shown better recent price performance, reaching its all-time high of $0.431288 in December 2024, while INK's all-time high of $0.94183 occurred in 2017.
Q3: How do the supply mechanisms of INK and TRX differ? A: TRX has a total supply of 100,842,357,371 TRX with a circulating supply of 88.7 billion TRX and implements a deflationary model by burning tokens. Limited information is available about INK's specific supply mechanism.
Q4: Which cryptocurrency has greater institutional adoption? A: TRX appears to have more institutional traction, with TRON DAO Reserve managing significant assets and established use in cross-border payments and settlements through the TRON network.
Q5: What are the long-term price predictions for INK and TRX by 2030? A: For INK, the base scenario predicts a range of $0.001259183696857 - $0.001825816360442. For TRX, the base scenario predicts a range of $0.583205801185507 - $0.711511077446319. Both have potential for higher prices in optimistic scenarios.
Q6: How should investors allocate their assets between INK and TRX? A: Conservative investors might consider allocating 20% to INK and 80% to TRX, while aggressive investors might opt for 40% INK and 60% TRX. The allocation depends on individual risk tolerance and investment goals.
Q7: What are the main risks associated with investing in INK and TRX? A: Risks include market volatility, technical challenges (such as scalability and security), and regulatory uncertainties. TRX may face more regulatory scrutiny due to its wider adoption and cross-border activities, while INK may have limited market liquidity and higher volatility risks.
Share
Content
Introduction: INK vs TRX Investment Comparison
I. Price History Comparison and Current Market Status
II. Core Factors Affecting the Investment Value of INK vs TRX
III. 2025-2030 Price Prediction: INK vs TRX
IV. Investment Strategy Comparison: INK vs TRX
V. Potential Risk Comparison
VI. Conclusion: Which Is the Better Buy?
VII. FAQ

