INFRA vs SOL: The Battle for Blockchain Supremacy in Smart Contract Platforms
Introduction: INFRA vs SOL Investment Comparison
In the cryptocurrency market, the comparison between INFRA vs SOL has always been a topic that investors can't ignore. The two not only have significant differences in market cap ranking, application scenarios, and price performance, but also represent different positions in crypto assets.
INFRA (INFRA): Since its launch in 2023, it has gained market recognition for its high-end infrastructure and development tools in the Web3 space.
SOL (SOL): Since its inception in 2017, it has been hailed as a high-performance blockchain protocol, becoming one of the cryptocurrencies with the highest global trading volume and market capitalization.
This article will comprehensively analyze the investment value comparison between INFRA vs SOL, focusing on historical price trends, supply mechanisms, institutional adoption, technological ecosystems, and future predictions, attempting to answer the question that concerns investors the most:
"Which is the better buy right now?"
I. Price History Comparison and Current Market Status
INFRA (Coin A) and SOL (Coin B) Historical Price Trends
- 2024: SOL reached its all-time high of $293.31 on January 19, 2024, marking a significant milestone in its price history.
- 2025: INFRA hit its all-time high of $2.5433 on January 24, 2025, showcasing substantial growth.
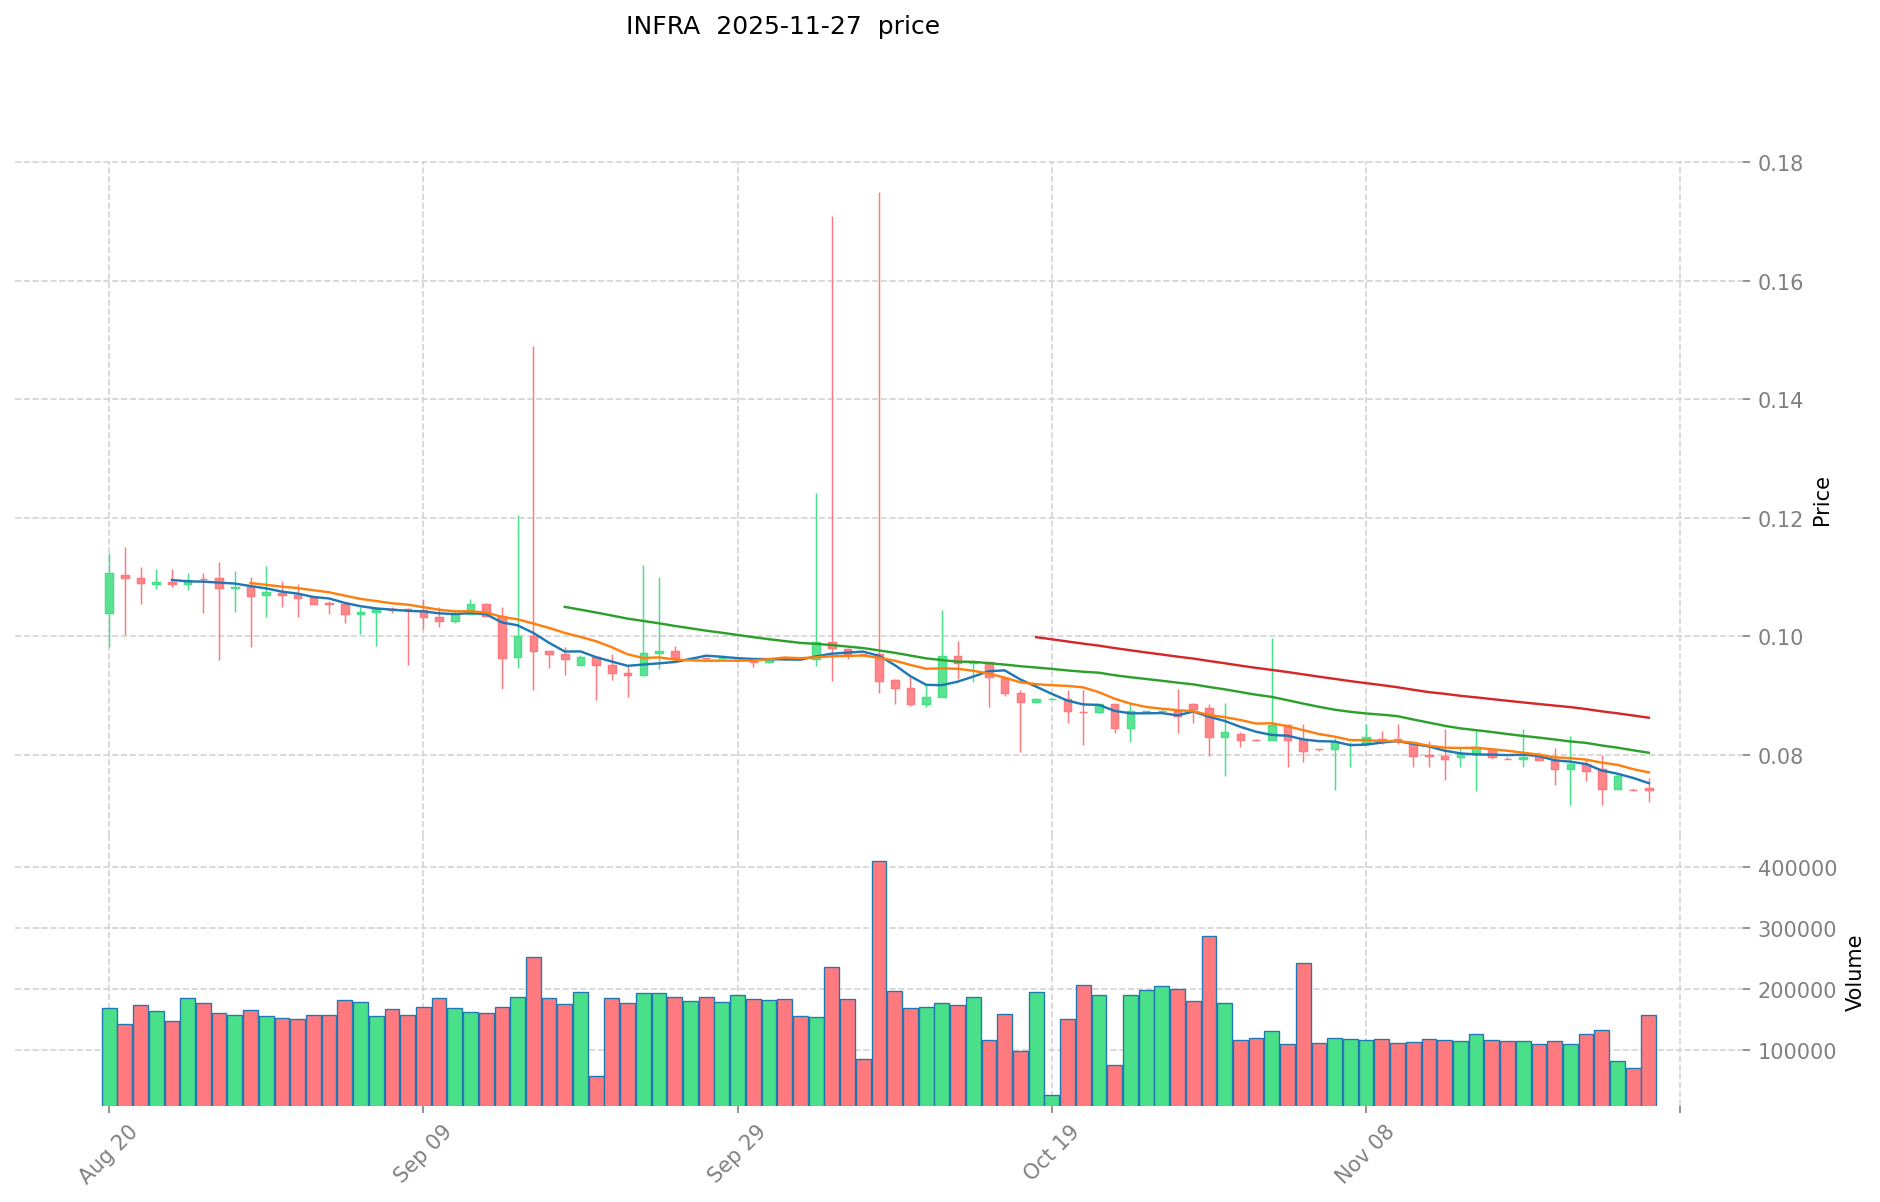
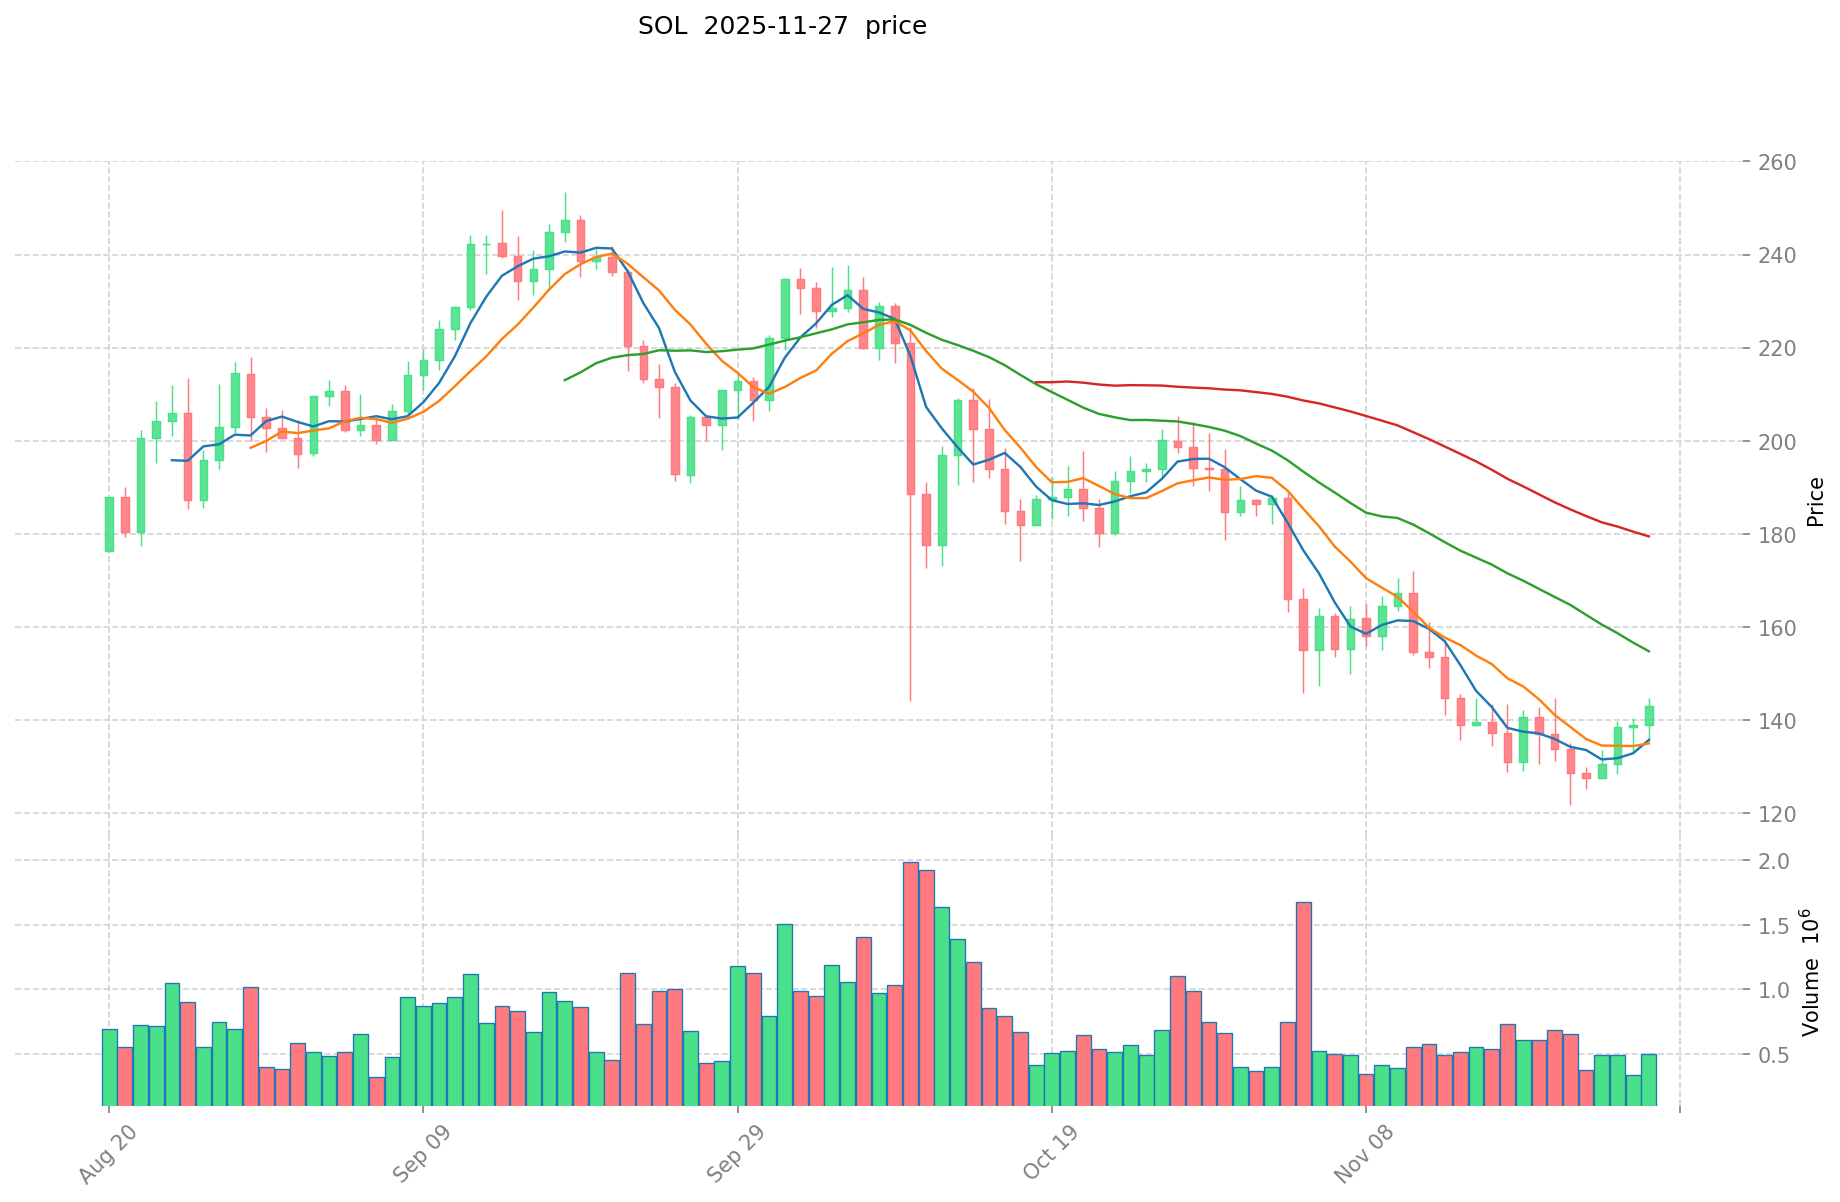
- Comparative analysis: In the recent market cycle, INFRA dropped from its high of $2.5433 to a low of $0.07146, while SOL declined from $293.31 to its current price of $142.57.
Current Market Situation (2025-11-27)
- INFRA current price: $0.07404
- SOL current price: $142.57
- 24-hour trading volume: INFRA $11,554.67502 vs SOL $69,021,284.70003
- Market Sentiment Index (Fear & Greed Index): 22 (Extreme Fear)
Click to view real-time prices:
- Check INFRA's current price Market Price
- Check SOL's current price Market Price
II. Core Factors Affecting Investment Value of INFRA vs SOL
Supply Mechanism Comparison (Tokenomics)
-
INFRA: Limited supply of 100 million tokens with deflationary model (47.5% for ecosystem development, 17.5% for team, 35% for public sale)
-
SOL: Disinflationary model with annual inflation starting at 8% and gradually decreasing to 1.5%, creating selling pressure
-
📌 Historical Pattern: Fixed supply models like INFRA's tend to create stronger price appreciation during bull markets, while SOL's inflation model creates consistent selling pressure.
Institutional Adoption and Market Applications
- Institutional Holdings: SOL currently has stronger institutional backing with investments from Alameda Research, Multicoin Capital, and FTX Ventures
- Enterprise Adoption: SOL leads with established partnerships in payments (Stripe) and broader enterprise integration, while INFRA is still building its institutional relationships
- Regulatory Attitudes: Both face similar regulatory scrutiny, with SOL having weathered more regulatory challenges historically
Technical Development and Ecosystem Building
- INFRA Technical Upgrades: Layer-2 solution offering 100,000+ TPS with near-zero fees; focus on interoperability with EVM compatibility
- SOL Technical Development: High throughput (65,000 TPS), but faces periodic network outages; improving stability through validator program
- Ecosystem Comparison: SOL has mature DeFi TVL ($13.1B) and established NFT marketplace; INFRA shows promising early growth in DeFi applications with lower fees
Macroeconomic Factors and Market Cycles
- Inflation Performance: Both assets have shown volatility during inflationary periods, with SOL having longer track record
- Monetary Policy Impact: Rising interest rates have affected both negatively, with SOL showing higher correlation to traditional markets
- Geopolitical Factors: Cross-border transaction demand benefits both, with SOL currently having wider global adoption footprint
III. 2025-2030 Price Prediction: INFRA vs SOL
Short-term Prediction (2025)
- INFRA: Conservative $0.0698 - $0.0743 | Optimistic $0.0743 - $0.0795
- SOL: Conservative $123.91 - $142.42 | Optimistic $142.42 - $202.24
Mid-term Prediction (2027)
- INFRA may enter a growth phase, with estimated prices of $0.0541 - $0.1130
- SOL may enter a bullish market, with estimated prices of $122.14 - $261.72
- Key drivers: Institutional capital inflow, ETF, ecosystem development
Long-term Prediction (2030)
- INFRA: Base scenario $0.1421 - $0.1620 | Optimistic scenario $0.1620 - $0.1832
- SOL: Base scenario $260.34 - $296.79 | Optimistic scenario $296.79 - $333.24
Disclaimer: The above predictions are based on historical data and market analysis. Cryptocurrency markets are highly volatile and subject to rapid changes. These projections should not be considered as financial advice or guarantees of future performance. Always conduct your own research before making investment decisions.
INFRA:
| 年份 | 预测最高价 | 预测平均价格 | 预测最低价 | 涨跌幅 |
|---|---|---|---|---|
| 2025 | 0.0794796 | 0.07428 | 0.0698232 | 0 |
| 2026 | 0.082261386 | 0.0768798 | 0.066116628 | 3 |
| 2027 | 0.11299024206 | 0.079570593 | 0.05410800324 | 7 |
| 2028 | 0.1434578221197 | 0.09628041753 | 0.0519914254662 | 30 |
| 2029 | 0.164220694160044 | 0.11986911982485 | 0.061133251110673 | 61 |
| 2030 | 0.183237930020257 | 0.142044906992447 | 0.132101763502975 | 91 |
SOL:
| 年份 | 预测最高价 | 预测平均价格 | 预测最低价 | 涨跌幅 |
|---|---|---|---|---|
| 2025 | 202.2364 | 142.42 | 123.9054 | 0 |
| 2026 | 215.41025 | 172.3282 | 155.09538 | 20 |
| 2027 | 261.72345375 | 193.869225 | 122.13761175 | 35 |
| 2028 | 239.18615634375 | 227.796339375 | 164.01336435 | 59 |
| 2029 | 287.19423486703125 | 233.491247859375 | 158.774048544375 | 63 |
| 2030 | 333.2387089449 | 260.342741363203125 | 192.653628608770312 | 82 |
IV. Investment Strategy Comparison: INFRA vs SOL
Long-term vs Short-term Investment Strategies
- INFRA: Suitable for investors focused on Web3 infrastructure potential and ecosystem growth
- SOL: Suitable for investors seeking established ecosystems and high-performance blockchain protocols
Risk Management and Asset Allocation
- Conservative investors: INFRA: 20% vs SOL: 80%
- Aggressive investors: INFRA: 40% vs SOL: 60%
- Hedging tools: Stablecoin allocation, options, cross-currency portfolios
V. Potential Risk Comparison
Market Risks
- INFRA: Higher volatility due to lower market cap and trading volume
- SOL: Susceptibility to broader market trends and institutional trading patterns
Technical Risks
- INFRA: Scalability, network stability in early stages
- SOL: Network outages, centralization concerns
Regulatory Risks
- Global regulatory policies may impact both, with SOL potentially facing more scrutiny due to its larger market presence
VI. Conclusion: Which Is the Better Buy?
📌 Investment Value Summary:
- INFRA advantages: High-end infrastructure focus, deflationary model, potential for growth
- SOL advantages: Established ecosystem, high performance, strong institutional backing
✅ Investment Advice:
- Novice investors: Consider a higher allocation to SOL for its established market position
- Experienced investors: Balanced portfolio with both INFRA and SOL, adjusting based on risk tolerance
- Institutional investors: Evaluate INFRA for long-term potential, maintain SOL positions for established performance
⚠️ Risk Warning: Cryptocurrency markets are highly volatile. This article does not constitute investment advice. None
VII. FAQ
Q1: What are the key differences between INFRA and SOL in terms of supply mechanisms? A: INFRA has a limited supply of 100 million tokens with a deflationary model, while SOL uses a disinflationary model with annual inflation starting at 8% and gradually decreasing to 1.5%.
Q2: How do INFRA and SOL compare in terms of institutional adoption? A: SOL currently has stronger institutional backing with investments from major players like Alameda Research and Multicoin Capital. INFRA is still in the process of building its institutional relationships.
Q3: What are the main technical differences between INFRA and SOL? A: INFRA offers a Layer-2 solution with 100,000+ TPS and near-zero fees, focusing on interoperability. SOL boasts high throughput (65,000 TPS) but has faced network outages, and is working on improving stability.
Q4: How do the ecosystems of INFRA and SOL compare? A: SOL has a mature DeFi ecosystem with $13.1B in TVL and an established NFT marketplace. INFRA shows promising early growth in DeFi applications with lower fees but is still developing its ecosystem.
Q5: What are the long-term price predictions for INFRA and SOL by 2030? A: For INFRA, the base scenario predicts $0.1421 - $0.1620, with an optimistic scenario of $0.1620 - $0.1832. For SOL, the base scenario predicts $260.34 - $296.79, with an optimistic scenario of $296.79 - $333.24.
Q6: How should investors allocate their portfolio between INFRA and SOL? A: Conservative investors might consider 20% INFRA and 80% SOL, while aggressive investors could opt for 40% INFRA and 60% SOL. The exact allocation should be based on individual risk tolerance and investment goals.
Share
Content
Introduction: INFRA vs SOL Investment Comparison
I. Price History Comparison and Current Market Status
II. Core Factors Affecting Investment Value of INFRA vs SOL
III. 2025-2030 Price Prediction: INFRA vs SOL
IV. Investment Strategy Comparison: INFRA vs SOL
V. Potential Risk Comparison
VI. Conclusion: Which Is the Better Buy?
VII. FAQ

