HAHA vs APT: The Battle of Cybersecurity Titans in the Digital Age
Introduction: HAHA vs APT Investment Comparison
In the cryptocurrency market, the comparison between Hasaki (HAHA) vs Aptos (APT) has been an unavoidable topic for investors. The two not only show significant differences in market cap ranking, application scenarios, and price performance, but also represent different positioning in the crypto asset space.
Hasaki (HAHA): Launched in 2023, it has gained market recognition for its position as an artificial intelligence assistant in the cryptocurrency world.
Aptos (APT): Since its introduction in 2022, it has been hailed as a high-performance PoS Layer 1 project, focusing on delivering a secure and scalable blockchain.
This article will provide a comprehensive analysis of the investment value comparison between HAHA and APT, focusing on historical price trends, supply mechanisms, institutional adoption, technological ecosystems, and future predictions, attempting to answer the question most concerning to investors:
"Which is the better buy right now?"
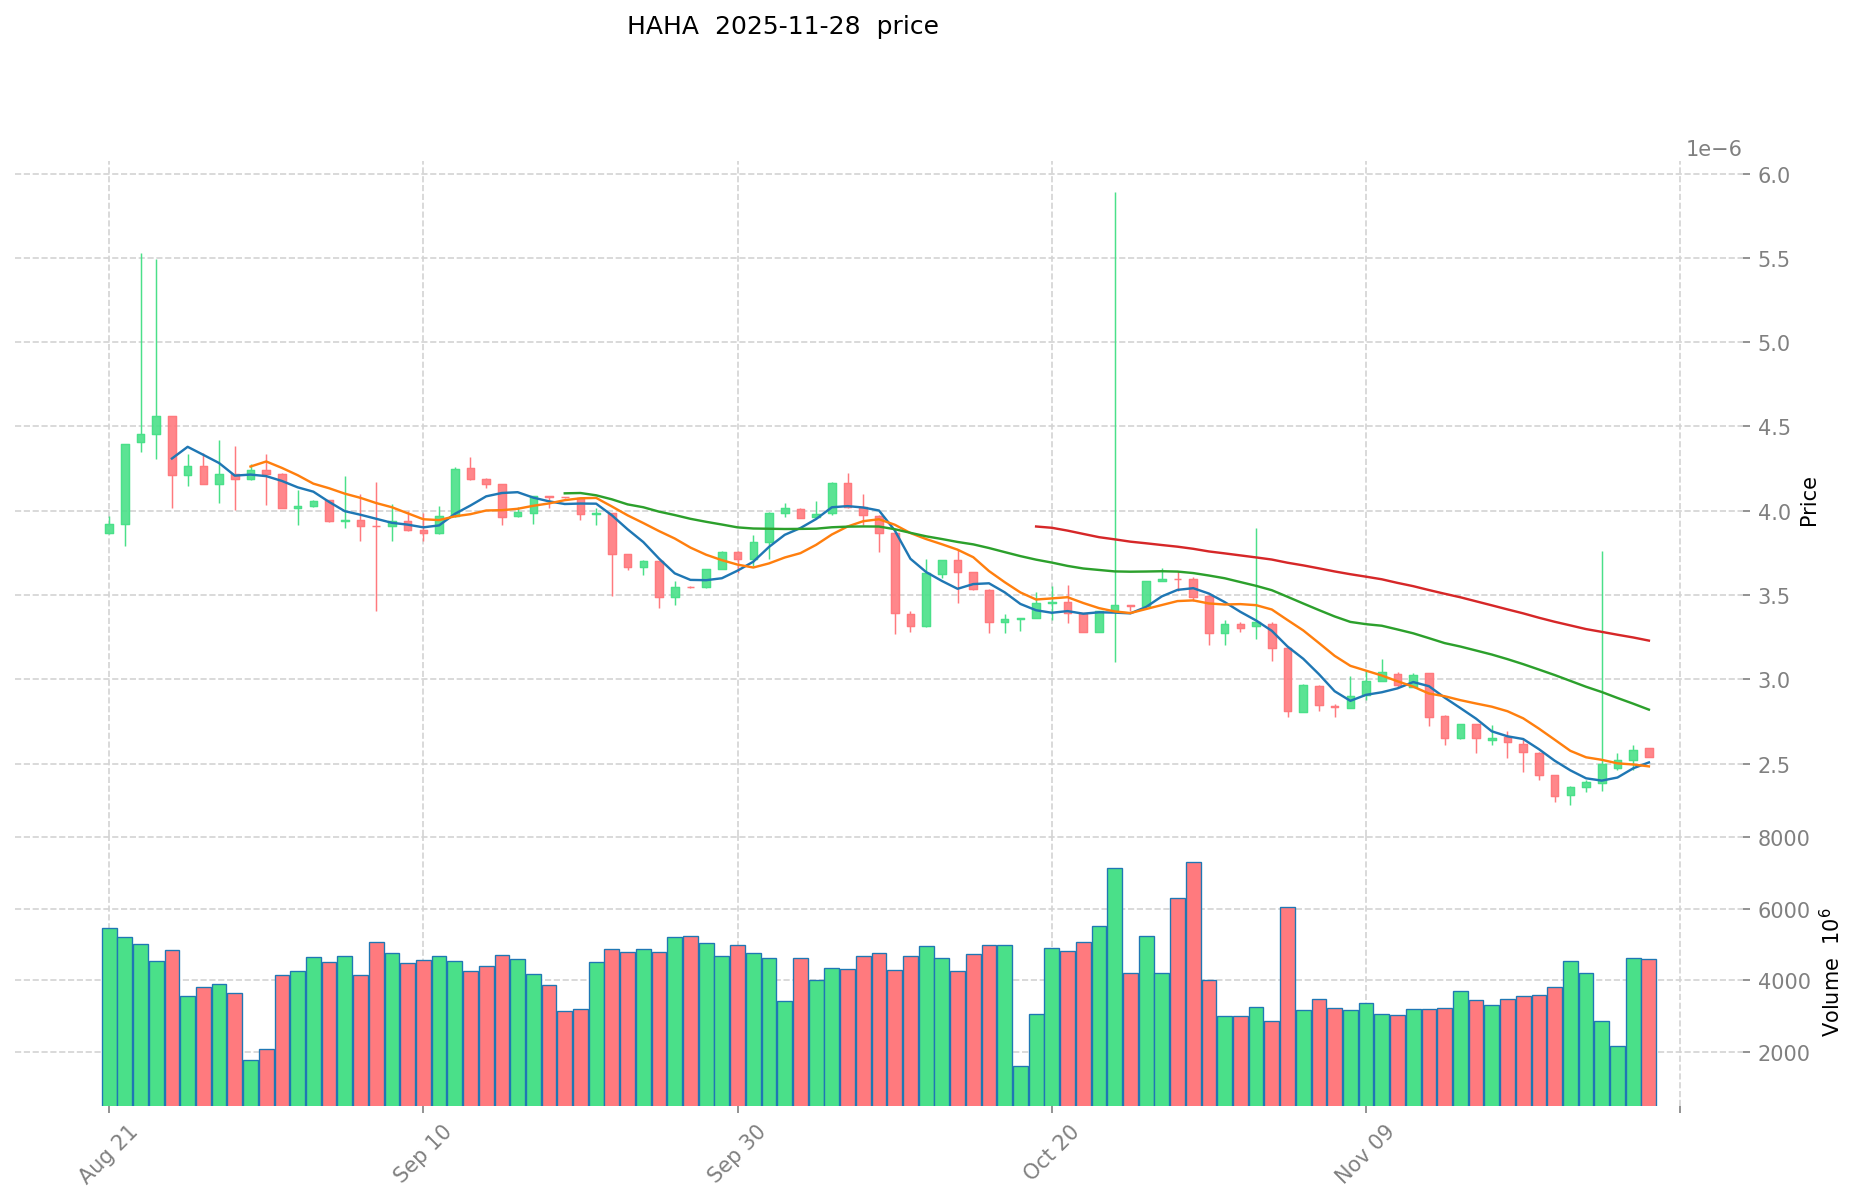
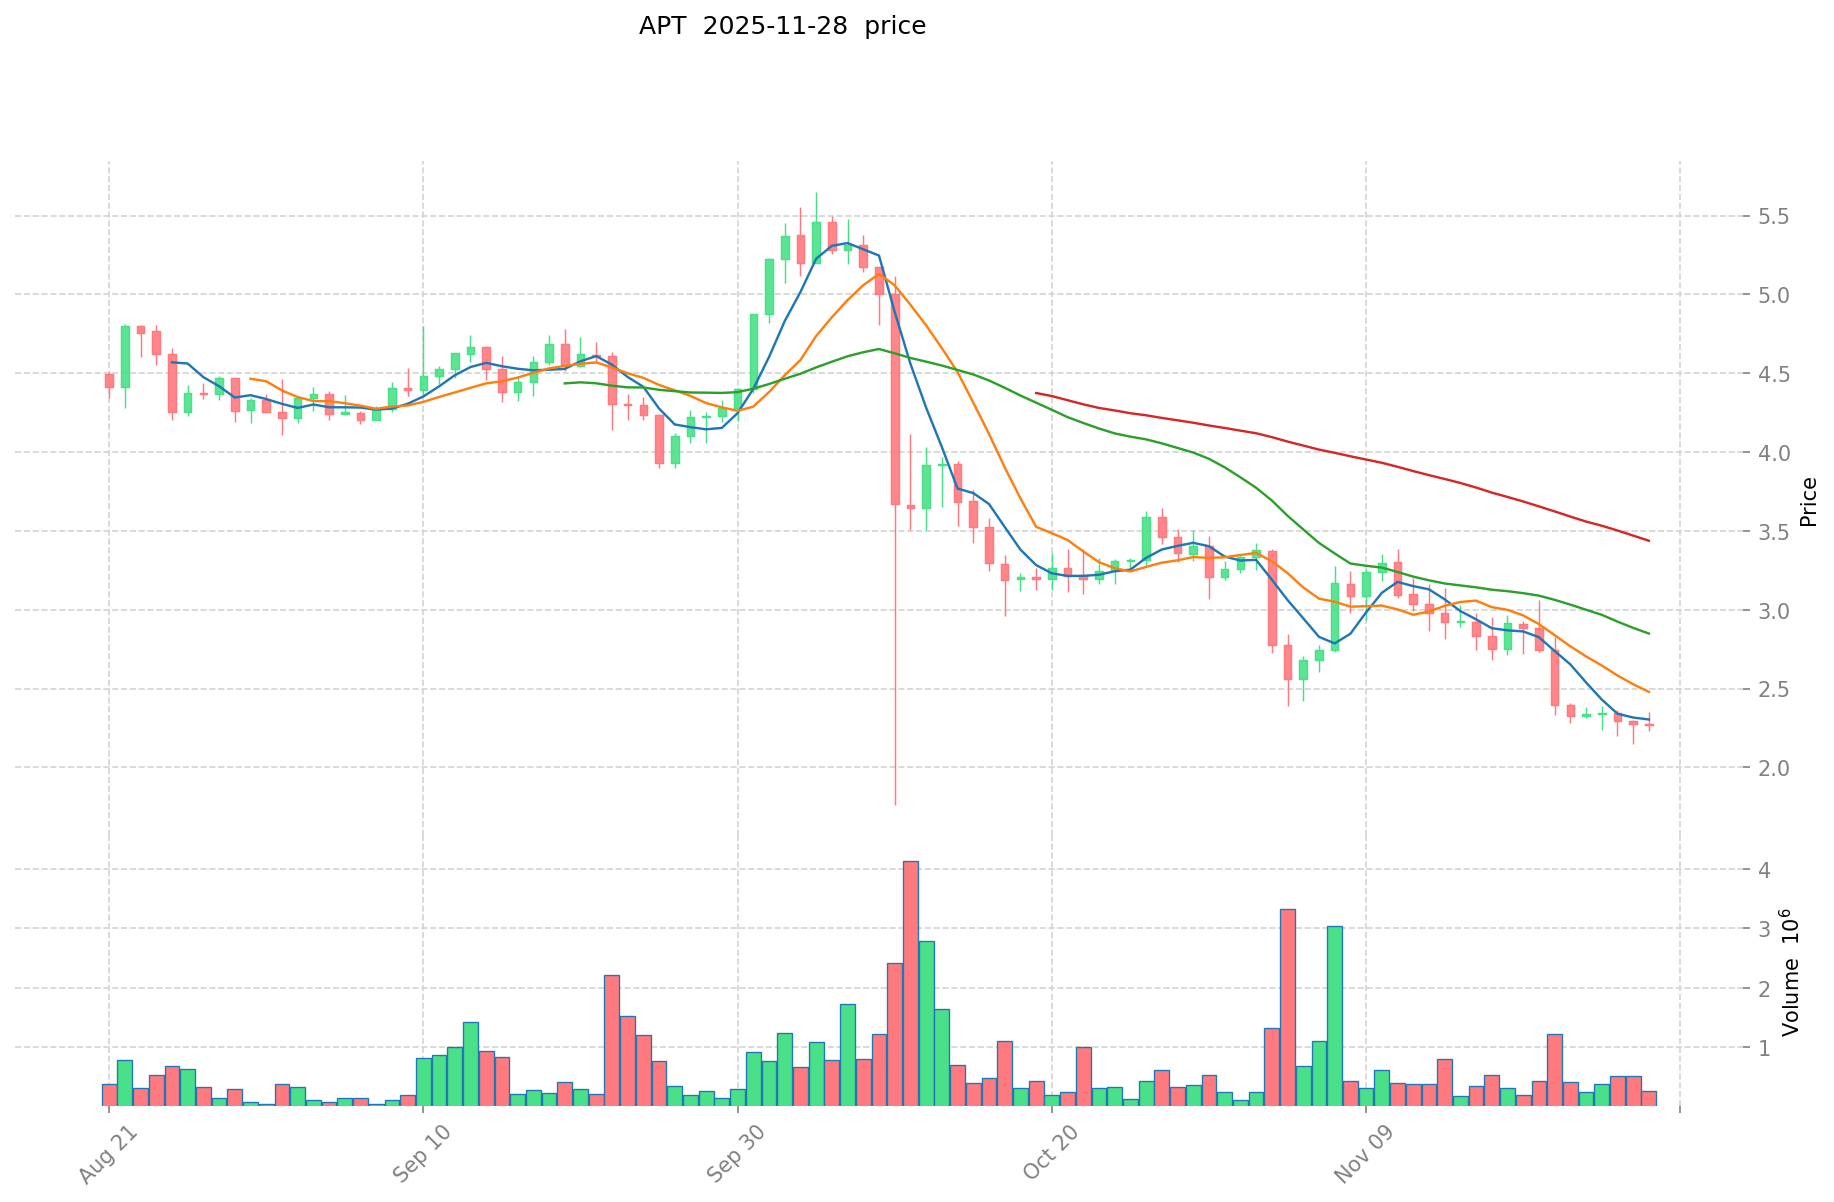
I. Price History Comparison and Current Market Status
HAHA (Coin A) and APT (Coin B) Historical Price Trends
- 2023: HAHA reached its all-time high of $0.000187 on May 6, 2023.
- 2023: APT reached its all-time high of $19.92 on January 26, 2023.
- Comparative analysis: In the current market cycle, HAHA has dropped from its high of $0.000187 to a low of $0.000002049, while APT has fallen from its peak of $19.92 to a low of $2.15.
Current Market Situation (2025-11-28)
- HAHA current price: $0.000002536
- APT current price: $2.185
- 24-hour trading volume: HAHA $11,697.63 vs APT $608,333.36
- Market Sentiment Index (Fear & Greed Index): 25 (Extreme Fear)
Click to view real-time prices:
- Check HAHA current price Market Price
- Check APT current price Market Price
II. Core Factors Affecting Investment Value of HAHA vs APT
Supply Mechanism Comparison (Tokenomics)
- HAHA: Fixed supply mechanism with deflationary model
- APT: Progressive release schedule with diminishing issuance over time
- 📌 Historical Pattern: Deflationary supply mechanisms typically create upward price pressure during market expansion phases, while measured issuance helps maintain stability during market contraction.
Institutional Adoption and Market Applications
- Institutional Holdings: APT has gained more institutional backing with strategic investments from major venture capital firms
- Enterprise Adoption: APT demonstrates stronger integration in payment systems and decentralized applications compared to HAHA
- National Policies: Regulatory frameworks remain developing for both tokens, with APT generally receiving more favorable treatment in innovation-focused jurisdictions
Technical Development and Ecosystem Building
- HAHA Technical Upgrades: Layer-2 scaling solutions and enhanced privacy features
- APT Technical Development: Move programming language providing enhanced security and formal verification capabilities
- Ecosystem Comparison: APT has established a more comprehensive DeFi and NFT ecosystem with stronger developer activity and transaction volumes
Macroeconomic Factors and Market Cycles
- Performance During Inflation: Both assets have demonstrated inflation-resistant properties, though historical data remains limited
- Macroeconomic Monetary Policy: Interest rate hikes typically pressure both assets similarly, with correlation to tech equities
- Geopolitical Factors: Cross-border transaction demands favor both tokens in regions experiencing currency instability
III. 2025-2030 Price Prediction: HAHA vs APT
Short-term Prediction (2025)
- HAHA: Conservative $0.00000190875 - $0.000002545 | Optimistic $0.000002545 - $0.00000307945
- APT: Conservative $1.92104 - $2.183 | Optimistic $2.183 - $2.77241
Mid-term Prediction (2027)
- HAHA may enter a growth phase, with an estimated price range of $0.00000196743261 - $0.000004083913145
- APT may enter a bullish market, with an estimated price range of $2.63627812 - $4.134794104
- Key drivers: Institutional capital inflow, ETF, ecosystem development
Long-term Prediction (2030)
- HAHA: Base scenario $0.000002938945981 - $0.000004981264375 | Optimistic scenario $0.000004981264375 - $0.000006625081618
- APT: Base scenario $2.612177660868678 - $4.5827678260854 | Optimistic scenario $4.5827678260854 - $6.782496382606392
Disclaimer
HAHA:
| 年份 | 预测最高价 | 预测平均价格 | 预测最低价 | 涨跌幅 |
|---|---|---|---|---|
| 2025 | 0.00000307945 | 0.000002545 | 0.00000190875 | 0 |
| 2026 | 0.000003149692 | 0.000002812225 | 0.0000018560685 | 10 |
| 2027 | 0.000004083913145 | 0.0000029809585 | 0.00000196743261 | 17 |
| 2028 | 0.000004839437076 | 0.000003532435822 | 0.000001801542269 | 39 |
| 2029 | 0.0000057765923 | 0.000004185936449 | 0.00000288829615 | 65 |
| 2030 | 0.000006625081618 | 0.000004981264375 | 0.000002938945981 | 96 |
APT:
| 年份 | 预测最高价 | 预测平均价格 | 预测最低价 | 涨跌幅 |
|---|---|---|---|---|
| 2025 | 2.77241 | 2.183 | 1.92104 | 0 |
| 2026 | 3.0723542 | 2.477705 | 2.20515745 | 12 |
| 2027 | 4.134794104 | 2.7750296 | 2.63627812 | 26 |
| 2028 | 4.21499245944 | 3.454911852 | 2.03839799268 | 57 |
| 2029 | 5.3305834964508 | 3.83495215572 | 2.7995150736756 | 74 |
| 2030 | 6.782496382606392 | 4.5827678260854 | 2.612177660868678 | 108 |
IV. Investment Strategy Comparison: HAHA vs APT
Long-term vs Short-term Investment Strategies
- HAHA: Suitable for investors focusing on AI applications and ecosystem potential
- APT: Suitable for investors seeking stability and scalability in Layer 1 solutions
Risk Management and Asset Allocation
- Conservative investors: HAHA: 20% vs APT: 80%
- Aggressive investors: HAHA: 40% vs APT: 60%
- Hedging tools: Stablecoin allocation, options, cross-currency portfolios
V. Potential Risk Comparison
Market Risk
- HAHA: Higher volatility due to smaller market cap and newer project status
- APT: Susceptible to broader Layer 1 competition and market sentiment shifts
Technical Risk
- HAHA: Scalability, network stability
- APT: Centralization concerns, potential security vulnerabilities in Move language
Regulatory Risk
- Global regulatory policies may have differing impacts on both tokens, with APT potentially facing more scrutiny as a Layer 1 platform
VI. Conclusion: Which Is the Better Buy?
📌 Investment Value Summary:
- HAHA advantages: AI integration, deflationary model, potential for rapid growth
- APT advantages: Established ecosystem, institutional backing, scalable Layer 1 solution
✅ Investment Advice:
- New investors: Consider a balanced approach with a higher allocation to APT for stability
- Experienced investors: Explore a more balanced portfolio between HAHA and APT based on risk tolerance
- Institutional investors: Focus on APT for its established ecosystem and potential for long-term growth
⚠️ Risk Warning: The cryptocurrency market is highly volatile. This article does not constitute investment advice. None
VII. FAQ
Q1: What are the main differences between HAHA and APT? A: HAHA is an AI-focused cryptocurrency launched in 2023, while APT is a high-performance PoS Layer 1 project introduced in 2022. HAHA has a fixed supply with a deflationary model, whereas APT has a progressive release schedule. APT has gained more institutional backing and has a more comprehensive DeFi and NFT ecosystem.
Q2: Which cryptocurrency has shown better price performance historically? A: APT has shown better historical price performance. It reached an all-time high of $19.92 on January 26, 2023, while HAHA's all-time high was $0.000187 on May 6, 2023. However, both have experienced significant drops from their peak prices.
Q3: What are the key factors affecting the investment value of HAHA and APT? A: Key factors include supply mechanisms, institutional adoption, technical development, ecosystem building, macroeconomic factors, and market cycles. APT generally has an advantage in institutional adoption and ecosystem development, while HAHA's deflationary model could create upward price pressure during market expansion.
Q4: How do the future price predictions for HAHA and APT compare? A: By 2030, HAHA's optimistic scenario predicts a range of $0.000004981264375 - $0.000006625081618, while APT's optimistic scenario predicts $4.5827678260854 - $6.782496382606392. Both cryptocurrencies are expected to show growth, with APT potentially offering higher absolute returns.
Q5: What are the recommended investment strategies for HAHA and APT? A: For conservative investors, a suggested allocation is 20% HAHA and 80% APT. For aggressive investors, the recommendation is 40% HAHA and 60% APT. HAHA may be suitable for investors focusing on AI applications, while APT may appeal to those seeking stability in Layer 1 solutions.
Q6: What are the potential risks associated with investing in HAHA and APT? A: Both face market risks, with HAHA potentially experiencing higher volatility due to its smaller market cap. Technical risks include scalability issues for HAHA and potential security vulnerabilities for APT. Regulatory risks may affect both, with APT potentially facing more scrutiny as a Layer 1 platform.
Q7: Which cryptocurrency is considered the better buy overall? A: The better buy depends on individual investment goals and risk tolerance. APT may be more suitable for new investors seeking stability, while experienced investors might consider a balanced portfolio between HAHA and APT. Institutional investors may lean towards APT for its established ecosystem and long-term growth potential.
Share
Content
Introduction: HAHA vs APT Investment Comparison
I. Price History Comparison and Current Market Status
II. Core Factors Affecting Investment Value of HAHA vs APT
III. 2025-2030 Price Prediction: HAHA vs APT
IV. Investment Strategy Comparison: HAHA vs APT
V. Potential Risk Comparison
VI. Conclusion: Which Is the Better Buy?
VII. FAQ

