DFYN vs ENJ: Comparing Two Innovative Blockchain Platforms for Gaming and NFTs
Introduction: DFYN vs ENJ Investment Comparison
In the cryptocurrency market, the comparison between DFYN and ENJ has always been a topic that investors cannot ignore. The two not only have significant differences in market cap ranking, application scenarios, and price performance, but also represent different cryptocurrency positioning.
DFYN (DFYN): Since its launch in 2021, it has gained market recognition for its multi-chain AMM DEX capabilities.
ENJ (ENJ): Since its inception in 2017, it has been hailed as a pioneer in the gaming and NFT sectors, and is one of the most widely recognized gaming-focused cryptocurrencies.
This article will comprehensively analyze the investment value comparison between DFYN and ENJ, focusing on historical price trends, supply mechanisms, institutional adoption, technological ecosystems, and future predictions, and attempt to answer the question that investors care about most:
"Which is the better buy right now?"
I. Price History Comparison and Current Market Status
DFYN and ENJ Historical Price Trends
- 2021: DFYN reached its all-time high of $8.38 on May 16, 2021, shortly after its launch.
- 2021: ENJ hit its all-time high of $4.82 on November 25, 2021, during the overall crypto market bull run.
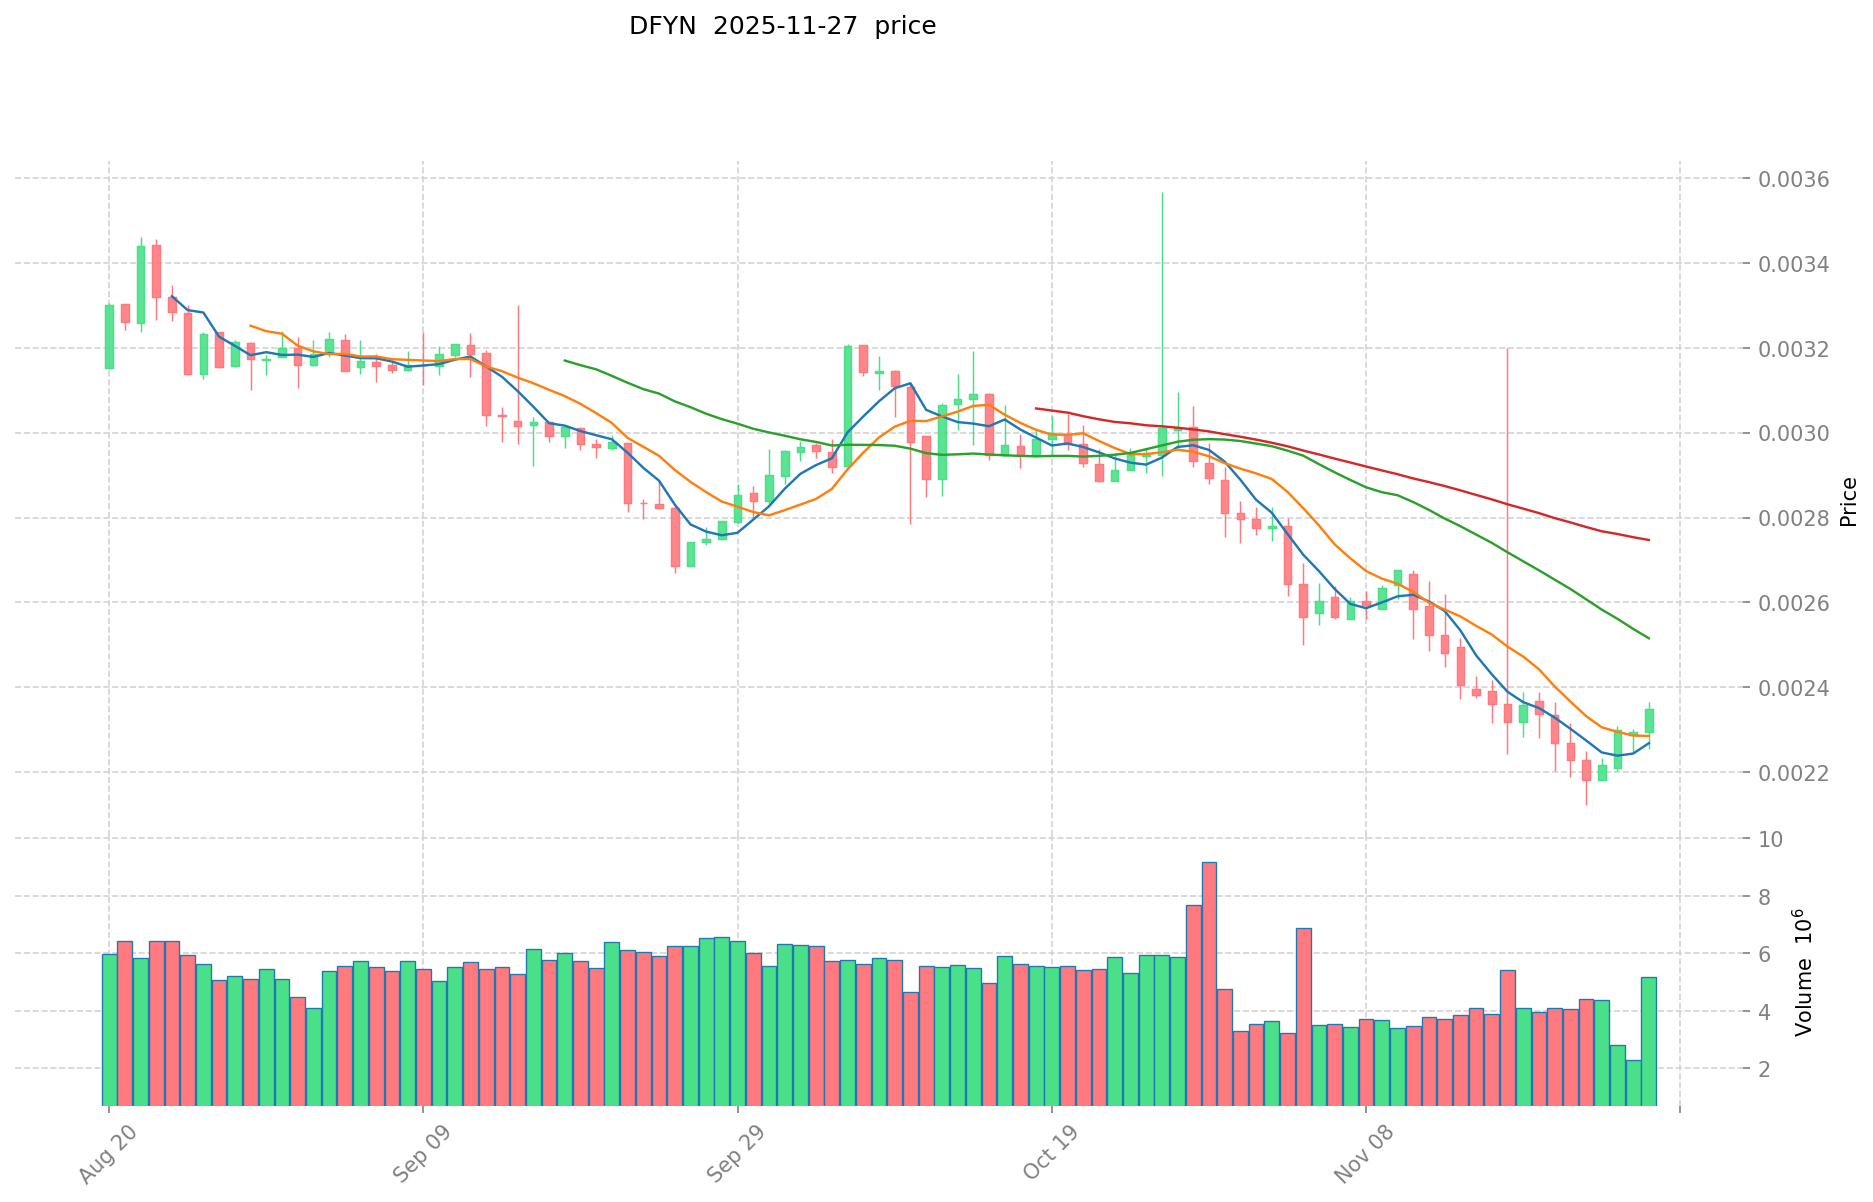
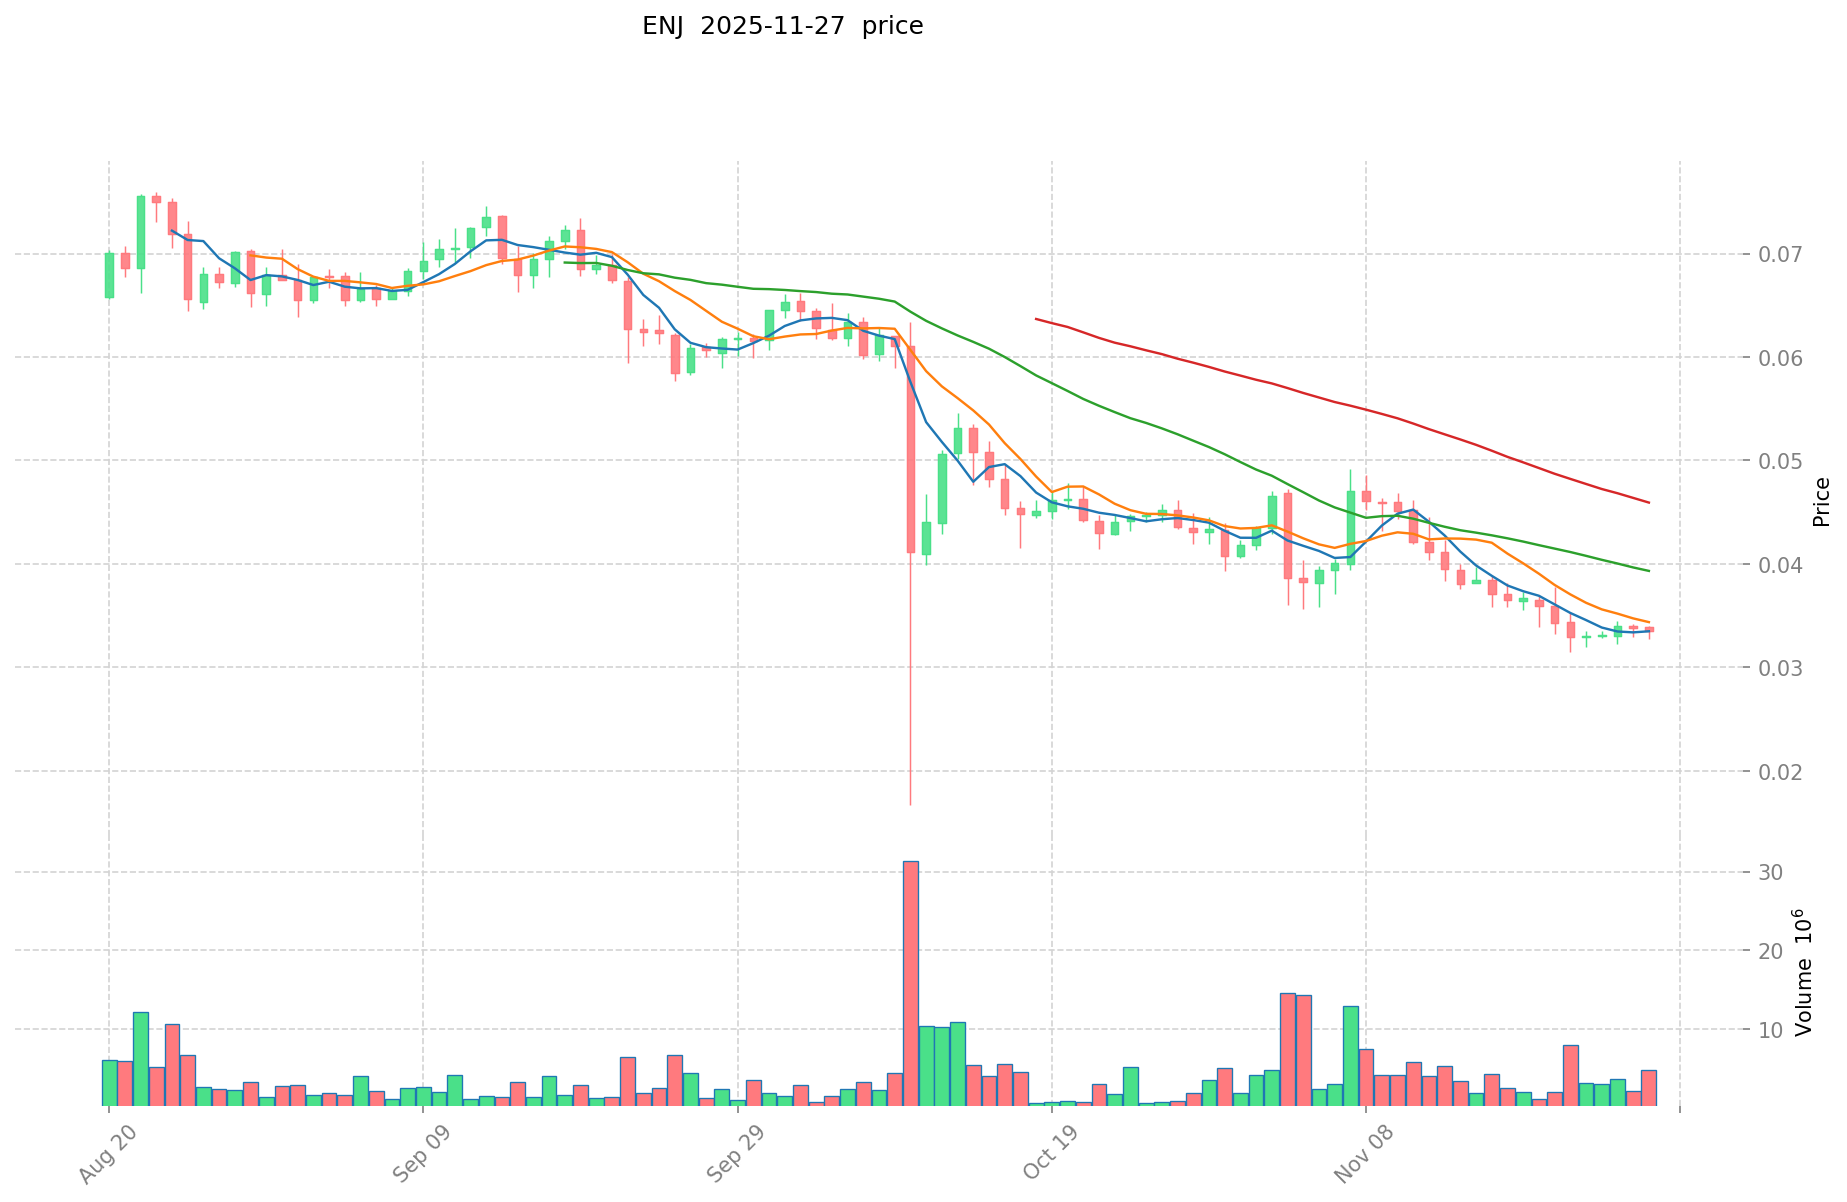
- Comparative analysis: From their respective all-time highs, DFYN has fallen to $0.002359, while ENJ has dropped to $0.03354, representing significant declines for both tokens in the current market cycle.
Current Market Situation (2025-11-27)
- DFYN current price: $0.002359
- ENJ current price: $0.03354
- 24-hour trading volume: DFYN $11,940.68 vs ENJ $161,681.14
- Market Sentiment Index (Fear & Greed Index): 22 (Extreme Fear)
Click to view real-time prices:
- View DFYN current price Market Price
- View ENJ current price Market Price
II. Key Factors Affecting the Investment Value of DFYN vs ENJ
Supply Mechanism Comparison (Tokenomics)
- DFYN: Maximum supply of 249,999,999 DFYN tokens, with a circulating supply of 105,652,279 DFYN
- ENJ: Capped supply of 1 billion ENJ tokens, with a deflationary mechanism where tokens are locked in digital assets
- 📌 Historical pattern: Deflationary mechanisms like ENJ's tend to create upward price pressure over time, while DFYN's larger available circulation may lead to greater price volatility.
Institutional Adoption and Market Applications
- Institutional holdings: ENJ has attracted more institutional interest due to its established position in the gaming NFT ecosystem
- Enterprise adoption: ENJ has stronger adoption in gaming and digital collectibles, while DFYN focuses on DeFi and cross-chain trading applications
- National policies: Both tokens face varying regulatory scrutiny across jurisdictions, with gaming-focused ENJ potentially facing less regulatory pressure than DeFi-oriented DFYN
Technical Development and Ecosystem Building
- DFYN technical upgrades: Focused on enhancing its AMM protocol and expanding cross-chain compatibility
- ENJ technical development: Development of Enjin Platform 2.0, Efinity parachain on Polkadot, and JumpNet for fee-less transactions
- Ecosystem comparison: ENJ has stronger adoption in gaming NFTs and digital assets, while DFYN offers more comprehensive DeFi services including swaps, farming, and cross-chain bridges
Macroeconomic and Market Cycles
- Performance in inflationary environments: ENJ's deflationary mechanism potentially provides better inflation resistance
- Macroeconomic monetary policy: Both tokens show sensitivity to broader crypto market trends influenced by interest rates and USD strength
- Geopolitical factors: ENJ's gaming focus may provide more insulation from cross-border transaction regulations that could impact DFYN's DeFi operations
III. 2025-2030 Price Prediction: DFYN vs ENJ
Short-term Prediction (2025)
- DFYN: Conservative $0.00223 - $0.00235 | Optimistic $0.00235 - $0.00280
- ENJ: Conservative $0.02420 - $0.03361 | Optimistic $0.03361 - $0.03832
Mid-term Prediction (2027)
- DFYN may enter a growth phase, with estimated prices ranging from $0.00200 to $0.00370
- ENJ may enter a bullish market, with estimated prices ranging from $0.02113 to $0.04998
- Key drivers: Institutional capital inflow, ETF, ecosystem development
Long-term Prediction (2030)
- DFYN: Base scenario $0.00288 - $0.00400 | Optimistic scenario $0.00400 - $0.00444
- ENJ: Base scenario $0.03311 - $0.06131 | Optimistic scenario $0.06131 - $0.06315
Disclaimer
DFYN:
| 年份 | 预测最高价 | 预测平均价格 | 预测最低价 | 涨跌幅 |
|---|---|---|---|---|
| 2025 | 0.0027965 | 0.00235 | 0.0022325 | 0 |
| 2026 | 0.00298497 | 0.00257325 | 0.00247032 | 9 |
| 2027 | 0.0036962163 | 0.00277911 | 0.0020009592 | 17 |
| 2028 | 0.0045651050415 | 0.00323766315 | 0.0029462734665 | 37 |
| 2029 | 0.004096453300537 | 0.00390138409575 | 0.002106747411705 | 65 |
| 2030 | 0.004438799754939 | 0.003998918698143 | 0.002879221462663 | 69 |
ENJ:
| 年份 | 预测最高价 | 预测平均价格 | 预测最低价 | 涨跌幅 |
|---|---|---|---|---|
| 2025 | 0.0383154 | 0.03361 | 0.0241992 | 0 |
| 2026 | 0.045313002 | 0.0359627 | 0.021937247 | 7 |
| 2027 | 0.04998455673 | 0.040637851 | 0.02113168252 | 21 |
| 2028 | 0.0661543576429 | 0.045311203865 | 0.036248963092 | 35 |
| 2029 | 0.06687933690474 | 0.05573278075395 | 0.032325012837291 | 66 |
| 2030 | 0.063145240594225 | 0.061306058829345 | 0.033105271767846 | 82 |
IV. Investment Strategy Comparison: DFYN vs ENJ
Long-term vs Short-term Investment Strategies
- DFYN: Suitable for investors focused on DeFi and cross-chain trading potential
- ENJ: Suitable for investors interested in gaming NFTs and digital asset ecosystems
Risk Management and Asset Allocation
- Conservative investors: DFYN 30% vs ENJ 70%
- Aggressive investors: DFYN 60% vs ENJ 40%
- Hedging tools: Stablecoin allocation, options, cross-token portfolio diversification
V. Potential Risk Comparison
Market Risk
- DFYN: Higher volatility due to larger circulating supply and DeFi market fluctuations
- ENJ: Vulnerability to gaming industry trends and overall NFT market sentiment
Technical Risk
- DFYN: Scalability issues, network stability across multiple chains
- ENJ: Smart contract vulnerabilities, blockchain interoperability challenges
Regulatory Risk
- Global regulatory policies may have differing impacts on DFYN's DeFi operations versus ENJ's gaming-focused ecosystem
VI. Conclusion: Which Is the Better Buy?
📌 Investment Value Summary:
- DFYN advantages: Multi-chain AMM capabilities, comprehensive DeFi services
- ENJ advantages: Established position in gaming NFTs, deflationary tokenomics
✅ Investment Advice:
- Novice investors: Consider a higher allocation to ENJ due to its more established market position
- Experienced investors: Balanced approach with exposure to both DFYN and ENJ based on risk tolerance
- Institutional investors: Strategic allocation to ENJ for gaming industry exposure, DFYN for DeFi sector participation
⚠️ Risk Warning: The cryptocurrency market is highly volatile. This article does not constitute investment advice. None
VII. FAQ
Q1: What are the main differences between DFYN and ENJ? A: DFYN is a multi-chain AMM DEX focused on DeFi and cross-chain trading, while ENJ is primarily used in gaming and NFT ecosystems. DFYN has a larger circulating supply, while ENJ has a deflationary mechanism.
Q2: Which token has performed better historically? A: ENJ has shown better historical performance, reaching an all-time high of $4.82 in November 2021, compared to DFYN's all-time high of $8.38 in May 2021. However, both have experienced significant declines since their peaks.
Q3: How do the supply mechanisms of DFYN and ENJ differ? A: DFYN has a maximum supply of 249,999,999 tokens with 105,652,279 in circulation. ENJ has a capped supply of 1 billion tokens with a deflationary mechanism where tokens are locked in digital assets.
Q4: Which token has attracted more institutional interest? A: ENJ has attracted more institutional interest due to its established position in the gaming NFT ecosystem.
Q5: What are the key technical developments for each token? A: DFYN is focused on enhancing its AMM protocol and expanding cross-chain compatibility. ENJ is developing Enjin Platform 2.0, Efinity parachain on Polkadot, and JumpNet for fee-less transactions.
Q6: How do the long-term price predictions for DFYN and ENJ compare? A: By 2030, DFYN's base scenario price range is predicted to be $0.00288 - $0.00400, while ENJ's base scenario range is $0.03311 - $0.06131.
Q7: What are the main risks associated with investing in DFYN and ENJ? A: DFYN faces higher volatility due to its larger circulating supply and DeFi market fluctuations. ENJ is vulnerable to gaming industry trends and overall NFT market sentiment. Both face regulatory risks, though potentially to different degrees.
Q8: Which token might be more suitable for different types of investors? A: Novice investors might consider a higher allocation to ENJ due to its more established market position. Experienced investors could take a balanced approach with exposure to both tokens. Institutional investors might strategically allocate to ENJ for gaming industry exposure and DFYN for DeFi sector participation.
Share
Content
Introduction: DFYN vs ENJ Investment Comparison
I. Price History Comparison and Current Market Status
II. Key Factors Affecting the Investment Value of DFYN vs ENJ
III. 2025-2030 Price Prediction: DFYN vs ENJ
IV. Investment Strategy Comparison: DFYN vs ENJ
V. Potential Risk Comparison
VI. Conclusion: Which Is the Better Buy?
VII. FAQ

