BXC vs XTZ: A Comparative Analysis of Two Emerging Cryptocurrencies in the Digital Asset Market
Introduction: BXC vs XTZ Investment Comparison
In the cryptocurrency market, the comparison between BonusCloud (BXC) and Tezos (XTZ) has been an unavoidable topic for investors. The two not only show significant differences in market cap ranking, application scenarios, and price performance, but also represent different positions in the crypto asset landscape.
BonusCloud (BXC): Since its launch, it has gained market recognition for its focus on building a decentralized infrastructure platform combining blockchain and cloud computing technologies.
Tezos (XTZ): Introduced in 2017, it has been hailed as a self-amending cryptographic ledger, representing one of the more innovative approaches to blockchain governance and upgradability.
This article will provide a comprehensive analysis of the investment value comparison between BXC and XTZ, focusing on historical price trends, supply mechanisms, institutional adoption, technological ecosystems, and future predictions, attempting to answer the question most crucial to investors:
"Which is the better buy right now?"
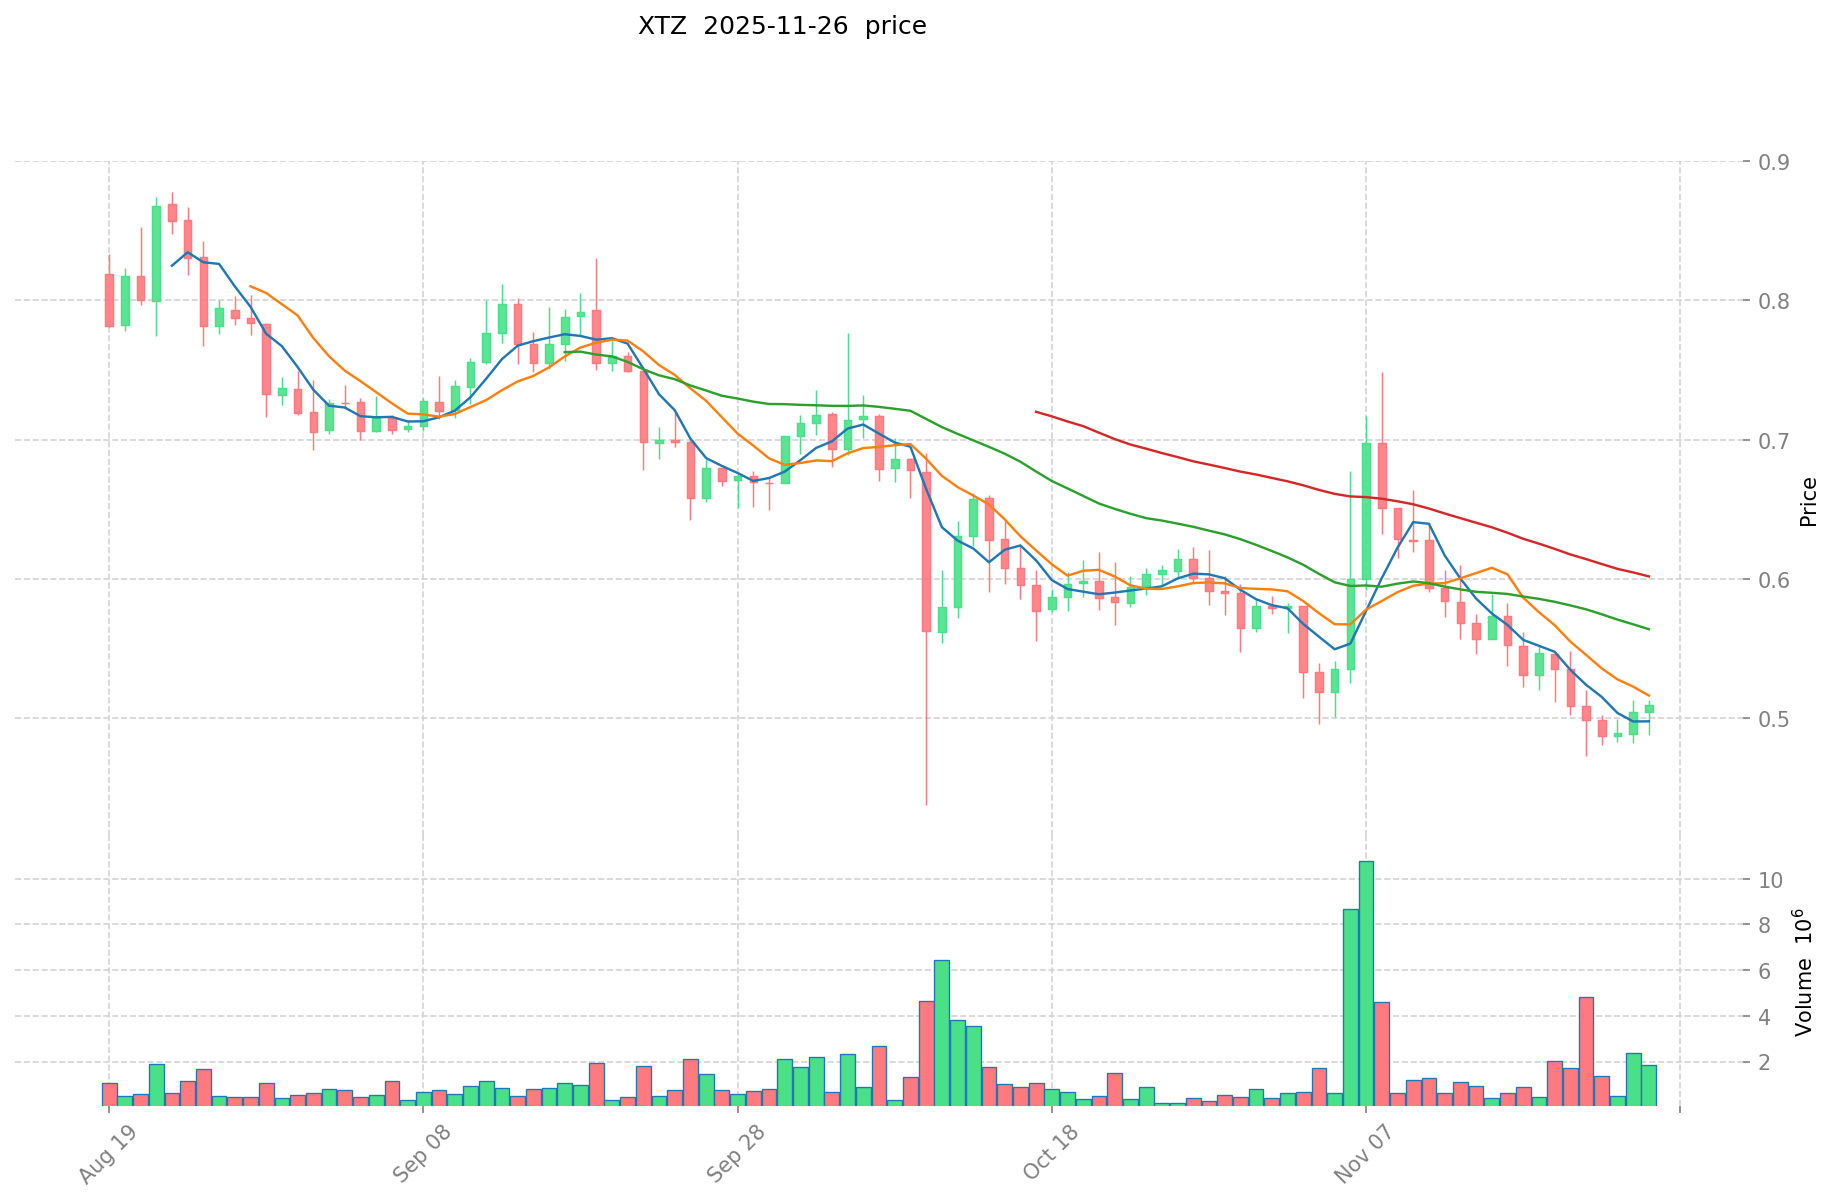
I. Price History Comparison and Current Market Status
BXC and XTZ Historical Price Trends
- 2021: XTZ reached its all-time high of $9.12 on October 4, 2021, likely due to overall market bullishness.
- 2018: XTZ hit its all-time low of $0.350476 on December 7, 2018, during the crypto winter.
- Comparative analysis: Since their respective all-time highs, BXC has fallen from $0.0041906 to $0.00015262, while XTZ has dropped from $9.12 to $0.509.
Current Market Situation (2025-11-27)
- BXC current price: $0.00015262
- XTZ current price: $0.509
- 24-hour trading volume: BXC $12,030.04 vs XTZ $1,277,835.83
- Market Sentiment Index (Fear & Greed Index): 20 (Extreme Fear)
Click to view real-time prices:
- View BXC current price Market Price
- View XTZ current price Market Price

II. Core Factors Affecting BXC vs XTZ Investment Value
Supply Mechanism Comparison (Tokenomics)
- BXC: Unknown supply mechanism (insufficient data)
- XTZ (Tezos): Inflationary model with no maximum supply cap; new XTZ are created through baking (staking) rewards
- 📌 Historical Pattern: Without sufficient historical data for BXC, it's difficult to establish reliable patterns. XTZ's inflation model has historically created a steady but modest price trajectory without the volatility spikes seen in fixed-supply assets.
Institutional Adoption and Market Applications
- Institutional Holdings: XTZ has gained some institutional adoption with Coinbase Custody and other institutional services supporting Tezos, while BXC lacks significant documented institutional interest
- Enterprise Adoption: XTZ has partnerships with companies like BTG Pactual and numerous NFT platforms, while BXC enterprise applications remain undocumented
- Regulatory Stance: XTZ is generally regarded as a utility token in most jurisdictions; BXC's regulatory status is unclear across different countries
Technical Development and Ecosystem Building
- XTZ Technical Development: Regular protocol upgrades through on-chain governance; focus on formal verification for enhanced security; energy-efficient Liquid Proof-of-Stake consensus
- Ecosystem Comparison: Tezos has an established ecosystem across DeFi (Plenty, Youves), NFTs (Objkt, fx(hash)), and enterprise applications with significant developer activity, while BXC ecosystem information is limited
Macroeconomic Factors and Market Cycles
- Performance During Inflation: XTZ has not demonstrated strong anti-inflation characteristics historically compared to more established crypto assets
- Macroeconomic Monetary Policy: Both assets follow broader crypto market trends in relation to interest rates and USD strength, though XTZ shows higher correlation with overall market movements
- Geopolitical Factors: XTZ has global distribution and usage, potentially offering utility in cross-border transactions and in regions with currency instability
III. 2025-2030 Price Prediction: BXC vs XTZ
Short-term Prediction (2025)
- BXC: Conservative $0.0001184916 - $0.00015591 | Optimistic $0.00015591 - $0.0001886511
- XTZ: Conservative $0.48816 - $0.5085 | Optimistic $0.5085 - $0.56952
Mid-term Prediction (2027)
- BXC may enter a growth phase, with expected price range $0.000165363485917 - $0.000259273613722
- XTZ may enter a growth phase, with expected price range $0.3990021525 - $0.8803380825
- Key drivers: Institutional capital inflow, ETF, ecosystem development
Long-term Prediction (2030)
- BXC: Base scenario $0.00028995989634 - $0.000310257089084 | Optimistic scenario $0.000310257089084+
- XTZ: Base scenario $0.992592271411875 - $1.1117033439813 | Optimistic scenario $1.1117033439813+
Disclaimer: This analysis is based on historical data and market projections. Cryptocurrency markets are highly volatile and unpredictable. This information should not be considered as financial advice. Always conduct your own research before making investment decisions.
BXC:
| 年份 | 预测最高价 | 预测平均价格 | 预测最低价 | 涨跌幅 |
|---|---|---|---|---|
| 2025 | 0.0001886511 | 0.00015591 | 0.0001184916 | 2 |
| 2026 | 0.0002360243535 | 0.00017228055 | 0.000089585886 | 12 |
| 2027 | 0.000259273613722 | 0.00020415245175 | 0.000165363485917 | 33 |
| 2028 | 0.000312812594194 | 0.000231713032736 | 0.000125125037677 | 51 |
| 2029 | 0.000307656979215 | 0.000272262813465 | 0.000174248200617 | 78 |
| 2030 | 0.000310257089084 | 0.00028995989634 | 0.000147879547133 | 89 |
XTZ:
| 年份 | 预测最高价 | 预测平均价格 | 预测最低价 | 涨跌幅 |
|---|---|---|---|---|
| 2025 | 0.56952 | 0.5085 | 0.48816 | 0 |
| 2026 | 0.7276635 | 0.53901 | 0.5174496 | 5 |
| 2027 | 0.8803380825 | 0.63333675 | 0.3990021525 | 24 |
| 2028 | 1.0898458794 | 0.75683741625 | 0.4313973272625 | 48 |
| 2029 | 1.06184289499875 | 0.923341647825 | 0.69250623586875 | 81 |
| 2030 | 1.1117033439813 | 0.992592271411875 | 0.625333130989481 | 94 |
IV. Investment Strategy Comparison: BXC vs XTZ
Long-term vs Short-term Investment Strategies
- BXC: Suitable for investors focused on cloud computing and decentralized infrastructure potential
- XTZ: Suitable for investors seeking governance participation and ecosystem growth
Risk Management and Asset Allocation
- Conservative investors: BXC: 10% vs XTZ: 90%
- Aggressive investors: BXC: 30% vs XTZ: 70%
- Hedging tools: Stablecoin allocation, options, cross-currency portfolios
V. Potential Risk Comparison
Market Risks
- BXC: Limited market data and trading volume may lead to high volatility
- XTZ: Subject to broader cryptocurrency market trends and sentiment shifts
Technical Risks
- BXC: Scalability, network stability
- XTZ: Smart contract vulnerabilities, potential governance disputes
Regulatory Risks
- Global regulatory policies may impact both assets differently, with XTZ having more established regulatory recognition
VI. Conclusion: Which Is the Better Buy?
📌 Investment Value Summary:
- BXC advantages: Focus on decentralized cloud computing infrastructure
- XTZ advantages: Established ecosystem, on-chain governance, institutional adoption
✅ Investment Advice:
- Novice investors: Consider XTZ for its more established market presence and ecosystem
- Experienced investors: Diversify between XTZ and BXC, with a larger allocation to XTZ
- Institutional investors: Focus primarily on XTZ due to its regulatory clarity and institutional support
⚠️ Risk Warning: Cryptocurrency markets are highly volatile. This article does not constitute investment advice. None
VII. FAQ
Q1: What are the main differences between BXC and XTZ in terms of their focus and technology? A: BXC focuses on building a decentralized infrastructure platform combining blockchain and cloud computing technologies. XTZ, on the other hand, is known for its self-amending cryptographic ledger, emphasizing innovative blockchain governance and upgradability.
Q2: How do the current market situations of BXC and XTZ compare? A: As of 2025-11-27, BXC's price is $0.00015262 with a 24-hour trading volume of $12,030.04. XTZ's price is $0.509 with a 24-hour trading volume of $1,277,835.83. The market sentiment index is at 20, indicating extreme fear.
Q3: What are the key factors affecting the investment value of BXC and XTZ? A: Key factors include supply mechanisms, institutional adoption, technical development, ecosystem building, and macroeconomic factors. XTZ has a more established ecosystem, institutional adoption, and clear tokenomics, while BXC's data in these areas is limited.
Q4: How do the price predictions for BXC and XTZ compare for 2030? A: For BXC, the base scenario predicts a range of $0.00028995989634 - $0.000310257089084. For XTZ, the base scenario predicts a range of $0.992592271411875 - $1.1117033439813. Both have potential for higher prices in optimistic scenarios.
Q5: What are the main risks associated with investing in BXC and XTZ? A: Both face market risks related to cryptocurrency volatility. BXC has additional risks due to limited market data and trading volume. XTZ faces potential smart contract vulnerabilities and governance disputes. Both are subject to evolving regulatory risks.
Q6: Which asset is considered more suitable for different types of investors? A: XTZ is generally considered more suitable for novice and institutional investors due to its established ecosystem and regulatory clarity. BXC might be of interest to experienced investors looking for exposure to decentralized cloud computing infrastructure. A diversified approach is recommended for experienced investors.
Q7: How do the long-term investment strategies differ for BXC and XTZ? A: BXC is suitable for investors focused on cloud computing and decentralized infrastructure potential. XTZ is more appropriate for those seeking governance participation and ecosystem growth. Conservative investors might allocate 10% to BXC and 90% to XTZ, while aggressive investors might consider a 30% BXC to 70% XTZ ratio.
Share
Content
Introduction: BXC vs XTZ Investment Comparison
I. Price History Comparison and Current Market Status
II. Core Factors Affecting BXC vs XTZ Investment Value
III. 2025-2030 Price Prediction: BXC vs XTZ
IV. Investment Strategy Comparison: BXC vs XTZ
V. Potential Risk Comparison
VI. Conclusion: Which Is the Better Buy?
VII. FAQ

