BSCS vs APT: Comparing Two Approaches to Software Development in the Modern Era
Introduction: BSCS vs APT Investment Comparison
In the cryptocurrency market, the comparison between BSCS and APT has been an unavoidable topic for investors. The two not only show significant differences in market cap ranking, application scenarios, and price performance but also represent different positioning in the crypto asset space.
BSCS (BSCS): Since its launch, it has gained market recognition for its all-in-one incubation hub with a full-stack DeFi platform across major blockchain networks.
Aptos (APT): Introduced as a high-performance PoS Layer 1 project, it aims to deliver a secure and scalable blockchain solution.
This article will provide a comprehensive analysis of the investment value comparison between BSCS and APT, focusing on historical price trends, supply mechanisms, institutional adoption, technological ecosystems, and future predictions, attempting to answer the question most crucial to investors:
"Which is the better buy right now?"
I. Price History Comparison and Current Market Status
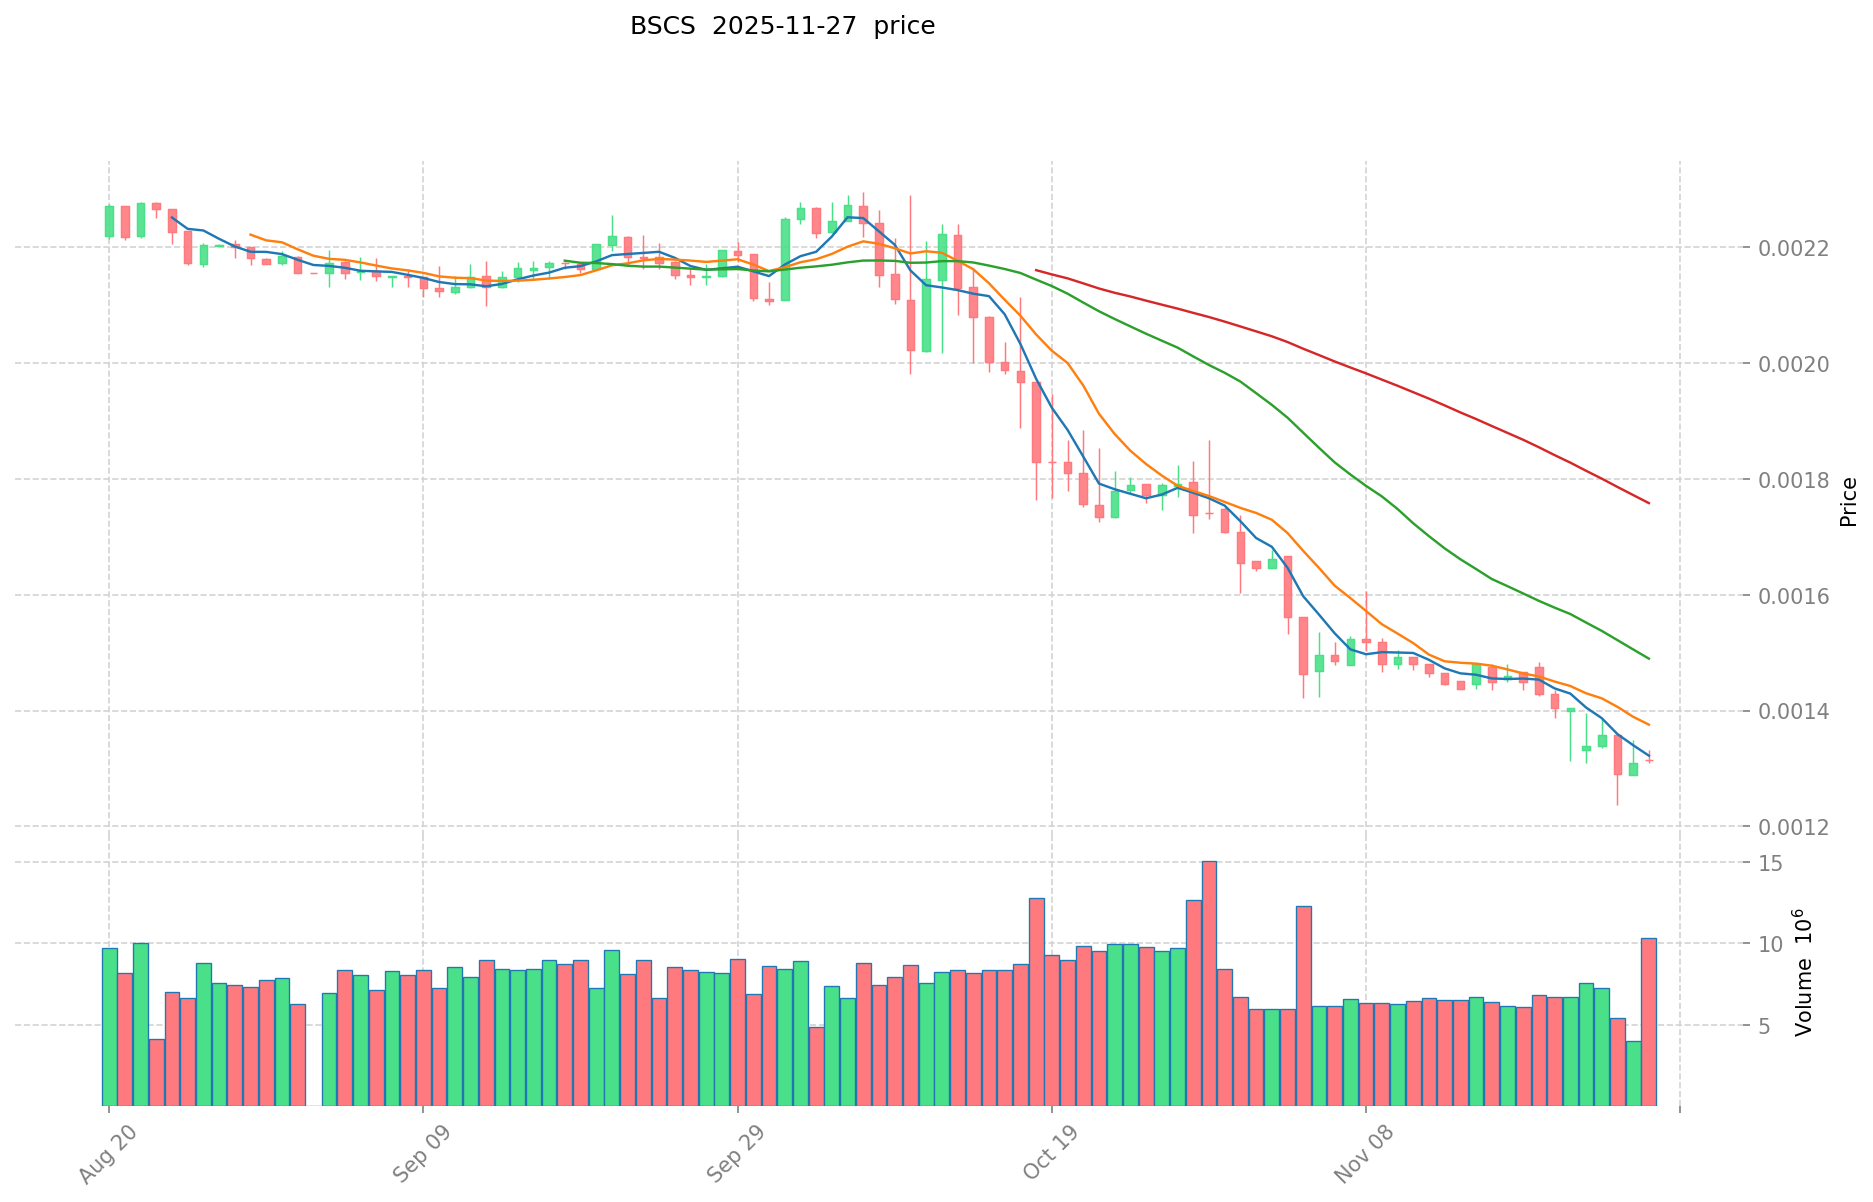
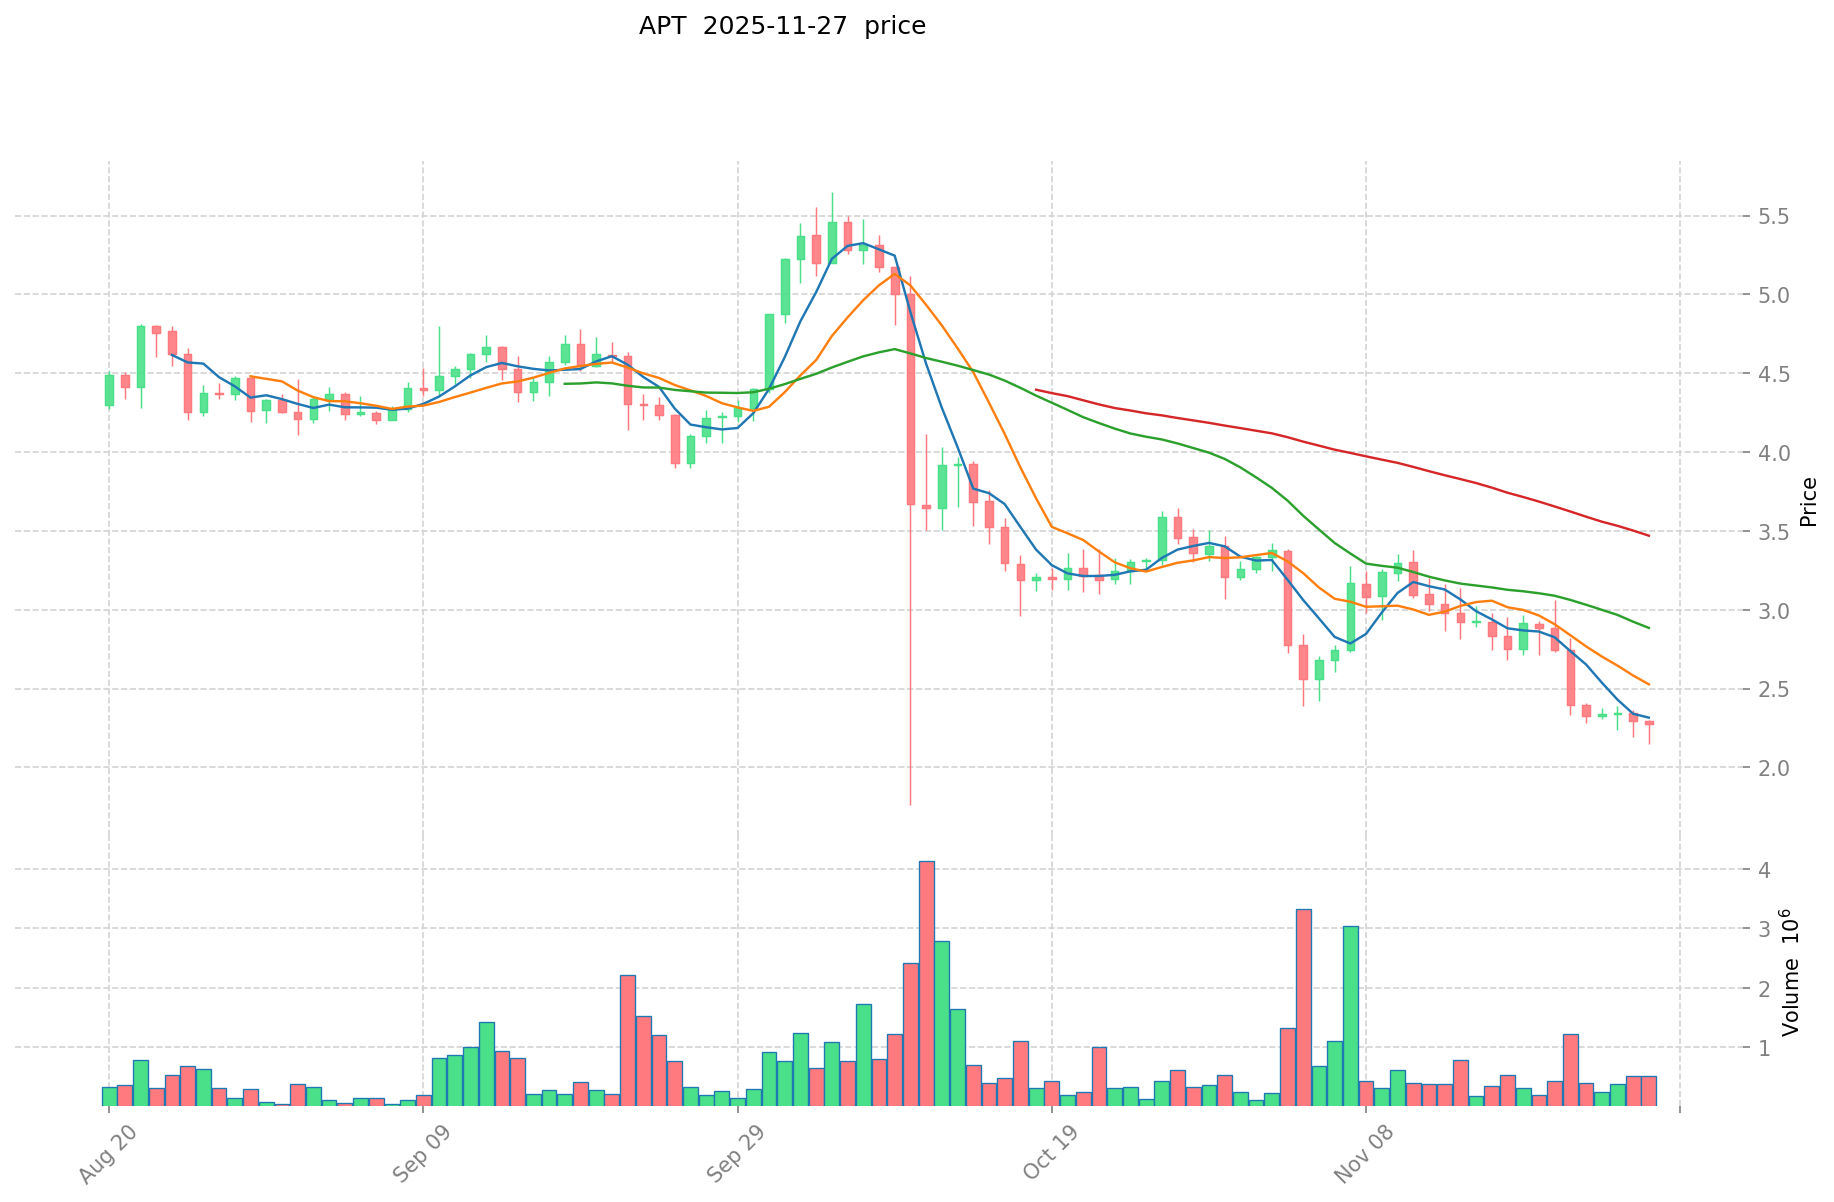
BSCS (Coin A) and APT (Coin B) Historical Price Trends
- 2021: BSCS reached its all-time high of $1.17 on May 3, 2021.
- 2023: APT reached its all-time high of $19.92 on January 26, 2023.
- Comparative analysis: BSCS has dropped from its all-time high of $1.17 to a current price of $0.001279, while APT has declined from its peak of $19.92 to $2.305.
Current Market Situation (2025-11-28)
- BSCS current price: $0.001279
- APT current price: $2.305
- 24-hour trading volume: BSCS $13,299.05 vs APT $783,282.97
- Market Sentiment Index (Fear & Greed Index): 22 (Extreme Fear)
Click to view real-time prices:
- Check BSCS current price Market Price
- Check APT current price Market Price
II. Core Factors Affecting the Investment Value of BSCS vs APT
Supply Mechanisms Comparison (Tokenomics)
- BSCS: Deflationary model with a maximum supply cap of 100 million tokens; features a burn mechanism that helps reduce supply over time
- APT: Total supply of 1 billion tokens, with distribution allocated to community (51.02%), core contributors (19%), Foundation (16.5%), and investors (13.48%)
- 📌 Historical pattern: Deflationary tokens like BSCS tend to create price pressure during supply contractions, while APT's larger but well-distributed supply promotes ecosystem growth through aligned incentives
Institutional Adoption and Market Applications
- Institutional holdings: APT has gained more institutional traction with backers including a16z, FTX Ventures, and Tiger Global
- Enterprise adoption: APT has stronger enterprise integration through the Move language, which enables secure smart contract deployment attractive to businesses; BSCS focuses more on DeFi applications
- Regulatory stance: Both projects operate in evolving regulatory environments, with APT potentially benefiting from its foundation-based governance structure during regulatory reviews
Technical Development and Ecosystem Building
- BSCS technical upgrades: Focus on Layer 2 solutions for scalability and enhanced DeFi functionality
- APT technical development: Implementing parallel execution engine that allows transaction processing of over 160,000 TPS; continuous improvements to the Move VM
- Ecosystem comparison: APT has a more diverse ecosystem spanning DeFi, NFTs, and gaming with over 1,200 active projects; BSCS maintains strength in decentralized exchange and yield farming applications
Macroeconomic Factors and Market Cycles
- Performance during inflation: Both assets remain largely correlated with broader crypto market trends during inflationary periods
- Macroeconomic monetary policy: Interest rate decisions impact both tokens similarly, with higher rates typically creating pressure on the entire digital asset sector
- Geopolitical factors: APT's foundation-backed structure may provide more stability during geopolitical uncertainty, while BSCS benefits from its decentralized governance approach
III. 2025-2030 Price Prediction: BSCS vs APT
Short-term Prediction (2025)
- BSCS: Conservative $0.00071624 - $0.001279 | Optimistic $0.001279 - $0.00162433
- APT: Conservative $1.5015 - $2.31 | Optimistic $2.31 - $2.6565
Mid-term Prediction (2027)
- BSCS may enter a growth phase, with prices expected in the range of $0.000910193955 - $0.002184465492
- APT may enter a consolidation phase, with prices expected in the range of $1.74274485 - $3.42539505
- Key drivers: Institutional fund inflows, ETF developments, ecosystem growth
Long-term Prediction (2030)
- BSCS: Base scenario $0.002868676491852 - $0.003528472084978 | Optimistic scenario $0.003528472084978+
- APT: Base scenario $3.048965542724062 - $4.06528739029875 | Optimistic scenario $4.268551759813687+
Disclaimer: The above predictions are based on historical data and market analysis. Cryptocurrency markets are highly volatile and subject to rapid changes. These projections should not be considered as financial advice or guarantees of future performance.
BSCS:
| 年份 | 预测最高价 | 预测平均价格 | 预测最低价 | 涨跌幅 |
|---|---|---|---|---|
| 2025 | 0.00162433 | 0.001279 | 0.00071624 | 0 |
| 2026 | 0.0018581312 | 0.001451665 | 0.0010742321 | 13 |
| 2027 | 0.002184465492 | 0.0016548981 | 0.000910193955 | 29 |
| 2028 | 0.00272594815032 | 0.001919681796 | 0.00128618680332 | 50 |
| 2029 | 0.003414538010545 | 0.00232281497316 | 0.001440145283359 | 81 |
| 2030 | 0.003528472084978 | 0.002868676491852 | 0.002696555902341 | 124 |
APT:
| 年份 | 预测最高价 | 预测平均价格 | 预测最低价 | 涨跌幅 |
|---|---|---|---|---|
| 2025 | 2.6565 | 2.31 | 1.5015 | 0 |
| 2026 | 3.526215 | 2.48325 | 1.3657875 | 7 |
| 2027 | 3.42539505 | 3.0047325 | 1.74274485 | 30 |
| 2028 | 4.5653905605 | 3.215063775 | 2.15409272925 | 39 |
| 2029 | 4.2403476128475 | 3.89022716775 | 3.6957158093625 | 68 |
| 2030 | 4.268551759813687 | 4.06528739029875 | 3.048965542724062 | 76 |
IV. Investment Strategy Comparison: BSCS vs APT
Long-term vs Short-term Investment Strategies
- BSCS: Suitable for investors focused on DeFi ecosystems and deflationary tokenomics
- APT: Suitable for investors looking for Layer 1 blockchain potential and institutional backing
Risk Management and Asset Allocation
- Conservative investors: BSCS: 20% vs APT: 80%
- Aggressive investors: BSCS: 40% vs APT: 60%
- Hedging tools: Stablecoin allocation, options, cross-currency portfolios
V. Potential Risk Comparison
Market Risk
- BSCS: Higher volatility due to smaller market cap and lower liquidity
- APT: Susceptible to broader Layer 1 competition and market sentiment shifts
Technical Risk
- BSCS: Scalability challenges, network stability across multiple chains
- APT: Potential security vulnerabilities in Move language, network congestion during high demand
Regulatory Risk
- Global regulatory policies may impact both, with APT potentially facing more scrutiny due to its foundation structure
VI. Conclusion: Which Is the Better Buy?
📌 Investment Value Summary:
- BSCS advantages: Deflationary model, focus on DeFi applications, potential for higher returns in bull markets
- APT advantages: Strong institutional backing, scalable Layer 1 technology, diverse ecosystem
✅ Investment Advice:
- New investors: Consider a higher allocation to APT for its stronger market position and institutional support
- Experienced investors: Balanced approach with both BSCS and APT, leveraging BSCS for higher risk-reward potential
- Institutional investors: Focus on APT for its scalability and broader ecosystem, with potential for enterprise adoption
⚠️ Risk Warning: The cryptocurrency market is highly volatile. This article does not constitute investment advice. None
VII. FAQ
Q1: What are the key differences between BSCS and APT? A: BSCS is a deflationary token focused on DeFi applications with a maximum supply of 100 million tokens. APT is a Layer 1 blockchain with a total supply of 1 billion tokens, offering broader ecosystem support including DeFi, NFTs, and gaming.
Q2: Which token has shown better price performance historically? A: APT has shown better historical price performance. It reached its all-time high of $19.92 in January 2023, while BSCS peaked at $1.17 in May 2021. Currently, APT trades at $2.305, whereas BSCS is at $0.001279.
Q3: How do the supply mechanisms of BSCS and APT differ? A: BSCS employs a deflationary model with a burn mechanism that reduces supply over time. APT has a fixed supply of 1 billion tokens distributed among the community, core contributors, Foundation, and investors.
Q4: Which token has stronger institutional backing? A: APT has garnered more institutional support, with backers including a16z, FTX Ventures, and Tiger Global. This gives APT an advantage in terms of potential enterprise adoption and market stability.
Q5: What are the main risks associated with investing in BSCS and APT? A: BSCS faces higher volatility due to its smaller market cap and lower liquidity. APT is susceptible to Layer 1 competition and potential security vulnerabilities in its Move language. Both tokens are subject to regulatory risks and overall market sentiment.
Q6: How do the future price predictions compare for BSCS and APT? A: By 2030, BSCS is predicted to reach $0.002868676491852 - $0.003528472084978 in the base scenario, while APT is expected to reach $3.048965542724062 - $4.06528739029875. Both have potential for higher prices in optimistic scenarios.
Q7: Which token is recommended for different types of investors? A: New investors may consider a higher allocation to APT for its stronger market position. Experienced investors could adopt a balanced approach with both tokens. Institutional investors might focus on APT for its scalability and broader ecosystem potential.
Share
Content
Introduction: BSCS vs APT Investment Comparison
I. Price History Comparison and Current Market Status
II. Core Factors Affecting the Investment Value of BSCS vs APT
III. 2025-2030 Price Prediction: BSCS vs APT
IV. Investment Strategy Comparison: BSCS vs APT
V. Potential Risk Comparison
VI. Conclusion: Which Is the Better Buy?
VII. FAQ

