This article offers a comparative analysis of Blocery (BLY) and NEAR Protocol (NEAR) as blockchain platforms for decentralized application development. Focusing on historical price trends, tokenomics, institutional adoption, and ecosystem growth, it guides investors on choosing between BLY's deflationary model and DeFi focus versus NEAR's scalability and institutional backing. The content caters to both novice and experienced investors seeking insights on market value, risk management, and future price predictions. Stay informed on real-time market performance with links to Gate for the latest prices.
Introduction: BLY vs NEAR Investment Comparison
In the cryptocurrency market, the comparison between Blocery (BLY) vs NEAR (NEAR) has always been an unavoidable topic for investors. The two not only have significant differences in market cap ranking, application scenarios, and price performance, but also represent different positions in crypto assets.
Blocery (BLY): Since its launch, it has gained market recognition for its focus on agricultural food supply chain management on the blockchain.
NEAR (NEAR): Since its inception, it has been hailed as a highly scalable protocol for supporting DApps on mobile devices, becoming one of the cryptocurrencies with significant global trading volume and market capitalization.
This article will provide a comprehensive analysis of the investment value comparison between BLY vs NEAR, focusing on historical price trends, supply mechanisms, institutional adoption, technological ecosystems, and future predictions, attempting to answer the question investors are most concerned about:
"Which is the better buy right now?"
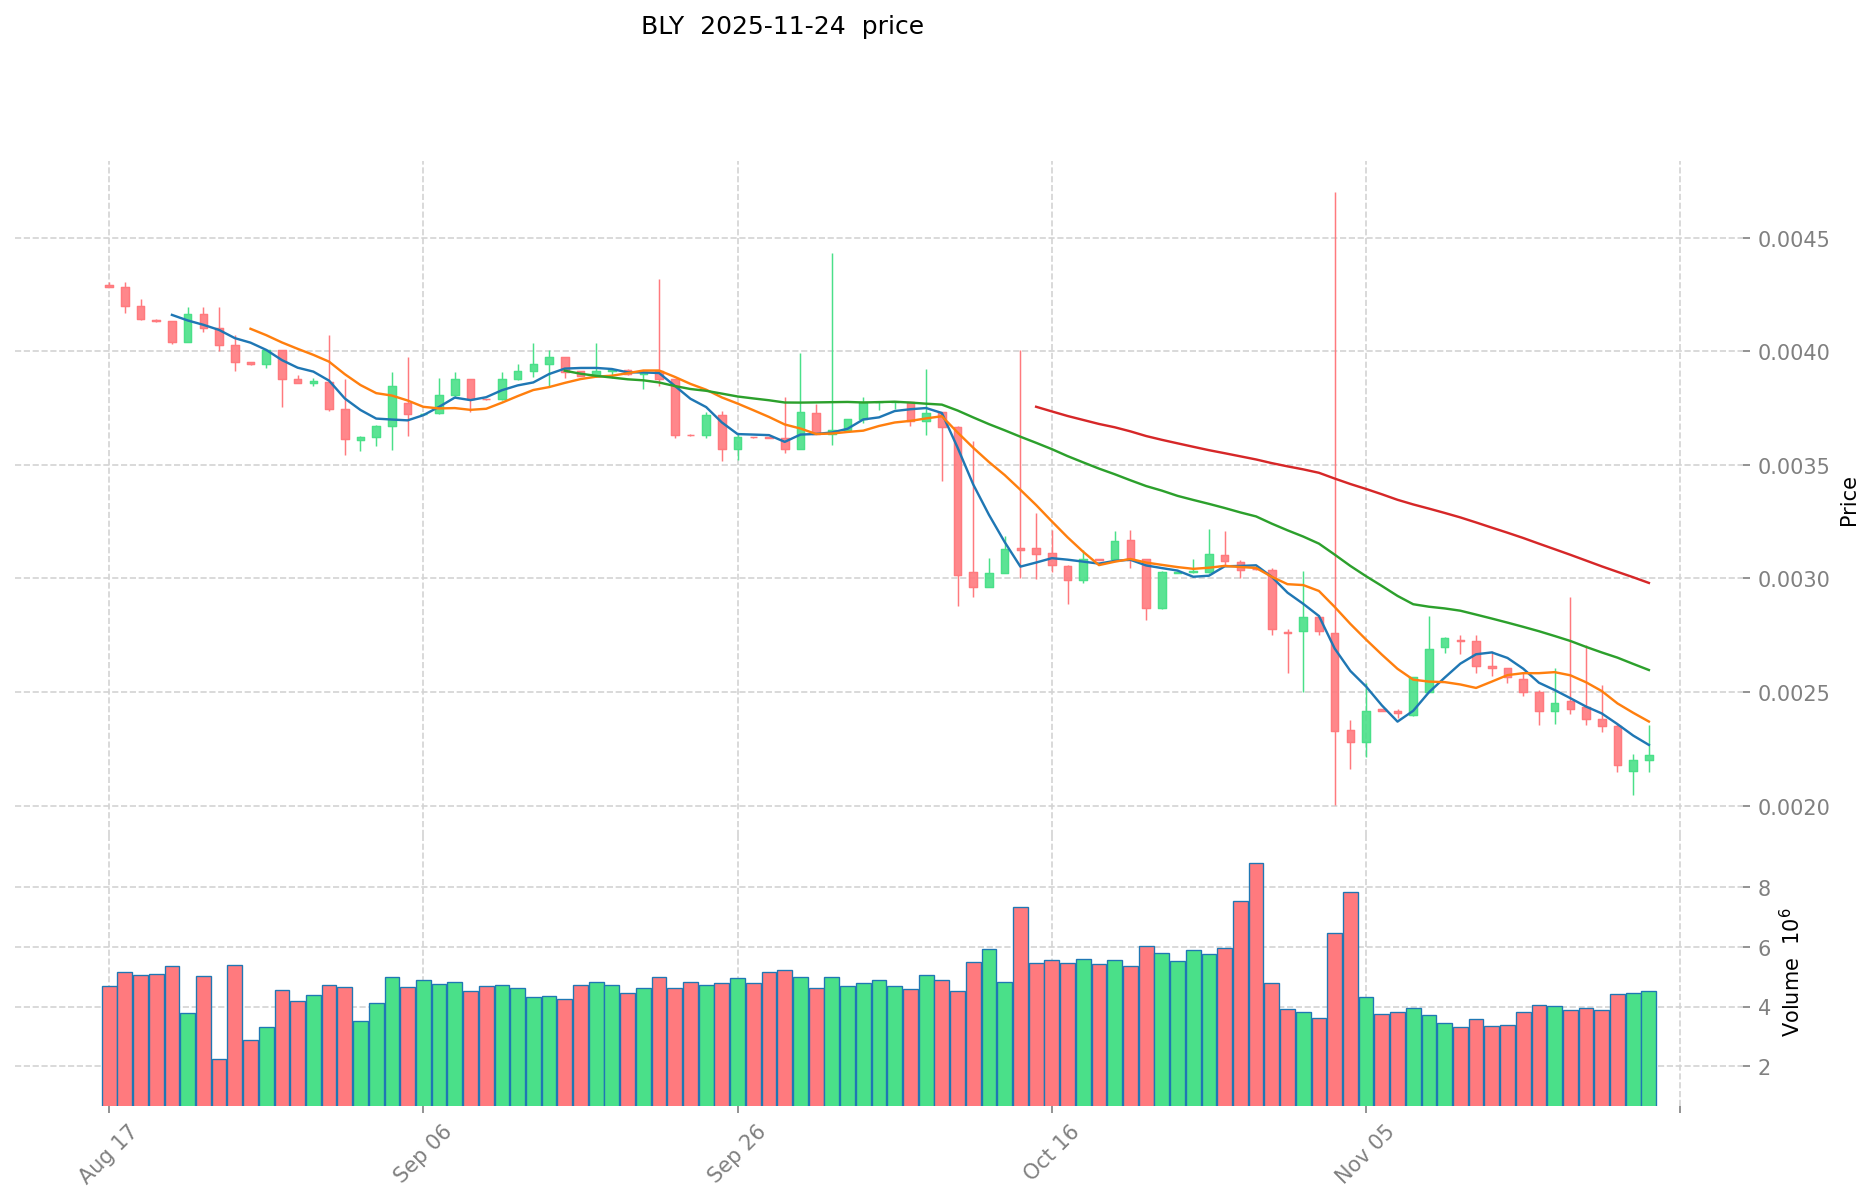
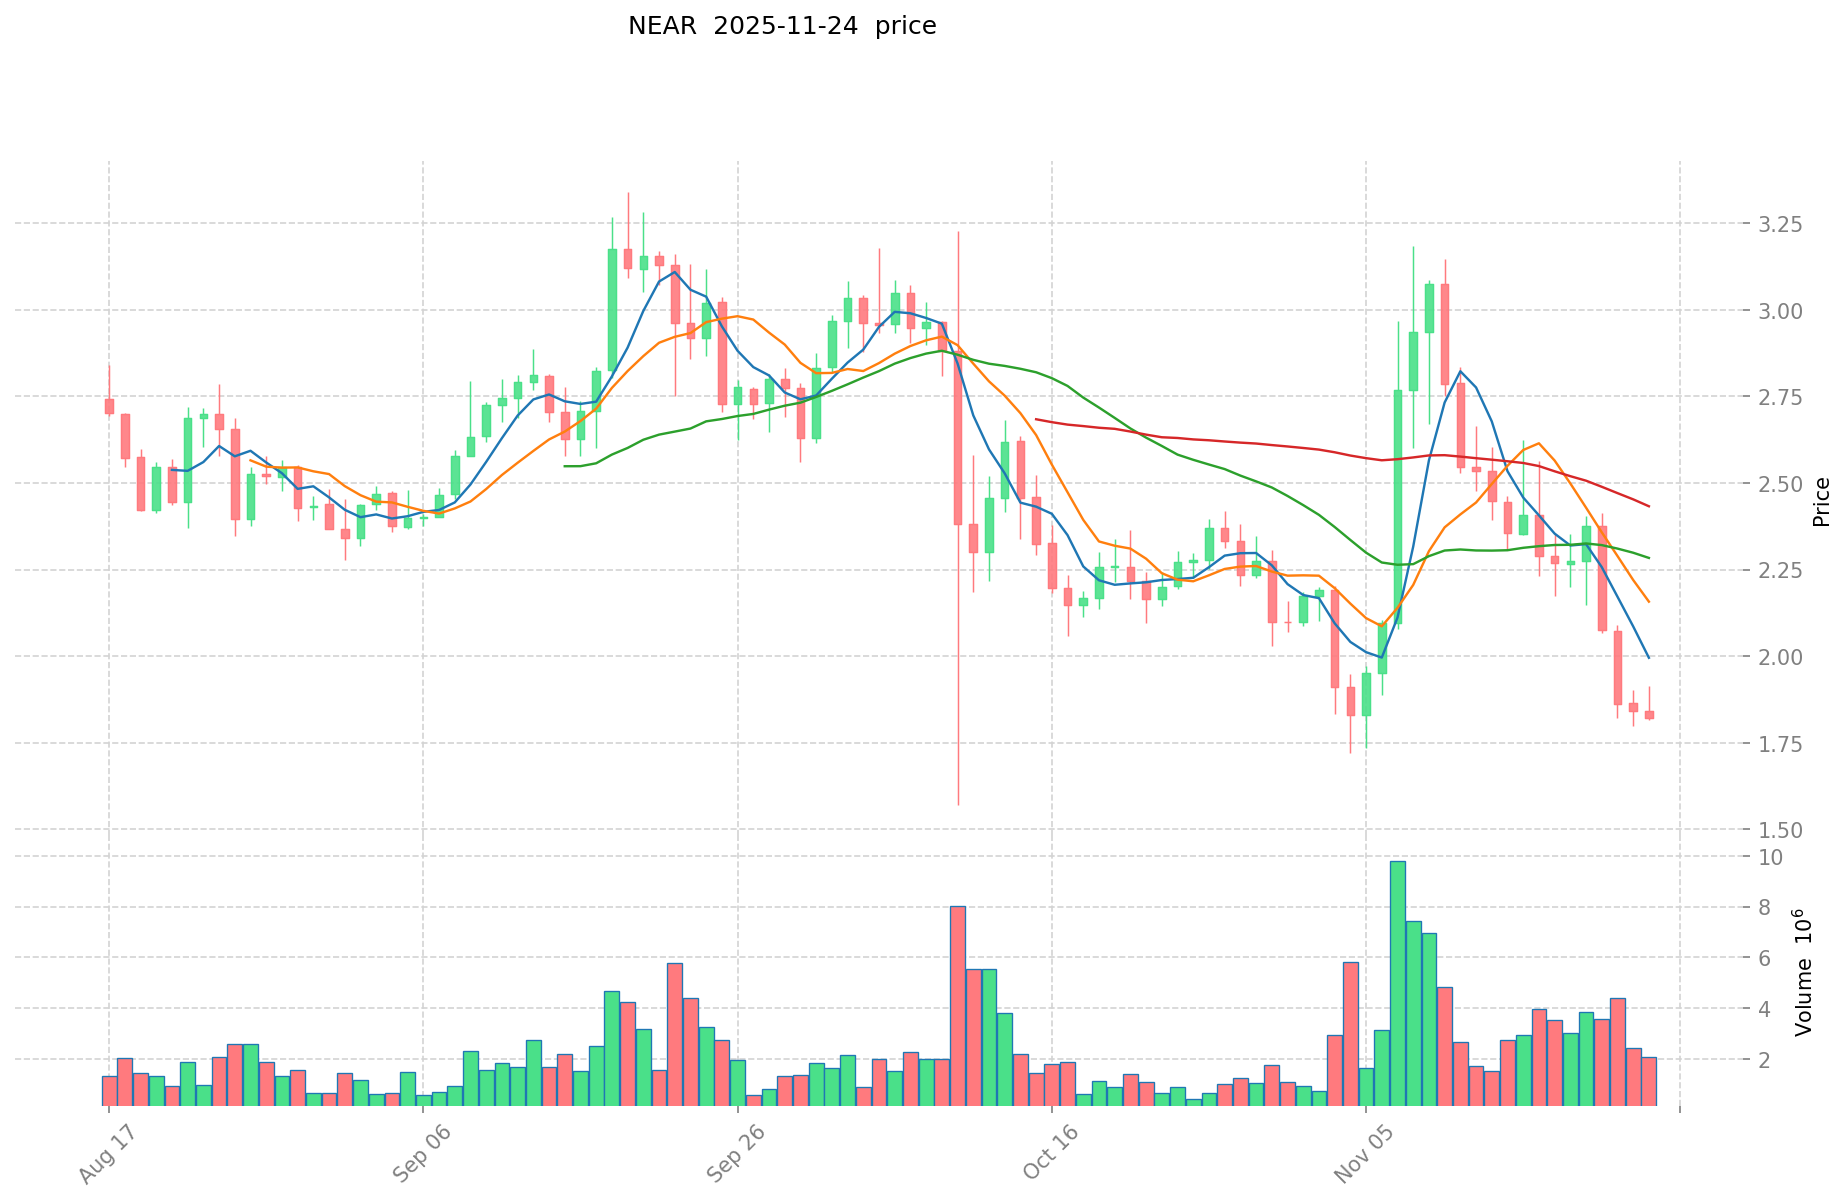
I. Price History Comparison and Current Market Status
BLY and NEAR Historical Price Trends
- 2021: BLY reached its all-time high of $0.724004 on April 5, 2021.
- 2022: NEAR hit its all-time high of $20.44 on January 17, 2022.
- Comparative analysis: During market cycles, BLY dropped from its high of $0.724004 to a low of $0.0010071, while NEAR declined from $20.44 to $0.526762.
Current Market Situation (2025-11-24)
- BLY current price: $0.00219
- NEAR current price: $1.852
- 24-hour trading volume: BLY $10,443.24 vs NEAR $4,172,116.37
- Market Sentiment Index (Fear & Greed Index): 19 (Extreme Fear)
Click to view real-time prices:
- View BLY current price Market Price
- View NEAR current price Market Price
II. Core Factors Affecting Investment Value of BLY vs NEAR
Supply Mechanisms Comparison (Tokenomics)
-
BLY: Limited supply of 13.7 billion tokens, with 50% allocated to mining rewards that decrease over time, creating a deflationary model as mining difficulty increases
-
NEAR: Total supply of 1 billion tokens with inflationary model - 5% annual inflation with 90% distributed to validators and 10% to the treasury
-
📌 Historical Pattern: Deflationary models like BLY's tend to support price appreciation during bull markets, while NEAR's moderate inflation balances network security with long-term value.
Institutional Adoption and Market Applications
- Institutional Holdings: NEAR has attracted more institutional interest, with prominent backers like a16z, Coinbase Ventures, and Dragonfly Capital
- Enterprise Adoption: NEAR leads with enterprise applications through partnerships with Sweatcoin and AURORA, while BLY focuses on community-driven financial applications
- Regulatory Attitudes: Both projects face similar regulatory scrutiny, though NEAR's established foundation provides more regulatory clarity compared to BLY's newer presence
Technical Development and Ecosystem Building
- BLY Technical Upgrades: Recent launch of BLY DEX with improved liquidity pools and yield farming capabilities
- NEAR Technical Development: Implemented Nightshade sharding for higher throughput and launched NEAR Rainbow Bridge for Ethereum interoperability
- Ecosystem Comparison: NEAR has a more developed ecosystem with 800+ projects spanning DeFi, NFTs, and gaming, while BLY's ecosystem is growing but currently more focused on DeFi applications
Macroeconomic and Market Cycles
- Performance During Inflation: NEAR's stability mechanisms may provide better short-term inflation protection, while BLY's deflationary model offers potential long-term value preservation
- Monetary Policy Impact: Both tokens show sensitivity to interest rate changes, with BLY potentially more volatile during policy shifts
- Geopolitical Factors: NEAR's broader institutional backing may provide more stability during geopolitical uncertainty, while BLY's decentralized community governance could appeal during periods of institutional distrust
III. 2025-2030 Price Prediction: BLY vs NEAR
Short-term Prediction (2025)
- BLY: Conservative $0.00200744 - $0.002182 | Optimistic $0.002182 - $0.0025093
- NEAR: Conservative $1.22628 - $1.858 | Optimistic $1.858 - $2.0438
Mid-term Prediction (2027)
- BLY may enter a growth phase, with an estimated price range of $0.00282134782 - $0.00343215508
- NEAR may enter a consolidation phase, with an estimated price range of $1.38611445 - $2.33659293
- Key drivers: Institutional capital inflow, ETF, ecosystem development
Long-term Prediction (2030)
- BLY: Base scenario $0.004385270362928 - $0.00482379739922 | Optimistic scenario $0.00482379739922+
- NEAR: Base scenario $3.1203673854255 - $3.588422493239325 | Optimistic scenario $3.588422493239325+
View detailed price predictions for BLY and NEAR
Disclaimer
BLY:
| 年份 |
预测最高价 |
预测平均价格 |
预测最低价 |
涨跌幅 |
| 2025 |
0.0025093 |
0.002182 |
0.00200744 |
0 |
| 2026 |
0.003471562 |
0.00234565 |
0.00140739 |
7 |
| 2027 |
0.00343215508 |
0.002908606 |
0.00282134782 |
32 |
| 2028 |
0.0039312718696 |
0.00317038054 |
0.0017120054916 |
44 |
| 2029 |
0.005219714521056 |
0.0035508262048 |
0.002982694012032 |
62 |
| 2030 |
0.00482379739922 |
0.004385270362928 |
0.002762720328644 |
100 |
NEAR:
| 年份 |
预测最高价 |
预测平均价格 |
预测最低价 |
涨跌幅 |
| 2025 |
2.0438 |
1.858 |
1.22628 |
0 |
| 2026 |
2.009427 |
1.9509 |
1.638756 |
5 |
| 2027 |
2.33659293 |
1.9801635 |
1.38611445 |
6 |
| 2028 |
3.1080646296 |
2.158378215 |
1.53244853265 |
16 |
| 2029 |
3.607513348551 |
2.6332214223 |
2.422563708516 |
42 |
| 2030 |
3.588422493239325 |
3.1203673854255 |
2.402682886777635 |
68 |
IV. Investment Strategy Comparison: BLY vs NEAR
Long-term vs Short-term Investment Strategy
- BLY: Suitable for investors focused on deflationary tokenomics and DeFi potential
- NEAR: Suitable for investors seeking ecosystem growth and institutional backing
Risk Management and Asset Allocation
- Conservative investors: BLY: 20% vs NEAR: 80%
- Aggressive investors: BLY: 40% vs NEAR: 60%
- Hedging tools: Stablecoin allocation, options, cross-currency portfolios
V. Potential Risk Comparison
Market Risk
- BLY: Higher volatility due to lower market cap and trading volume
- NEAR: Exposure to broader market trends and competition from other Layer 1 protocols
Technical Risk
- BLY: Scalability, network stability
- NEAR: Centralization concerns, potential security vulnerabilities
Regulatory Risk
- Global regulatory policies may have different impacts on both, with NEAR potentially facing more scrutiny due to its larger scale and institutional involvement
VI. Conclusion: Which Is the Better Buy?
📌 Investment Value Summary:
- BLY advantages: Deflationary model, focus on DeFi applications, potential for higher growth from a lower market cap
- NEAR advantages: Established ecosystem, institutional backing, scalable infrastructure for DApps
✅ Investment Advice:
- Novice investors: Consider a higher allocation to NEAR for its established presence and lower volatility
- Experienced investors: Balanced approach with exposure to both, leveraging BLY's growth potential and NEAR's stability
- Institutional investors: NEAR may be more suitable due to its liquidity and ecosystem development
⚠️ Risk Warning: The cryptocurrency market is highly volatile. This article does not constitute investment advice.
None
VII. FAQ
Q1: What are the main differences between BLY and NEAR in terms of supply mechanisms?
A: BLY has a limited supply of 13.7 billion tokens with a deflationary model, while NEAR has a total supply of 1 billion tokens with an inflationary model of 5% annual inflation.
Q2: How do BLY and NEAR compare in terms of institutional adoption?
A: NEAR has attracted more institutional interest with backers like a16z and Coinbase Ventures, while BLY focuses more on community-driven financial applications.
Q3: What are the key technical developments for each project?
A: BLY recently launched a DEX with improved liquidity pools and yield farming. NEAR implemented Nightshade sharding for higher throughput and launched the NEAR Rainbow Bridge for Ethereum interoperability.
Q4: How do the ecosystems of BLY and NEAR compare?
A: NEAR has a more developed ecosystem with 800+ projects across DeFi, NFTs, and gaming. BLY's ecosystem is growing but currently more focused on DeFi applications.
Q5: What are the long-term price predictions for BLY and NEAR by 2030?
A: For BLY, the base scenario is $0.004385270362928 - $0.00482379739922. For NEAR, the base scenario is $3.1203673854255 - $3.588422493239325.
Q6: How do the investment strategies for BLY and NEAR differ?
A: BLY is suitable for investors focused on deflationary tokenomics and DeFi potential, while NEAR is suitable for those seeking ecosystem growth and institutional backing.
Q7: What are the main risks associated with investing in BLY and NEAR?
A: BLY faces higher volatility due to lower market cap and trading volume, while NEAR is exposed to broader market trends and competition from other Layer 1 protocols. Both face regulatory risks, with NEAR potentially facing more scrutiny due to its larger scale.
* The information is not intended to be and does not constitute financial advice or any other recommendation of any sort offered or endorsed by Gate.


