The article provides a detailed comparison of ASTRA and KAVA, two blockchain platforms for decentralized applications. It analyzes price history, market status, supply mechanisms, institutional adoption, and technical development. Readers will benefit from insights into long-term and short-term investment strategies, risk management, and potential risks. Designed for investors, the article helps navigate choosing between ASTRA's growth potential in the Cosmos ecosystem and KAVA's established DeFi platform. Key questions regarding historical performance, supply mechanics, and price predictions are addressed to guide investment decisions.
Introduction: ASTRA vs KAVA Investment Comparison
In the cryptocurrency market, the comparison between ASTRA and KAVA has been an unavoidable topic for investors. The two not only show significant differences in market cap ranking, application scenarios, and price performance, but also represent different positioning in the crypto asset space.
Astra Protocol (ASTRA): Since its launch, it has gained market recognition for its simplified trading on the BNB network and charitable focus.
Kava (KAVA): Introduced as a cross-chain decentralized finance platform, it has been providing lending and stablecoin services for mainstream digital assets since 2019.
This article will comprehensively analyze the investment value comparison between ASTRA and KAVA, focusing on historical price trends, supply mechanisms, institutional adoption, technological ecosystems, and future predictions, attempting to answer the question most concerning to investors:
"Which is the better buy right now?"
I. Price History Comparison and Current Market Status
ASTRA and KAVA Historical Price Trends
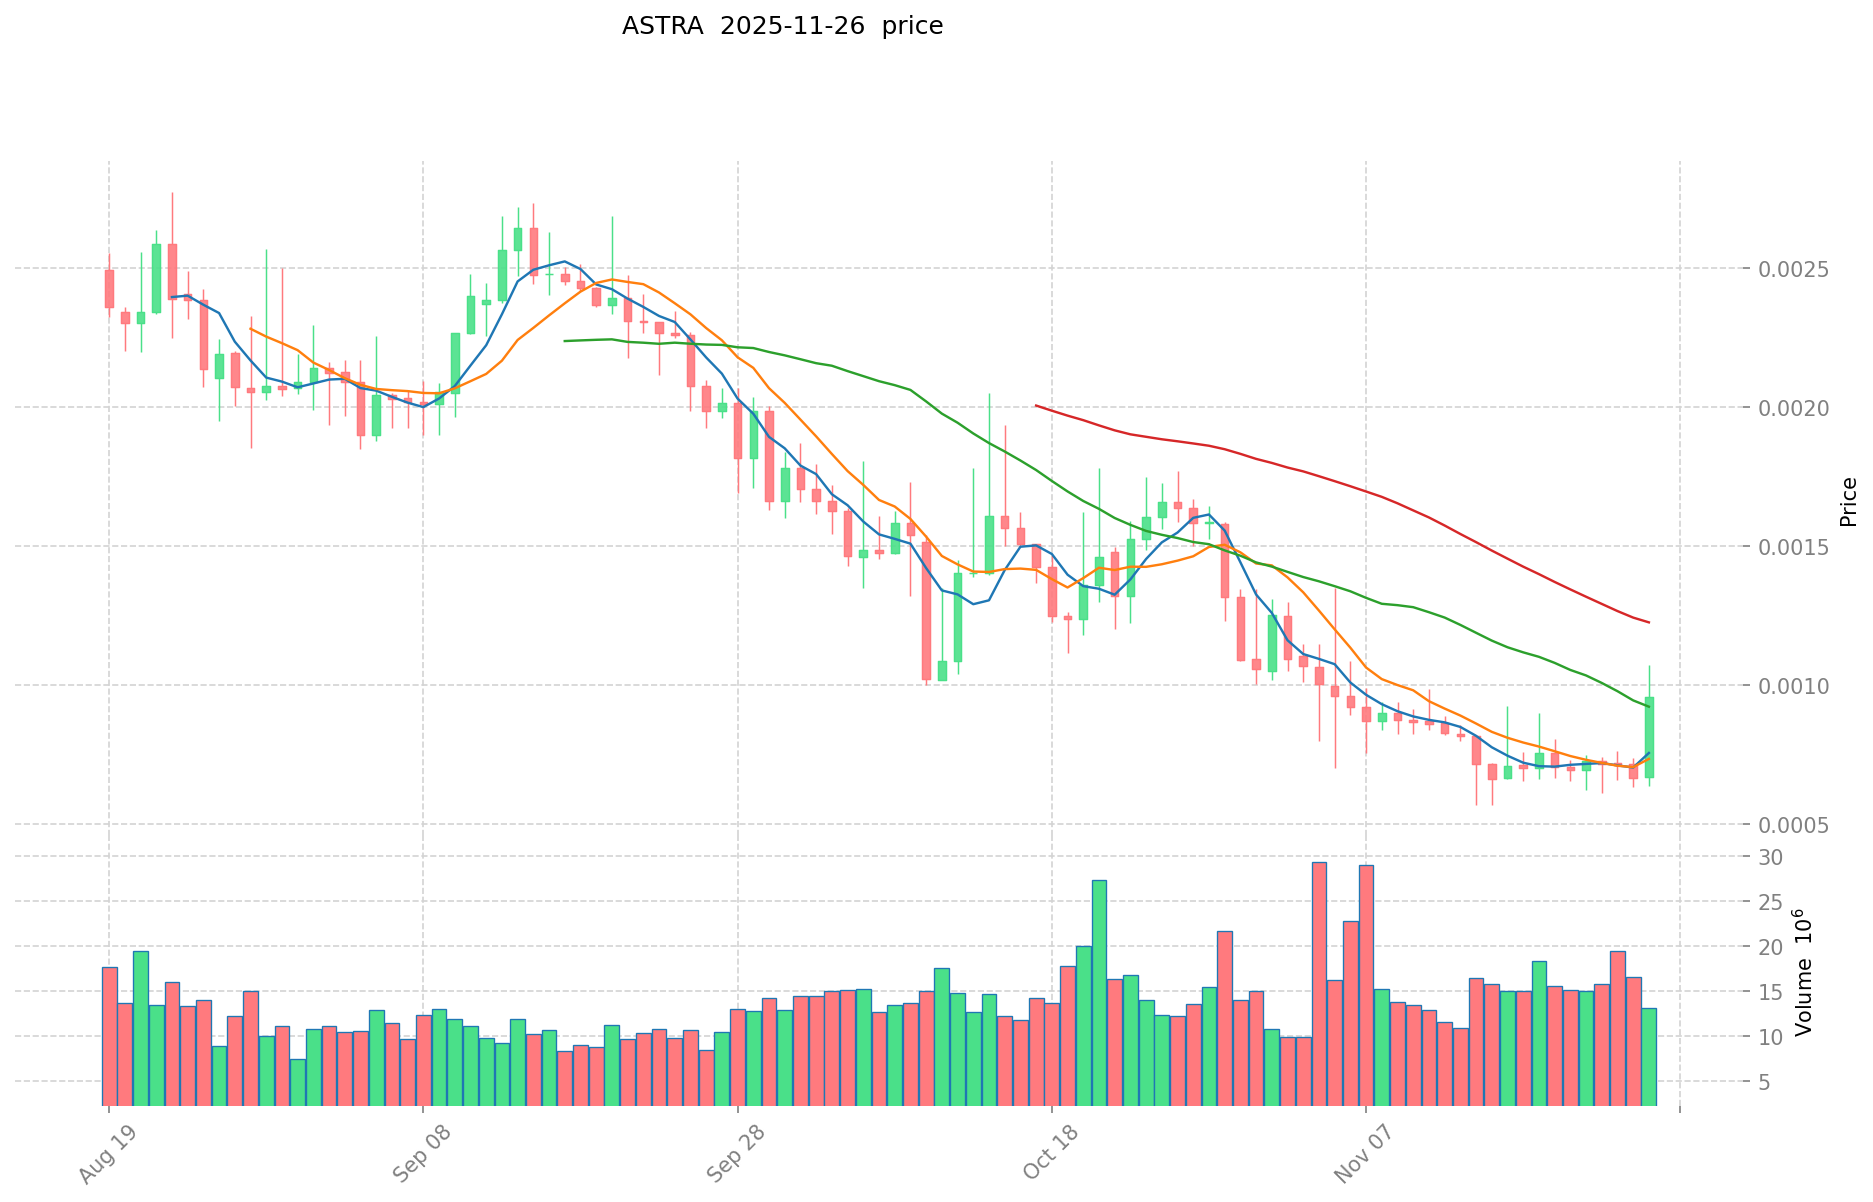
- 2023: ASTRA reached its all-time high of $0.500054 on February 24, 2023.
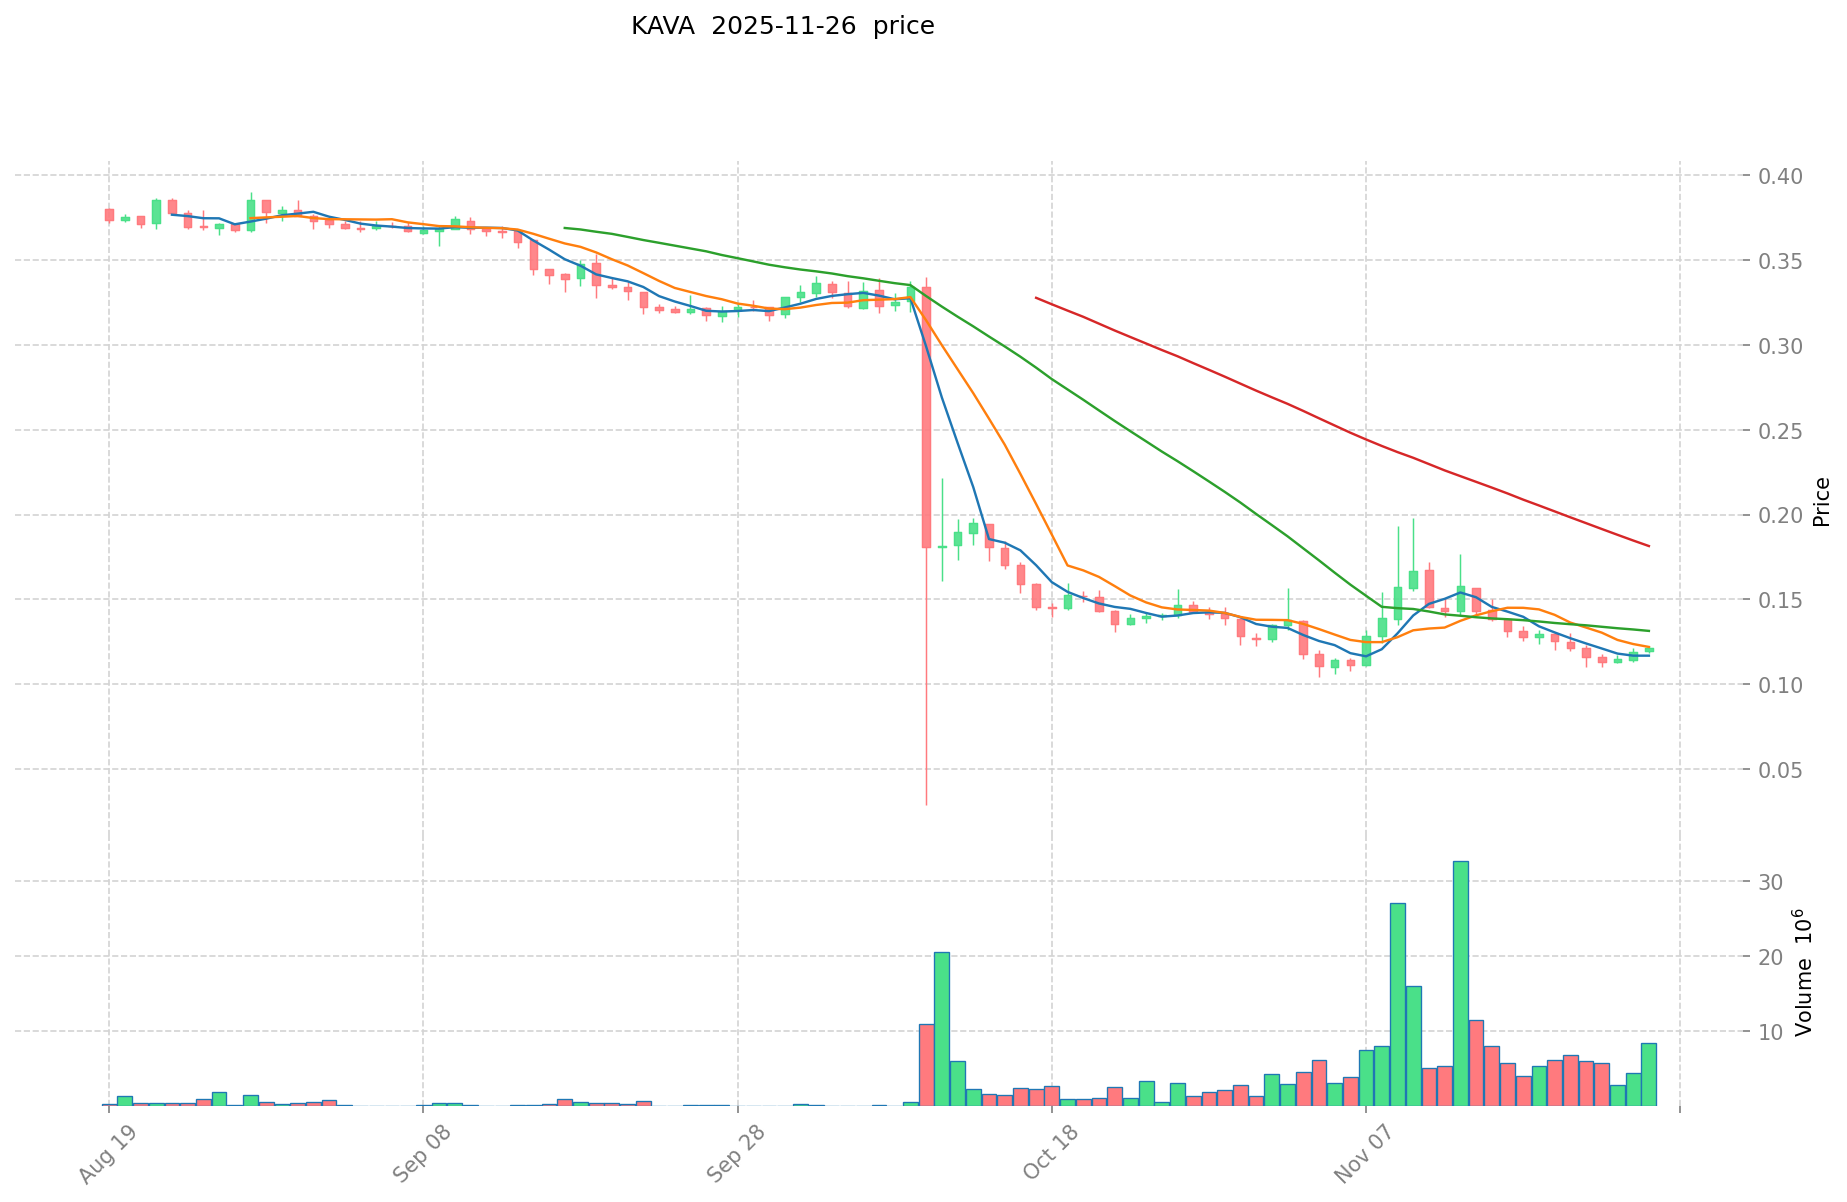
- 2021: KAVA achieved its all-time high of $9.12 on August 30, 2021.
- Comparative Analysis: ASTRA has fallen from its peak of $0.500054 to its current price of $0.0007722, while KAVA has dropped from its high of $9.12 to $0.12134.
Current Market Situation (2025-11-27)
- ASTRA current price: $0.0007722
- KAVA current price: $0.12134
- 24-hour trading volume: ASTRA $15,109.15 vs KAVA $1,168,692.71
- Market Sentiment Index (Fear & Greed Index): 20 (Extreme Fear)
Click to view real-time prices:
- Check ASTRA current price Market Price
- Check KAVA current price Market Price
II. Key Factors Influencing the Investment Value of ASTRA vs KAVA
Supply Mechanisms (Tokenomics)
- ASTRA: Maximum supply capped at 1 billion ASTRA tokens
- KAVA: Maximum supply capped at 209,979,844 KAVA tokens
- 📌 Historical pattern: Deflationary or capped supply models tend to create price support during periods of increased demand.
Institutional Adoption and Market Applications
- Institutional holdings: Limited public data on major institutional holdings for both tokens
- Enterprise adoption: Both projects are building infrastructure to enable enterprise applications, with KAVA having a longer track record in cross-chain DeFi
- National policies: Both projects operate in regulatory environments still developing for layer-1 blockchains
Technical Development and Ecosystem Building
- ASTRA technical upgrades: Focused on building a decentralized settlement layer for the Cosmos ecosystem with custom validator economic incentives
- KAVA technical development: Established multi-chain platform combining Ethereum and Cosmos ecosystems, supporting EVM compatibility
- Ecosystem comparison: KAVA has a more mature ecosystem with established protocols, while ASTRA is newer with developing infrastructure for DeFi and cross-chain applications
Macroeconomic and Market Cycles
- Performance in inflationary environments: Both are relatively new assets with limited historical data during varied inflation conditions
- Macroeconomic monetary policy: As digital assets, both face similar sensitivities to broader crypto market conditions affected by interest rates
- Geopolitical factors: Both aim to provide cross-border transaction capabilities independent of traditional banking systems
III. 2025-2030 Price Prediction: ASTRA vs KAVA
Short-term Prediction (2025)
- ASTRA: Conservative $0.00063386 - $0.000773 | Optimistic $0.000773 - $0.00105901
- KAVA: Conservative $0.1045846 - $0.12161 | Optimistic $0.12161 - $0.170254
Mid-term Prediction (2027)
- ASTRA may enter a growth phase, with prices expected in the range of $0.0007264835655 - $0.001264270101
- KAVA may enter a bullish market, with prices expected in the range of $0.1113242262 - $0.221123463
- Key drivers: Institutional capital inflow, ETFs, ecosystem development
Long-term Prediction (2030)
- ASTRA: Base scenario $0.001308177777039 - $0.001635222221299 | Optimistic scenario $0.001635222221299+
- KAVA: Base scenario $0.211811210540737 - $0.288063246335403 | Optimistic scenario $0.288063246335403+
View detailed price predictions for ASTRA and KAVA
Disclaimer: The above predictions are based on historical data and market analysis. Cryptocurrency markets are highly volatile and subject to rapid changes. These forecasts should not be considered as financial advice. Always conduct your own research before making investment decisions.
ASTRA:
| 年份 |
预测最高价 |
预测平均价格 |
预测最低价 |
涨跌幅 |
| 2025 |
0.00105901 |
0.000773 |
0.00063386 |
0 |
| 2026 |
0.0009709653 |
0.000916005 |
0.00088852485 |
18 |
| 2027 |
0.001264270101 |
0.00094348515 |
0.0007264835655 |
22 |
| 2028 |
0.001424002136895 |
0.0011038776255 |
0.00099348986295 |
42 |
| 2029 |
0.001352415672881 |
0.001263939881197 |
0.000947954910898 |
63 |
| 2030 |
0.001635222221299 |
0.001308177777039 |
0.000876479110616 |
69 |
KAVA:
| 年份 |
预测最高价 |
预测平均价格 |
预测最低价 |
涨跌幅 |
| 2025 |
0.170254 |
0.12161 |
0.1045846 |
0 |
| 2026 |
0.15906588 |
0.145932 |
0.1167456 |
20 |
| 2027 |
0.221123463 |
0.15249894 |
0.1113242262 |
25 |
| 2028 |
0.203624209635 |
0.1868112015 |
0.16065763329 |
53 |
| 2029 |
0.228404715513975 |
0.1952177055675 |
0.189361174400475 |
60 |
| 2030 |
0.288063246335403 |
0.211811210540737 |
0.173685192643404 |
74 |
IV. Investment Strategy Comparison: ASTRA vs KAVA
Long-term vs Short-term Investment Strategies
- ASTRA: Suitable for investors focusing on emerging DeFi ecosystems and cross-chain settlement solutions
- KAVA: Suitable for investors interested in established multi-chain DeFi platforms with a longer track record
Risk Management and Asset Allocation
- Conservative investors: ASTRA: 20% vs KAVA: 80%
- Aggressive investors: ASTRA: 40% vs KAVA: 60%
- Hedging tools: Stablecoin allocation, options, cross-currency portfolios
V. Potential Risk Comparison
Market Risks
- ASTRA: Higher volatility due to lower market cap and trading volume
- KAVA: Exposure to broader DeFi market fluctuations
Technical Risks
- ASTRA: Scalability, network stability in early stages of development
- KAVA: Smart contract vulnerabilities, cross-chain bridge security
Regulatory Risks
- Global regulatory policies may impact both tokens differently, with KAVA potentially facing more scrutiny due to its established DeFi services
VI. Conclusion: Which Is the Better Buy?
📌 Investment Value Summary:
- ASTRA advantages: Potential for higher growth as a newer project, focus on Cosmos ecosystem integration
- KAVA advantages: Established ecosystem, multi-chain support, proven track record in DeFi
✅ Investment Advice:
- New investors: Consider a small allocation to KAVA for exposure to established DeFi platforms
- Experienced investors: Balanced approach with both ASTRA and KAVA to capture potential growth and stability
- Institutional investors: KAVA may be more suitable due to its longer history and broader ecosystem support
⚠️ Risk Warning: Cryptocurrency markets are highly volatile. This article does not constitute investment advice.
None
VII. FAQ
Q1: What are the main differences between ASTRA and KAVA?
A: ASTRA is a newer project focused on building a decentralized settlement layer for the Cosmos ecosystem, while KAVA is an established multi-chain DeFi platform combining Ethereum and Cosmos ecosystems. KAVA has a longer track record and a more mature ecosystem, whereas ASTRA is in earlier stages of development with potential for higher growth.
Q2: Which token has performed better historically?
A: KAVA reached its all-time high of $9.12 in August 2021, while ASTRA's all-time high was $0.500054 in February 2023. Both have since declined significantly, with KAVA currently trading at $0.12134 and ASTRA at $0.0007722.
Q3: How do the supply mechanisms of ASTRA and KAVA compare?
A: ASTRA has a maximum supply capped at 1 billion tokens, while KAVA's maximum supply is capped at 209,979,844 tokens. Both employ deflationary or capped supply models, which can potentially create price support during periods of increased demand.
Q4: What are the key factors influencing the investment value of these tokens?
A: Key factors include supply mechanisms, institutional adoption, market applications, technical development, ecosystem building, and macroeconomic conditions. KAVA has a more established ecosystem and longer track record, while ASTRA offers potential for growth in the emerging Cosmos ecosystem.
Q5: How should investors approach allocating between ASTRA and KAVA?
A: Conservative investors might consider allocating 20% to ASTRA and 80% to KAVA, while more aggressive investors could opt for 40% ASTRA and 60% KAVA. New investors may want to start with a small allocation to KAVA, while experienced investors might balance both for potential growth and stability.
Q6: What are the main risks associated with investing in ASTRA and KAVA?
A: Both face market risks such as volatility, technical risks including smart contract vulnerabilities and network stability issues, and regulatory risks. ASTRA may have higher volatility due to its lower market cap, while KAVA may face more regulatory scrutiny due to its established DeFi services.
Q7: What are the long-term price predictions for ASTRA and KAVA?
A: By 2030, base scenario predictions suggest ASTRA could reach $0.001308177777039 - $0.001635222221299, while KAVA could reach $0.211811210540737 - $0.288063246335403. However, these predictions are speculative and subject to market conditions.
* The information is not intended to be and does not constitute financial advice or any other recommendation of any sort offered or endorsed by Gate.


