This article compares ASTRA and DOT as blockchain platforms for enterprise solutions, focusing on investment value and market performance. Key factors analyzed include price history, supply mechanisms, institutional adoption, technical development, and macroeconomic impacts. It addresses whether ASTRA or DOT is a better buy, catering to investors seeking informed strategies and insights. Through detailed analysis and projections, readers gain clarity on potential risks and benefits associated with each asset. Use Gate for real-time price checks and deeper insights into both cryptocurrencies. Suitable for quick, comprehensive scanning.
Introduction: Investment Comparison of ASTRA vs DOT
In the cryptocurrency market, the comparison between ASTRA vs DOT has always been a topic that investors cannot ignore. The two not only have significant differences in market cap ranking, application scenarios, and price performance, but also represent different positioning in crypto assets.
Astra Protocol (ASTRA): Since its launch, it has gained market recognition for making trading on the BNB network simple.
Polkadot (DOT): Since its inception in 2020, it has been hailed as a "blockchain of blockchains", aiming to connect different blockchain networks.
This article will comprehensively analyze the investment value comparison between ASTRA vs DOT, focusing on historical price trends, supply mechanisms, institutional adoption, technical ecosystems, and future predictions, and attempt to answer the question that investors care most about:
"Which is the better buy right now?"
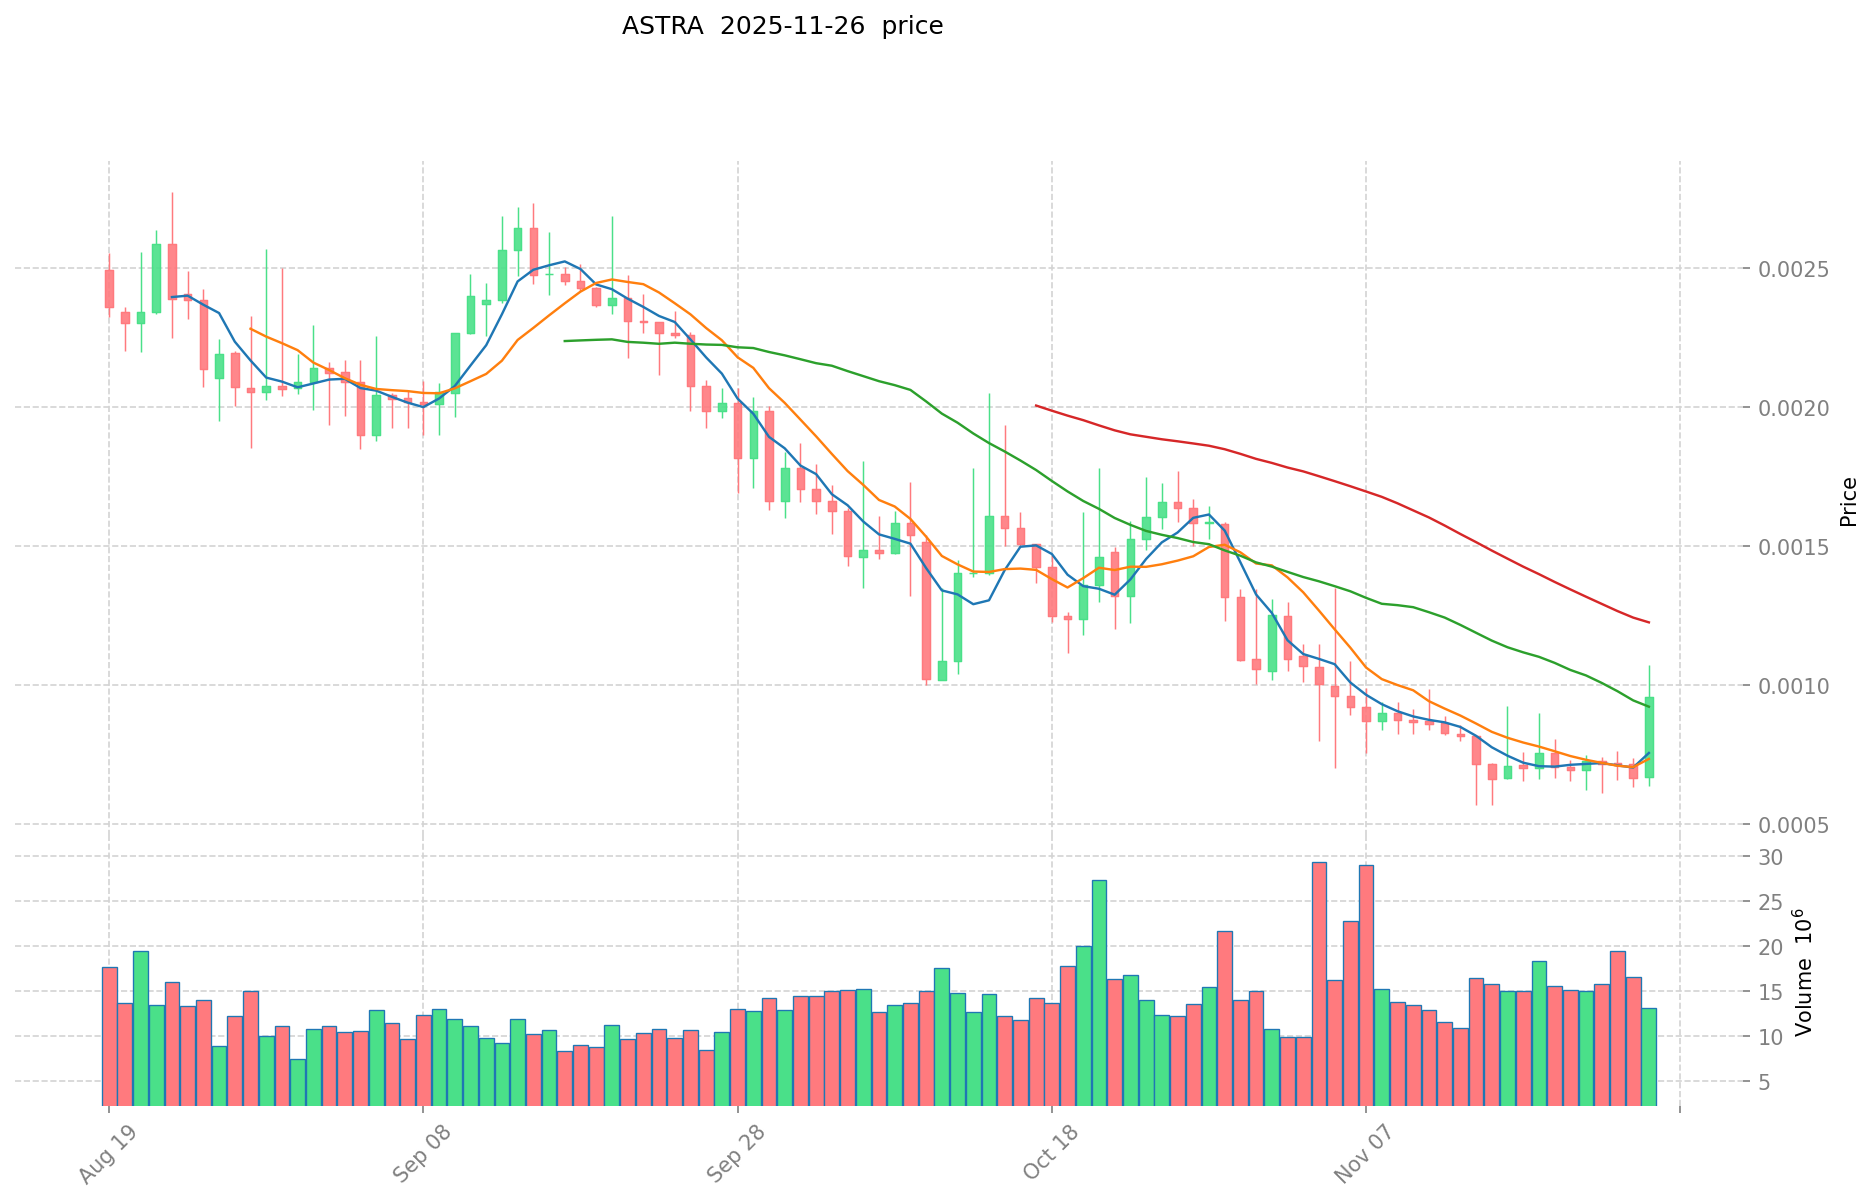
I. Price History Comparison and Current Market Status
ASTRA and DOT Historical Price Trends
- 2023: ASTRA reached its all-time high of $0.500054 on February 24, 2023.
- 2021: DOT hit its all-time high of $54.98 on November 4, 2021.
- Comparative analysis: In the recent market cycle, ASTRA dropped from its peak of $0.500054 to a low of $0.00035647, while DOT declined from $54.98 to $2.13.
Current Market Situation (2025-11-27)
- ASTRA current price: $0.0007906
- DOT current price: $2.257
- 24-hour trading volume: ASTRA $14,836.62 vs DOT $601,150.55
- Market Sentiment Index (Fear & Greed Index): 20 (Extreme Fear)
Click to view real-time prices:
- Check ASTRA current price Market Price
- Check DOT current price Market Price

II. Core Factors Affecting the Investment Value of ASTRA vs DOT
Supply Mechanism Comparison (Tokenomics)
- ASTRA: Initial supply of 2 billion tokens with additional tokens created through staking rewards, following an inflationary model that gradually decreases over time
- DOT: Inflationary token model with no maximum supply, targeting 10% annual inflation with validator rewards that adjust based on staking participation
- 📌 Historical pattern: Inflationary tokens like DOT and ASTRA typically experience downward price pressure unless network growth and adoption outpace inflation rates
Institutional Adoption and Market Applications
- Institutional holdings: DOT has greater institutional presence with investments from VCs like Three Arrows Capital and Polychain Capital, while ASTRA is still building institutional relationships
- Enterprise adoption: DOT has established partnerships with companies like Parity Technologies and is used in enterprise blockchain solutions; ASTRA's enterprise adoption is still emerging
- Regulatory attitudes: Both projects face similar regulatory considerations as layer-1 blockchain networks, with DOT having a longer track record of regulatory navigation
Technical Development and Ecosystem Building
- ASTRA technical upgrades: Built on Cosmos SDK with IBC compatibility, focused on scalability and cross-chain interoperability with Polkadot networks
- DOT technical development: Pioneer of the parachain model, offering shared security and cross-chain messaging via XCMP, with ongoing development of parathreads for more flexible network participation
- Ecosystem comparison: DOT has a more mature ecosystem with established parachains like Acala, Moonbeam, and Astar, while ASTRA is building its ecosystem through the Cosmos IBC network and extending bridges to Polkadot
Macroeconomic Factors and Market Cycles
- Performance in inflationary environments: Both tokens have inflationary models and are primarily speculative assets rather than inflation hedges
- Macroeconomic monetary policy: Interest rates and USD strength typically impact both assets similarly as part of the broader crypto market
- Geopolitical factors: Both networks offer censorship-resistant infrastructure, with DOT's more established presence potentially providing greater stability during geopolitical uncertainty
III. 2025-2030 Price Prediction: ASTRA vs DOT
Short-term Prediction (2025)
- ASTRA: Conservative $0.000577138 - $0.0007906 | Optimistic $0.0007906 - $0.000822224
- DOT: Conservative $1.3644 - $2.274 | Optimistic $2.274 - $2.79702
Mid-term Prediction (2027)
- ASTRA may enter a growth phase, with prices expected in the range of $0.0007857678528 - $0.0011599430208
- DOT may enter a steady growth phase, with prices expected in the range of $1.9712322495 - $3.0262579605
- Key drivers: Institutional fund inflows, ETFs, ecosystem development
Long-term Prediction (2030)
- ASTRA: Base scenario $0.00148151290193 - $0.001866706256432 | Optimistic scenario $0.001866706256432+
- DOT: Base scenario $2.019266987081305 - $3.605833905502331 | Optimistic scenario $3.605833905502331 - $4.47123404282289
View detailed price predictions for ASTRA and DOT
Disclaimer: This analysis is based on historical data and market projections. Cryptocurrency markets are highly volatile and subject to rapid changes. These predictions should not be considered as financial advice. Always conduct your own research before making investment decisions.
ASTRA:
| 年份 |
预测最高价 |
预测平均价格 |
预测最低价 |
涨跌幅 |
| 2025 |
0.000822224 |
0.0007906 |
0.000577138 |
0 |
| 2026 |
0.00106446384 |
0.000806412 |
0.00049997544 |
2 |
| 2027 |
0.0011599430208 |
0.00093543792 |
0.0007857678528 |
18 |
| 2028 |
0.001351520706816 |
0.0010476904704 |
0.0007857678528 |
32 |
| 2029 |
0.001763420215253 |
0.001199605588608 |
0.000791739688481 |
51 |
| 2030 |
0.001866706256432 |
0.00148151290193 |
0.000888907741158 |
87 |
DOT:
| 年份 |
预测最高价 |
预测平均价格 |
预测最低价 |
涨跌幅 |
| 2025 |
2.79702 |
2.274 |
1.3644 |
0 |
| 2026 |
3.0172569 |
2.53551 |
2.3833794 |
12 |
| 2027 |
3.0262579605 |
2.77638345 |
1.9712322495 |
23 |
| 2028 |
3.6846772956675 |
2.90132070525 |
2.6982282558825 |
28 |
| 2029 |
3.918668810545912 |
3.29299900045875 |
2.76611916038535 |
45 |
| 2030 |
4.47123404282289 |
3.605833905502331 |
2.019266987081305 |
59 |
IV. Investment Strategy Comparison: ASTRA vs DOT
Long-term vs Short-term Investment Strategies
- ASTRA: Suitable for investors focused on ecosystem potential and cross-chain interoperability
- DOT: Suitable for investors seeking established networks with strong institutional backing
Risk Management and Asset Allocation
- Conservative investors: ASTRA: 20% vs DOT: 80%
- Aggressive investors: ASTRA: 40% vs DOT: 60%
- Hedging tools: Stablecoin allocation, options, cross-currency portfolios
V. Potential Risk Comparison
Market Risks
- ASTRA: Higher volatility due to lower market cap and trading volume
- DOT: Susceptible to broader crypto market trends and sentiment shifts
Technical Risks
- ASTRA: Scalability challenges, network stability during growth phases
- DOT: Parachain auction dynamics, potential security vulnerabilities in cross-chain messaging
Regulatory Risks
- Global regulatory policies may impact both, with DOT potentially facing more scrutiny due to its larger market presence
VI. Conclusion: Which Is the Better Buy?
📌 Investment Value Summary:
- ASTRA advantages: Emerging ecosystem, potential for higher growth, cross-chain compatibility
- DOT advantages: Established network, strong institutional adoption, mature parachain ecosystem
✅ Investment Advice:
- Novice investors: Consider a smaller allocation to ASTRA for higher risk/reward, larger allocation to DOT for stability
- Experienced investors: Balanced portfolio with both ASTRA and DOT, adjusting based on risk tolerance
- Institutional investors: Focus on DOT for its established presence, consider ASTRA for diversification
⚠️ Risk Warning: Cryptocurrency markets are highly volatile. This article does not constitute investment advice.
None
VII. FAQ
Q1: What are the key differences between ASTRA and DOT?
A: ASTRA is built on Cosmos SDK with IBC compatibility, focusing on scalability and cross-chain interoperability. DOT is the pioneer of the parachain model, offering shared security and cross-chain messaging via XCMP. DOT has a more mature ecosystem and stronger institutional adoption, while ASTRA is still building its ecosystem and institutional relationships.
Q2: Which token has performed better historically?
A: DOT reached a higher all-time high of $54.98 in November 2021, compared to ASTRA's all-time high of $0.500054 in February 2023. However, both have seen significant drops from their peaks, with ASTRA falling to $0.00035647 and DOT to $2.13 in recent market cycles.
Q3: How do the supply mechanisms of ASTRA and DOT compare?
A: ASTRA has an initial supply of 2 billion tokens with an inflationary model that gradually decreases over time. DOT has an inflationary token model with no maximum supply, targeting 10% annual inflation with validator rewards that adjust based on staking participation.
Q4: What are the price predictions for ASTRA and DOT by 2030?
A: For ASTRA, the base scenario predicts a range of $0.00148151290193 - $0.001866706256432, with an optimistic scenario above $0.001866706256432. For DOT, the base scenario predicts a range of $2.019266987081305 - $3.605833905502331, with an optimistic scenario of $3.605833905502331 - $4.47123404282289.
Q5: How should investors allocate their portfolio between ASTRA and DOT?
A: Conservative investors might consider allocating 20% to ASTRA and 80% to DOT, while aggressive investors might opt for 40% ASTRA and 60% DOT. The exact allocation should be based on individual risk tolerance and investment goals.
Q6: What are the main risks associated with investing in ASTRA and DOT?
A: ASTRA faces higher volatility due to its lower market cap and trading volume, as well as potential scalability challenges. DOT is susceptible to broader crypto market trends and may face regulatory scrutiny due to its larger market presence. Both tokens carry technical risks related to their respective network architectures.
* The information is not intended to be and does not constitute financial advice or any other recommendation of any sort offered or endorsed by Gate.


