This article examines the comparison between AARK and LINK, focusing on their respective decentralized oracle solutions. AARK offers an innovative AI-driven platform with a fixed token supply, while LINK provides established infrastructure with broad adoption and institutional interest. It addresses critical investment factors such as price history, supply mechanisms, and market applications, aiming to guide investors on which token could be more favorable. Suitable for both conservative and aggressive investors, the piece outlines potential risks and strategies for asset allocation, catering to those seeking insights into crypto investment dynamics. View current prices and detailed analyses on Gate.
Introduction: AARK vs LINK Investment Comparison
In the cryptocurrency market, the comparison between AARK vs LINK has always been a topic that investors cannot avoid. The two not only show significant differences in market cap ranking, application scenarios, and price performance, but also represent different positioning in the crypto asset space.
AARK (AARK): Since its launch, it has gained market recognition for its innovative approach as the first-of-its-kind Leverage-Everything Perpetual DEX.
LINK (LINK): Launched in 2017, it has been hailed as a crucial infrastructure for decentralized oracles, becoming one of the most widely adopted cryptocurrencies globally in terms of trading volume and market capitalization.
This article will comprehensively analyze the investment value comparison between AARK vs LINK, focusing on historical price trends, supply mechanisms, institutional adoption, technological ecosystems, and future predictions, attempting to answer the question most concerning to investors:
"Which is the better buy right now?"
I. Price History Comparison and Current Market Status
AARK (Coin A) and LINK (Coin B) Historical Price Trends
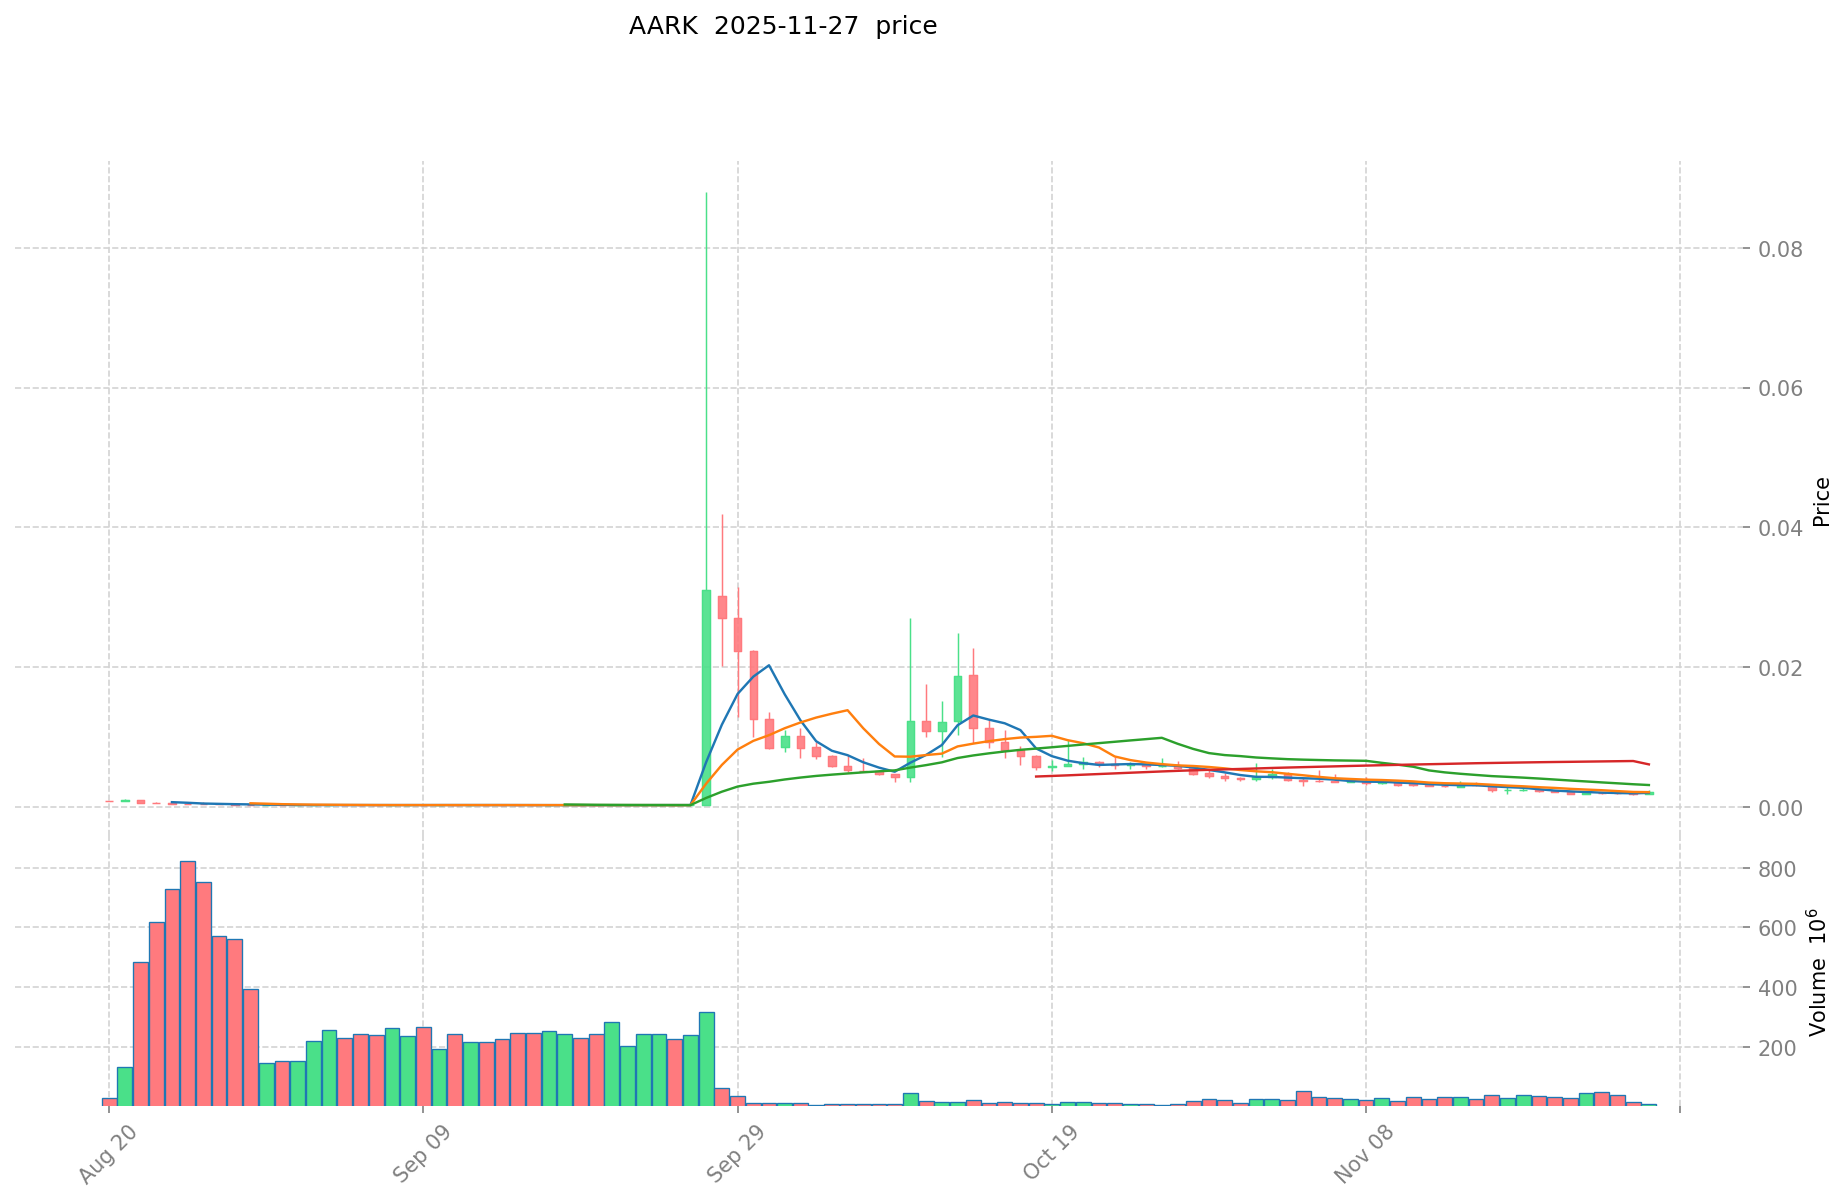
- 2024: AARK reached its all-time high of $0.0992 on June 10, 2024.
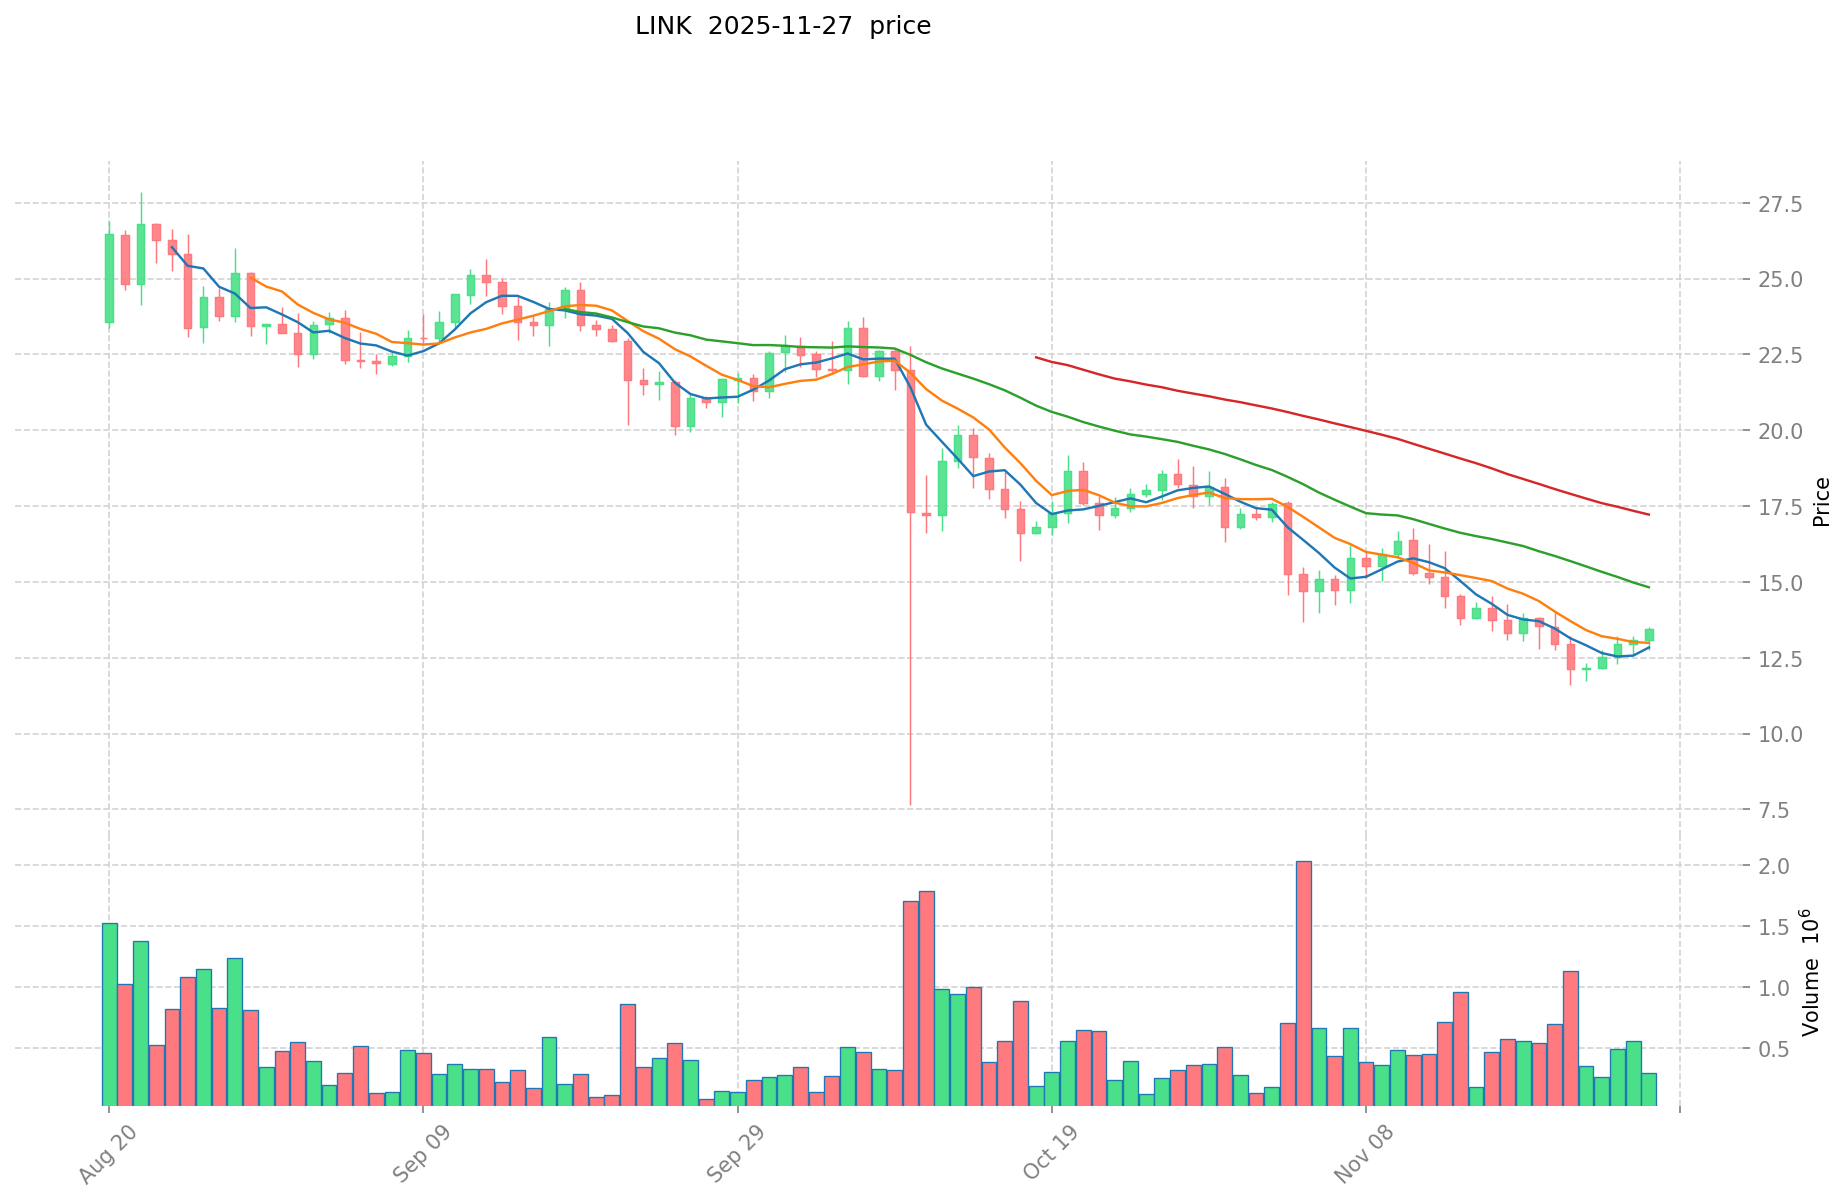
- 2021: LINK hit its all-time high of $52.7 on May 10, 2021.
- Comparative Analysis: AARK has experienced a significant decline from its all-time high, dropping to a low of $0.0002154 on August 29, 2025. LINK has also seen a substantial decrease from its peak, but has maintained a higher value relative to its initial price.
Current Market Situation (2025-11-27)
- AARK current price: $0.0021185
- LINK current price: $13.392
- 24-hour trading volume: AARK $17,574.85 vs LINK $3,814,708.66
- Market Sentiment Index (Fear & Greed Index): 22 (Extreme Fear)
Click to view real-time prices:
- View AARK current price Market Price
- View LINK current price Market Price
II. Core Factors Affecting Investment Value of AARK vs LINK
Supply Mechanisms Comparison (Tokenomics)
- AARK: Fixed supply model with a total of 100 million tokens, no additional tokens will be created, creating potential scarcity value
- LINK: Inflation model with a maximum supply of 1 billion tokens, with tokens being gradually released according to a predefined schedule
- 📌 Historical pattern: Fixed supply tokens like AARK tend to appreciate faster during bull markets due to limited availability, while LINK's gradual release mechanism may provide more stability but potentially slower price growth during market expansions.
Institutional Adoption and Market Applications
- Institutional holdings: LINK has gained significantly more institutional adoption, with major players like Grayscale having dedicated LINK investment products
- Enterprise adoption: LINK has established partnerships with Google Cloud, SWIFT, and other major enterprises for oracle solutions, while AARK is still developing its enterprise relationships
- Regulatory attitudes: Both tokens face similar regulatory environments across jurisdictions, though LINK's longer market presence has given it more regulatory clarity
Technical Development and Ecosystem Building
- AARK technical upgrades: Enhanced AI functionality with improved scalability and cross-chain capabilities
- LINK technical development: CCIP (Cross-Chain Interoperability Protocol) implementation and staking mechanism improvements for enhanced network security
- Ecosystem comparison: LINK has a mature ecosystem with widespread integration across DeFi protocols, while AARK is building an AI-focused ecosystem with emerging applications in prediction markets and data analytics
Macroeconomic and Market Cycles
- Inflation environment performance: LINK has historically shown some correlation with broader markets, while AARK's positioning as an AI-crypto hybrid may offer different market behavior patterns
- Macroeconomic monetary policy: Both tokens show sensitivity to interest rate changes, with LINK demonstrating more established patterns of response to Fed policy shifts
- Geopolitical factors: LINK's oracle services have global utility regardless of geopolitical tensions, while AARK's AI capabilities may face different regional regulatory approaches
III. 2025-2030 Price Prediction: AARK vs LINK
Short-term Prediction (2025)
- AARK: Conservative $0.00192366 - $0.0021374 | Optimistic $0.0021374 - $0.003163352
- LINK: Conservative $12.56498 - $13.367 | Optimistic $13.367 - $17.77811
Mid-term Prediction (2027)
- AARK may enter a growth phase, with prices expected between $0.0027553308896 - $0.0036538083536
- LINK may enter a steady growth phase, with prices expected between $13.57926796 - $18.332011746
- Key drivers: Institutional capital inflow, ETF developments, ecosystem growth
Long-term Prediction (2030)
- AARK: Base scenario $0.004486565186033 - $0.005787669089982 | Optimistic scenario $0.005787669089982+
- LINK: Base scenario $23.6489062193982 - $32.162512458381552 | Optimistic scenario $32.162512458381552+
View detailed price predictions for AARK and LINK
Disclaimer: This analysis is based on historical data and market projections. Cryptocurrency markets are highly volatile and unpredictable. This information should not be considered as financial advice. Always conduct your own research before making investment decisions.
AARK:
| 年份 |
预测最高价 |
预测平均价格 |
预测最低价 |
涨跌幅 |
| 2025 |
0.003163352 |
0.0021374 |
0.00192366 |
0 |
| 2026 |
0.00333947376 |
0.002650376 |
0.00143120304 |
25 |
| 2027 |
0.0036538083536 |
0.00299492488 |
0.0027553308896 |
41 |
| 2028 |
0.004687356929688 |
0.0033243666168 |
0.002260569299424 |
56 |
| 2029 |
0.004967268598822 |
0.004005861773244 |
0.002723986005805 |
89 |
| 2030 |
0.005787669089982 |
0.004486565186033 |
0.002691939111619 |
111 |
LINK:
| 年份 |
预测最高价 |
预测平均价格 |
预测最低价 |
涨跌幅 |
| 2025 |
17.77811 |
13.367 |
12.56498 |
0 |
| 2026 |
18.3756149 |
15.572555 |
9.9664352 |
16 |
| 2027 |
18.332011746 |
16.97408495 |
13.57926796 |
26 |
| 2028 |
23.65508478632 |
17.653048348 |
15.18162157928 |
31 |
| 2029 |
26.6437458716364 |
20.65406656716 |
13.0120619373108 |
54 |
| 2030 |
32.162512458381552 |
23.6489062193982 |
22.46646090842829 |
76 |
IV. Investment Strategy Comparison: AARK vs LINK
Long-term vs Short-term Investment Strategies
- AARK: Suitable for investors focused on AI-driven ecosystems and emerging decentralized finance applications
- LINK: Suitable for investors seeking established infrastructure plays with widespread adoption in the blockchain space
Risk Management and Asset Allocation
- Conservative investors: AARK: 10% vs LINK: 90%
- Aggressive investors: AARK: 30% vs LINK: 70%
- Hedging tools: Stablecoin allocation, options, cross-currency portfolio diversification
V. Potential Risk Comparison
Market Risk
- AARK: Higher volatility due to lower market cap and trading volume
- LINK: Exposure to broader DeFi market fluctuations and correlations with major cryptocurrencies
Technical Risk
- AARK: Scalability challenges, network stability in early stages of development
- LINK: Potential oracle manipulation, smart contract vulnerabilities
Regulatory Risk
- Global regulatory policies may impact both tokens differently, with LINK potentially facing more scrutiny due to its wider adoption and use in critical financial infrastructure
VI. Conclusion: Which Is the Better Buy?
📌 Investment Value Summary:
- AARK advantages: Innovative AI-driven platform, potential for high growth in emerging market segment
- LINK advantages: Established market presence, widespread adoption, crucial infrastructure for DeFi and blockchain applications
✅ Investment Advice:
- New investors: Consider a small allocation to LINK as part of a diversified crypto portfolio
- Experienced investors: Balanced approach with both AARK and LINK, adjusting ratios based on risk tolerance
- Institutional investors: Focus on LINK for its established track record and institutional-grade infrastructure applications
⚠️ Risk Warning: The cryptocurrency market is highly volatile, and this article does not constitute investment advice.
None
VII. FAQ
Q1: What are the main differences between AARK and LINK?
A: AARK is a newer AI-driven platform with a fixed supply of 100 million tokens, while LINK is an established oracle network with a maximum supply of 1 billion tokens. LINK has wider adoption and institutional backing, whereas AARK is still developing its ecosystem.
Q2: Which token has performed better historically?
A: LINK has shown better historical performance, reaching an all-time high of $52.7 in May 2021. AARK's all-time high was $0.0992 in June 2024, but it has experienced a significant decline since then.
Q3: How do the supply mechanisms of AARK and LINK differ?
A: AARK has a fixed supply model with no additional tokens being created, potentially creating scarcity value. LINK follows an inflation model with tokens being gradually released according to a predefined schedule.
Q4: What are the key factors affecting the investment value of these tokens?
A: Key factors include supply mechanisms, institutional adoption, market applications, technical development, ecosystem building, and macroeconomic conditions.
Q5: Which token is considered more suitable for conservative investors?
A: LINK is generally considered more suitable for conservative investors due to its established market presence, wider adoption, and crucial role in blockchain infrastructure.
Q6: What are the potential risks associated with investing in AARK and LINK?
A: Both tokens face market risks, technical risks, and regulatory risks. AARK may have higher volatility due to its lower market cap, while LINK is exposed to broader DeFi market fluctuations.
Q7: What are the long-term price predictions for AARK and LINK?
A: By 2030, AARK's base scenario price range is predicted to be $0.004486565186033 - $0.005787669089982, while LINK's base scenario range is $23.6489062193982 - $32.162512458381552. However, these predictions are subject to market volatility and should not be considered financial advice.
* The information is not intended to be and does not constitute financial advice or any other recommendation of any sort offered or endorsed by Gate.


