2025 STB Price Prediction: Bullish Trends and Key Factors Driving Growth in the Digital Asset Market
Introduction: STB's Market Position and Investment Value
Stabble (STB), as a new frictionless DEX on Solana, has processed over 50% of stablecoin volume with significantly less liquidity than competitors since its inception. As of 2025, STB's market cap has reached $513,321.74, with a circulating supply of approximately 183,460,236 tokens, maintaining a price around $0.002798. This asset, known as the "liquidity-efficient DEX," is playing an increasingly crucial role in stablecoin trading and yield farming on the Solana blockchain.
This article will comprehensively analyze STB's price trends from 2025 to 2030, combining historical patterns, market supply and demand, ecosystem development, and macroeconomic factors to provide professional price predictions and practical investment strategies for investors.
I. STB Price History Review and Current Market Status
STB Historical Price Evolution
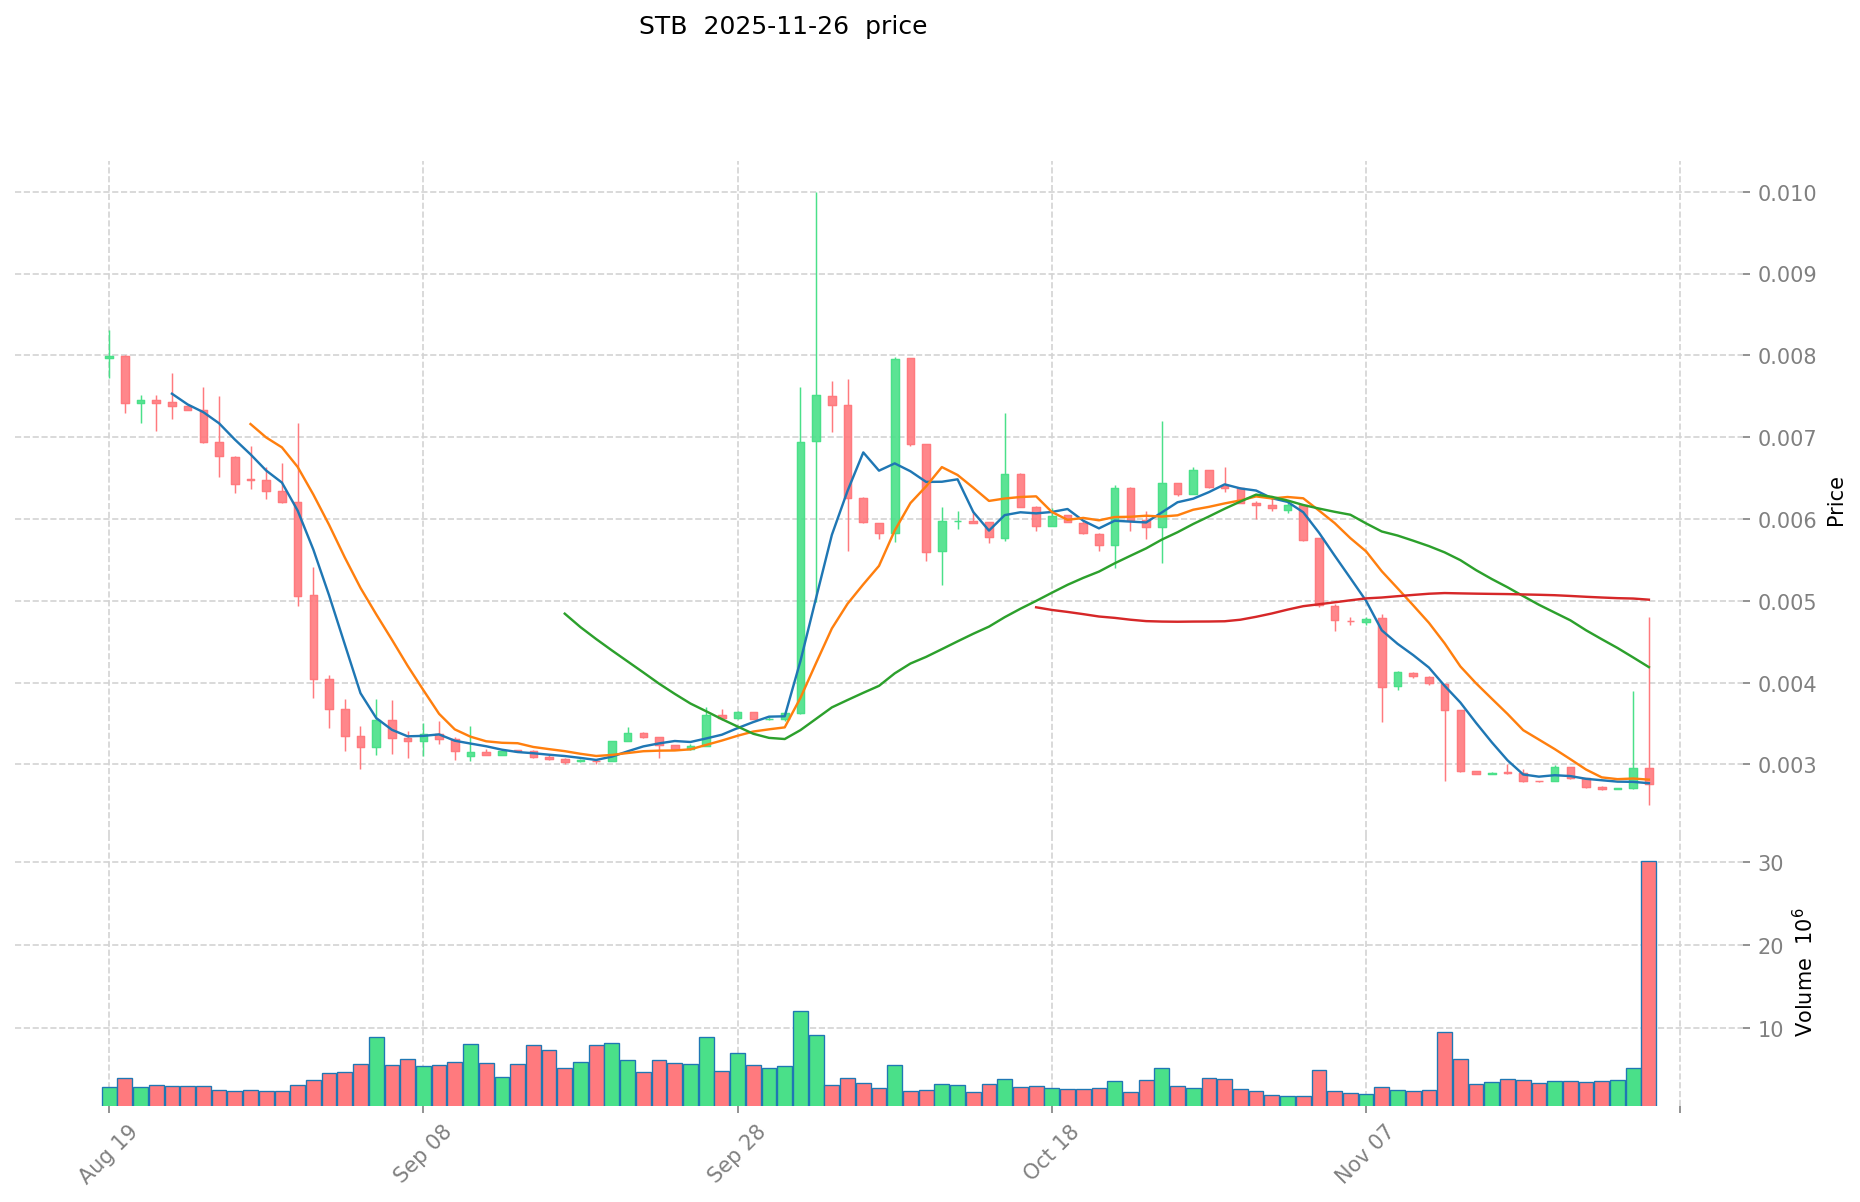
- May 2025: STB reached its all-time high of $0.08
- November 2025: STB hit its all-time low of $0.0025
STB Current Market Situation
As of November 27, 2025, STB is trading at $0.002798. Over the past 24 hours, the price has increased by 1.92%, with a trading volume of $12,386.81. The current market cap stands at $513,321.74, ranking STB at 3249 in the cryptocurrency market.
STB has experienced significant volatility in recent periods. In the last 7 days, the price has decreased by 6.08%, while the 30-day decline is more substantial at 57.57%. This indicates a strong bearish trend in the short to medium term.
The circulating supply of STB is 183,460,236.25 tokens, which represents 36.69% of the total supply of 500,000,000 STB. The fully diluted market cap is $1,399,000.
Despite the recent price decline, STB has maintained some trading activity, suggesting ongoing interest in the token. However, the current price is significantly below its all-time high, reflecting the broader market conditions and potential challenges faced by the project.
Click to view the current STB market price
STB Market Sentiment Indicator
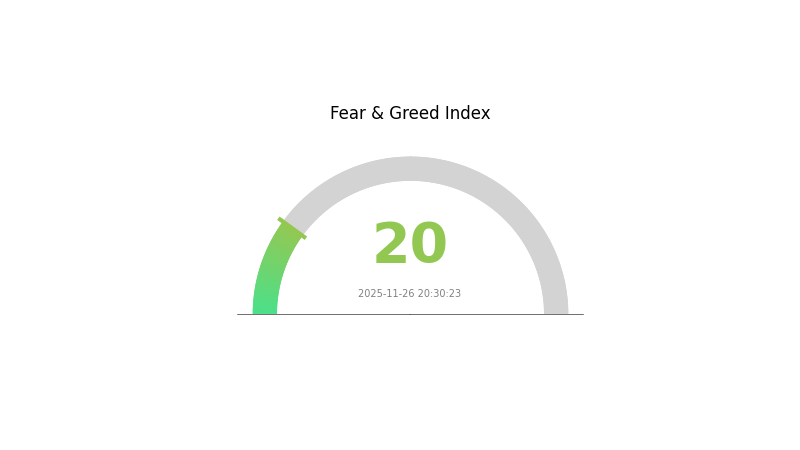
2025-11-26 Fear and Greed Index: 20 (Extreme Fear)
Click to view the current Fear & Greed Index
The crypto market is currently gripped by extreme fear, as indicated by the Fear and Greed Index hitting a low of 20. This sentiment often signals a potential buying opportunity for contrarian investors. However, it's crucial to remember that market emotions can be volatile. Savvy traders might consider dollar-cost averaging or setting up limit orders to capitalize on possible price dips. As always, thorough research and risk management are essential in navigating these turbulent market conditions.
STB Holdings Distribution
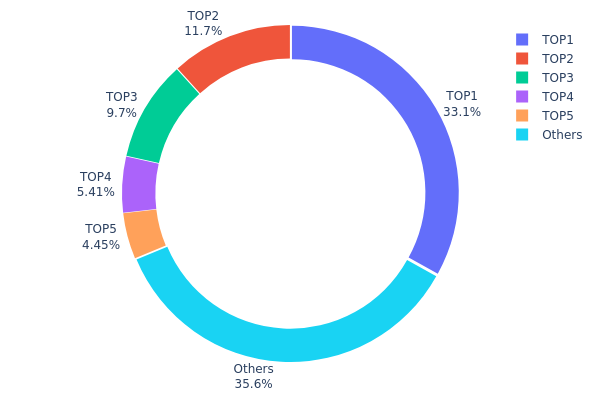
The address holdings distribution data for STB reveals a significant concentration of tokens among a few top addresses. The top holder possesses 33.06% of the total supply, while the top 5 addresses collectively control 64.35% of STB tokens. This high concentration suggests a potentially centralized ownership structure, which may impact market dynamics.
Such a concentrated distribution raises concerns about market manipulation and price volatility. The top holders have substantial influence over the token's supply, potentially affecting its price movements and overall market stability. This concentration also implies a lower level of decentralization, as a small number of entities hold significant control over the token's circulation.
However, it's worth noting that 35.65% of the tokens are distributed among other addresses, indicating some degree of wider ownership. This broader distribution may provide some balance to the market structure, although the influence of top holders remains a key factor to consider when assessing STB's market characteristics and potential risks.
Click to view the current STB Holdings Distribution
| Top | Address | Holding Qty | Holding (%) |
|---|---|---|---|
| 1 | 8Fv7wW...T4pnRd | 156772.46K | 33.06% |
| 2 | DQa7BN...iyVo5W | 55685.16K | 11.74% |
| 3 | 6WSnxM...WXchUB | 45988.12K | 9.69% |
| 4 | CqKDQS...NJJoVE | 25660.66K | 5.41% |
| 5 | u6PJ8D...ynXq2w | 21120.47K | 4.45% |
| - | Others | 168893.02K | 35.65% |
II. Core Factors Affecting STB's Future Price
Supply Mechanism
- Fixed Supply: STB has a fixed total supply, which can create scarcity and potentially support price stability.
- Historical Pattern: Limited supply has historically contributed to price appreciation in cryptocurrencies with fixed caps.
- Current Impact: The fixed supply may continue to exert upward pressure on STB's price, especially if demand increases.
Macroeconomic Environment
- Inflation Hedging Properties: As a cryptocurrency, STB may be viewed as a potential hedge against inflation, similar to other digital assets.
- Geopolitical Factors: Global economic uncertainties and geopolitical tensions could drive interest in cryptocurrencies like STB as alternative investments.
Technical Development and Ecosystem Building
- Ecosystem Applications: The development of DApps and projects within the STB ecosystem could enhance its utility and potentially drive demand.
III. STB Price Prediction for 2025-2030
2025 Outlook
- Conservative prediction: $0.00185 - $0.00280
- Neutral prediction: $0.00280 - $0.00322
- Optimistic prediction: $0.00322 - $0.00364 (requires favorable market conditions)
2027-2028 Outlook
- Market stage expectation: Potential growth phase with increased volatility
- Price range forecast:
- 2027: $0.00309 - $0.00459
- 2028: $0.00264 - $0.00473
- Key catalysts: Broader cryptocurrency market trends, STB ecosystem developments
2030 Long-term Outlook
- Base scenario: $0.00417 - $0.00448 (assuming steady market growth)
- Optimistic scenario: $0.00448 - $0.00596 (with strong STB adoption and favorable crypto climate)
- Transformative scenario: $0.00596+ (in case of breakthrough use cases or partnerships)
- 2030-12-31: STB $0.00596 (potential peak based on optimistic projections)
| 年份 | 预测最高价 | 预测平均价格 | 预测最低价 | 涨跌幅 |
|---|---|---|---|---|
| 2025 | 0.00364 | 0.0028 | 0.00185 | 0 |
| 2026 | 0.00335 | 0.00322 | 0.00302 | 15 |
| 2027 | 0.00459 | 0.00328 | 0.00309 | 17 |
| 2028 | 0.00473 | 0.00394 | 0.00264 | 40 |
| 2029 | 0.00464 | 0.00433 | 0.00373 | 54 |
| 2030 | 0.00596 | 0.00448 | 0.00417 | 60 |
IV. Professional STB Investment Strategies and Risk Management
STB Investment Methodology
(1) Long-term Holding Strategy
- Suitable for: Long-term investors with high risk tolerance
- Operation suggestions:
- Accumulate STB during market dips
- Monitor Solana ecosystem developments
- Store tokens in a secure non-custodial wallet
(2) Active Trading Strategy
- Technical analysis tools:
- Moving Averages: Use to identify trends and potential reversals
- RSI (Relative Strength Index): Monitor overbought/oversold conditions
- Key points for swing trading:
- Set clear entry and exit points
- Use stop-loss orders to manage risk
STB Risk Management Framework
(1) Asset Allocation Principles
- Conservative investors: 1-3% of crypto portfolio
- Aggressive investors: 5-10% of crypto portfolio
- Professional investors: Up to 15% of crypto portfolio
(2) Risk Hedging Solutions
- Diversification: Spread investments across multiple Solana ecosystem projects
- Stop-loss orders: Implement to limit potential losses
(3) Secure Storage Solutions
- Hot wallet recommendation: Gate web3 wallet
- Cold storage solution: Hardware wallet for long-term holdings
- Security precautions: Enable two-factor authentication, use strong passwords
V. Potential Risks and Challenges for STB
STB Market Risks
- High volatility: Price fluctuations can be extreme
- Liquidity risk: Limited trading volume may affect entry/exit
- Competition: Other DEXs on Solana may gain market share
STB Regulatory Risks
- Regulatory uncertainty: Potential for increased scrutiny of DeFi projects
- Compliance challenges: Evolving regulations may impact operations
- Cross-border restrictions: International regulatory differences may limit access
STB Technical Risks
- Smart contract vulnerabilities: Potential for exploits or bugs
- Solana network congestion: May affect transaction speed and costs
- Scalability challenges: Rapid growth could strain infrastructure
VI. Conclusion and Action Recommendations
STB Investment Value Assessment
STB shows potential as a innovative DEX on Solana, but faces significant competition and regulatory uncertainties. Long-term value depends on adoption and ecosystem growth, while short-term volatility remains high.
STB Investment Recommendations
✅ Beginners: Start with small positions, focus on learning the Solana ecosystem ✅ Experienced investors: Consider as part of a diversified Solana portfolio ✅ Institutional investors: Evaluate for potential DeFi exposure, conduct thorough due diligence
STB Participation Methods
- Spot trading: Available on Gate.com
- Yield farming: Explore liquidity provision opportunities on Stabble
- Staking: Participate in governance and earn rewards if available
Cryptocurrency investments carry extremely high risk, and this article does not constitute investment advice. Investors should make decisions based on their own risk tolerance and are advised to consult professional financial advisors. Never invest more than you can afford to lose.
FAQ
Can PlanB predict Bitcoin could reach $300000 by 2026?
Yes, PlanB's Stock-to-Flow model suggests Bitcoin could potentially reach $300,000 by 2026, based on historical price patterns and supply dynamics.
What crypto has the highest price prediction?
Bitcoin (BTC) is often predicted to have the highest future price among cryptocurrencies, with some analysts forecasting it could reach $500,000 or more by 2030.
What will be the price of shiba inu in 2025?
Based on market trends and expert predictions, Shiba Inu's price could reach $0.0001 by 2025, representing significant growth from its current value.
What is Bitcoin projected to be worth in 2025?
Bitcoin is projected to reach $150,000 to $200,000 by 2025, driven by increased institutional adoption and growing mainstream acceptance as a digital store of value.
Share
Content
Introduction: STB's Market Position and Investment Value
I. STB Price History Review and Current Market Status
II. Core Factors Affecting STB's Future Price
III. STB Price Prediction for 2025-2030
IV. Professional STB Investment Strategies and Risk Management
V. Potential Risks and Challenges for STB
VI. Conclusion and Action Recommendations
FAQ

