2025 INFRA Price Prediction: Bullish Outlook as Blockchain Adoption Accelerates
Introduction: INFRA's Market Position and Investment Value
Bware (INFRA), as a provider of high-end infrastructure and development tools in the Web3 space, has made significant strides since its inception in 2023. As of 2025, INFRA's market capitalization has reached $371,954, with a circulating supply of approximately 5,007,463 tokens, and a price hovering around $0.07428. This asset, known for its "fastest response time in Web3 infrastructure," is playing an increasingly crucial role in blockchain API services and decentralized infrastructure.
This article will comprehensively analyze INFRA's price trends from 2025 to 2030, combining historical patterns, market supply and demand, ecosystem development, and macroeconomic factors to provide investors with professional price predictions and practical investment strategies.
I. INFRA Price History Review and Current Market Status
INFRA Historical Price Evolution Trajectory
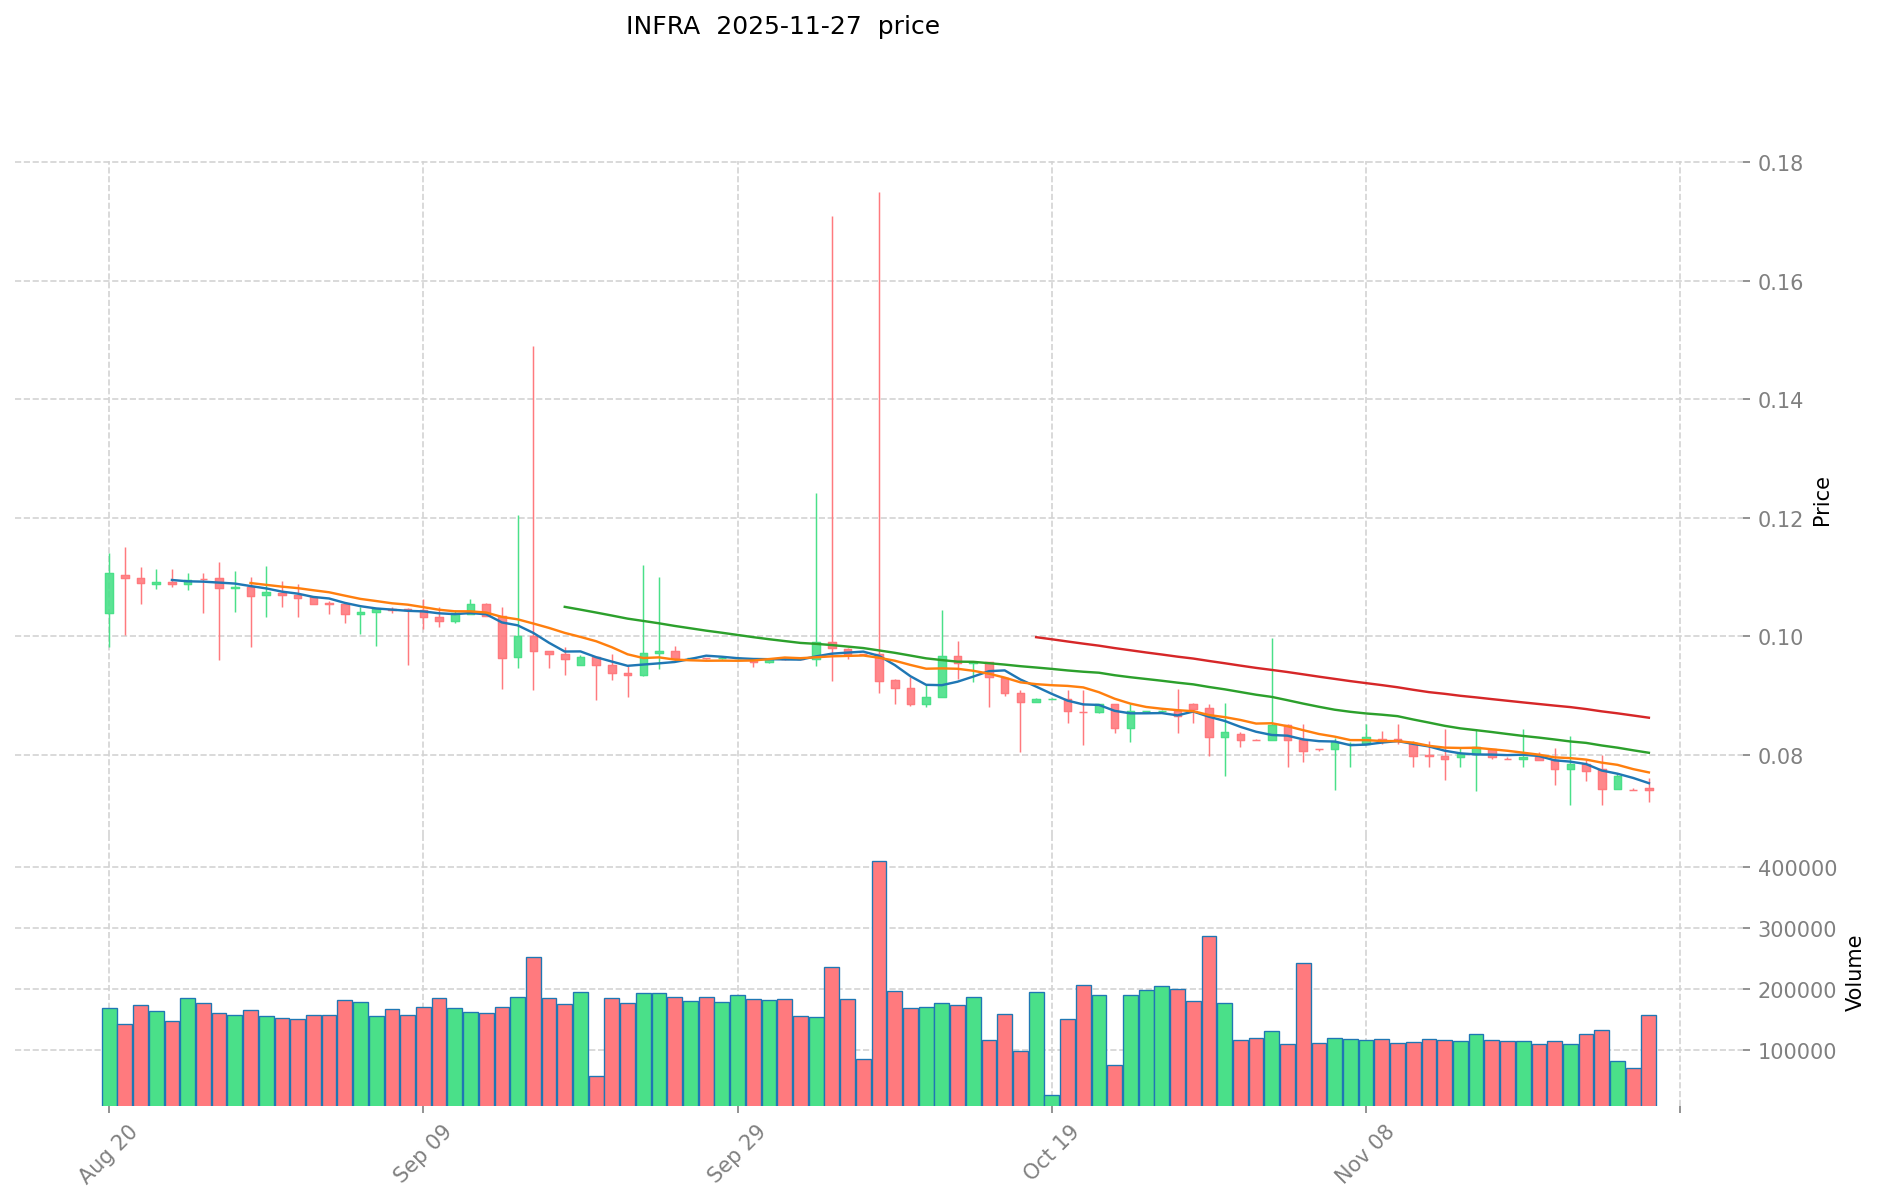
- 2024: INFRA reached its all-time high of $2.5433 on January 24, 2024, marking a significant milestone for the project.
- 2025: The market entered a bearish phase, with INFRA's price declining steadily throughout the year.
- 2025: INFRA hit its all-time low of $0.07146 on November 21, 2025, representing a substantial drop from its peak.
INFRA Current Market Situation
As of November 27, 2025, INFRA is trading at $0.07428, showing a slight decrease of 0.06% in the past 24 hours. The token's market capitalization stands at $371,954.35, with a circulating supply of 5,007,463 INFRA. The trading volume in the last 24 hours is $11,523.08, indicating moderate market activity. INFRA's price has experienced significant downward pressure over various timeframes, with a 6.26% decrease in the past week, a 15.75% drop over the last month, and a substantial 42.37% decline over the past year. The current price represents a 97.08% decrease from its all-time high, suggesting a prolonged bearish trend in the market.
Click to view the current INFRA market price
INFRA Market Sentiment Indicator
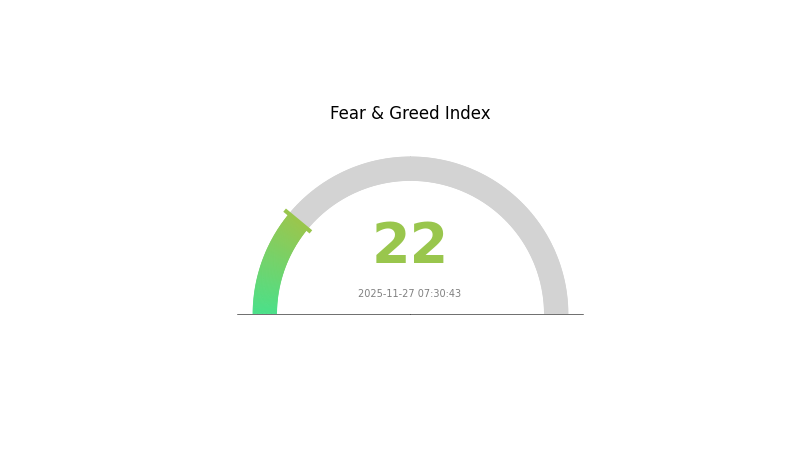
2025-11-27 Fear and Greed Index: 22 (Extreme Fear)
Click to view the current Fear & Greed Index
The crypto market is currently gripped by extreme fear, with the Fear and Greed Index plummeting to 22. This indicates a highly pessimistic sentiment among investors, potentially signaling oversold conditions. During such times, contrarian investors often see opportunities, as fear can lead to undervalued assets. However, caution is advised as market volatility may persist. It's crucial to conduct thorough research and consider your risk tolerance before making any investment decisions in this challenging market environment.
INFRA Holdings Distribution
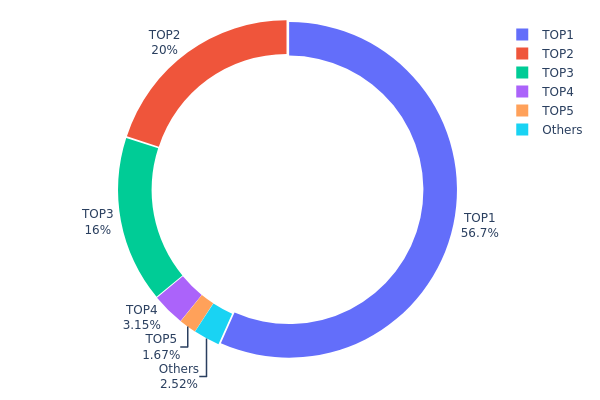
The address holdings distribution data for INFRA reveals a highly concentrated ownership structure. The top address holds a staggering 56.66% of the total supply, while the top three addresses collectively control 92.66% of all INFRA tokens. This level of concentration raises significant concerns about the token's decentralization and market stability.
Such a concentrated distribution could potentially lead to increased price volatility and susceptibility to market manipulation. With over half of the supply controlled by a single address, any large-scale movement or liquidation could dramatically impact INFRA's market price. Furthermore, the high concentration in the top addresses suggests that the token's governance and decision-making processes may be heavily influenced by a small number of large holders.
This centralized holding pattern indicates that INFRA's on-chain structure is currently unstable and lacks the widespread distribution typically associated with more mature and decentralized cryptocurrencies. Potential investors should be aware of these risks and the implications for INFRA's long-term sustainability and market behavior.
Click to view the current INFRA holdings distribution
| Top | Address | Holding Qty | Holding (%) |
|---|---|---|---|
| 1 | 0x8eb8...e3ab28 | 56665.70K | 56.66% |
| 2 | 0x65bc...dad3dd | 20000.00K | 20.00% |
| 3 | 0x831f...e7ff39 | 16000.00K | 16.00% |
| 4 | 0x0825...6db51f | 3145.00K | 3.14% |
| 5 | 0xd47f...ce4b9f | 1667.89K | 1.66% |
| - | Others | 2521.42K | 2.54% |
II. Key Factors Affecting INFRA's Future Price
Supply Mechanism
- Fixed Supply: INFRA has a fixed total supply, which creates scarcity and potentially supports long-term price appreciation.
Macroeconomic Environment
- Inflation Hedging Properties: As a cryptocurrency, INFRA may be viewed as a potential hedge against inflation, similar to other digital assets.
Technical Development and Ecosystem Building
- Ecosystem Applications: The INFRA ecosystem likely includes various DApps and projects built on its blockchain, which could drive adoption and value.
III. INFRA Price Prediction for 2025-2030
2025 Outlook
- Conservative forecast: $0.0385 - $0.07
- Neutral forecast: $0.07 - $0.074
- Optimistic forecast: $0.074 - $0.077 (requires favorable market conditions)
2027-2028 Outlook
- Market phase expectation: Potential growth phase
- Price range forecast:
- 2027: $0.07137 - $0.12574
- 2028: $0.06848 - $0.15487
- Key catalysts: Increasing adoption and technological advancements
2029-2030 Long-term Outlook
- Base scenario: $0.13011 - $0.13271 (assuming steady market growth)
- Optimistic scenario: $0.13531 - $0.142 (assuming strong market performance)
- Transformative scenario: $0.15 - $0.16 (assuming breakthrough innovations and widespread adoption)
- 2030-12-31: INFRA $0.13271 (78% increase from 2025)
| 年份 | 预测最高价 | 预测平均价格 | 预测最低价 | 涨跌幅 |
|---|---|---|---|---|
| 2025 | 0.077 | 0.07404 | 0.0385 | 0 |
| 2026 | 0.0944 | 0.07552 | 0.04456 | 1 |
| 2027 | 0.12574 | 0.08496 | 0.07137 | 14 |
| 2028 | 0.15487 | 0.10535 | 0.06848 | 41 |
| 2029 | 0.13531 | 0.13011 | 0.09368 | 75 |
| 2030 | 0.142 | 0.13271 | 0.09953 | 78 |
IV. INFRA Professional Investment Strategy and Risk Management
INFRA Investment Methodology
(1) Long-term Holding Strategy
- Suitable for: Long-term investors with high risk tolerance
- Operation suggestions:
- Accumulate INFRA tokens during market dips
- Set price targets for partial profit-taking
- Store tokens in secure wallets with private key control
(2) Active Trading Strategy
- Technical analysis tools:
- Moving Averages: Monitor short-term and long-term trends
- RSI: Identify overbought and oversold conditions
- Key points for swing trading:
- Set stop-loss orders to limit potential losses
- Take profits at predetermined resistance levels
INFRA Risk Management Framework
(1) Asset Allocation Principles
- Conservative investors: 1-3% of crypto portfolio
- Aggressive investors: 5-10% of crypto portfolio
- Professional investors: Up to 15% of crypto portfolio
(2) Risk Hedging Solutions
- Diversification: Spread investments across multiple crypto assets
- Stop-loss orders: Implement automatic sell orders to limit downside risk
(3) Secure Storage Solutions
- Hot wallet recommendation: Gate Web3 Wallet
- Cold storage solution: Hardware wallets for long-term holdings
- Security precautions: Enable two-factor authentication, use strong passwords
V. Potential Risks and Challenges for INFRA
INFRA Market Risks
- High volatility: Significant price fluctuations common in crypto markets
- Limited liquidity: Potential difficulty in executing large trades
- Competition: Emergence of new blockchain infrastructure projects
INFRA Regulatory Risks
- Uncertain regulations: Potential for unfavorable regulatory changes
- Cross-border compliance: Challenges in adhering to various jurisdictions
- Tax implications: Evolving tax treatment of crypto assets
INFRA Technical Risks
- Smart contract vulnerabilities: Potential for exploits or bugs
- Scalability challenges: Ability to handle increased network load
- Interoperability issues: Compatibility with other blockchain networks
VI. Conclusion and Action Recommendations
INFRA Investment Value Assessment
INFRA shows potential as a Web3 infrastructure solution, but faces significant competition and market volatility. Long-term value depends on adoption and technological advancements, while short-term risks include regulatory uncertainty and market sentiment shifts.
INFRA Investment Recommendations
✅ Beginners: Start with small positions, focus on education ✅ Experienced investors: Consider as part of a diversified crypto portfolio ✅ Institutional investors: Conduct thorough due diligence, monitor regulatory developments
INFRA Trading Participation Methods
- Spot trading: Buy and sell INFRA tokens on Gate.com
- Staking: Participate in staking programs if available
- DeFi integration: Explore decentralized finance opportunities involving INFRA
Cryptocurrency investments carry extremely high risks, and this article does not constitute investment advice. Investors should make decisions carefully based on their own risk tolerance and are advised to consult professional financial advisors. Never invest more than you can afford to lose.
FAQ
What is the future prediction of IRB Infra?
IRB Infra is expected to see steady growth, with potential price increases due to infrastructure developments and market expansion in the coming years.
What is the future target price?
The future target price for INFRA is projected to reach $0.50 by the end of 2026, based on current market trends and potential growth in the Web3 infrastructure sector.
What is the share price of infra?
As of November 27, 2025, INFRA's share price is $0.85. This price reflects recent market trends and project developments in the Web3 infrastructure sector.
What are analysts' predictions for GMR Infra?
Analysts predict GMR Infra's price may reach $0.15-$0.20 by 2026, driven by infrastructure projects and market expansion. However, forecasts vary and depend on market conditions.
Share
Content
Introduction: INFRA's Market Position and Investment Value
I. INFRA Price History Review and Current Market Status
II. Key Factors Affecting INFRA's Future Price
III. INFRA Price Prediction for 2025-2030
IV. INFRA Professional Investment Strategy and Risk Management
V. Potential Risks and Challenges for INFRA
VI. Conclusion and Action Recommendations
FAQ

