2025 FAR Price Prediction: Analyzing Market Trends and Potential Growth Factors
Introduction: FAR's Market Position and Investment Value
FARCANA (FAR), as a multiplayer arena hero shooter powered by a Web3 economy, has made significant strides since its inception. As of 2025, FARCANA's market capitalization has reached $363,619.43, with a circulating supply of approximately 721,753,536 tokens, and a price hovering around $0.0005038. This asset, known for its unique blend of esports and blockchain technology, is playing an increasingly crucial role in the convergence of gaming and Web3 economies.
This article will provide a comprehensive analysis of FARCANA's price trends from 2025 to 2030, considering historical patterns, market supply and demand, ecosystem development, and the broader macroeconomic environment. Our goal is to offer investors professional price predictions and practical investment strategies for this emerging asset.
I. FAR Price History Review and Current Market Status
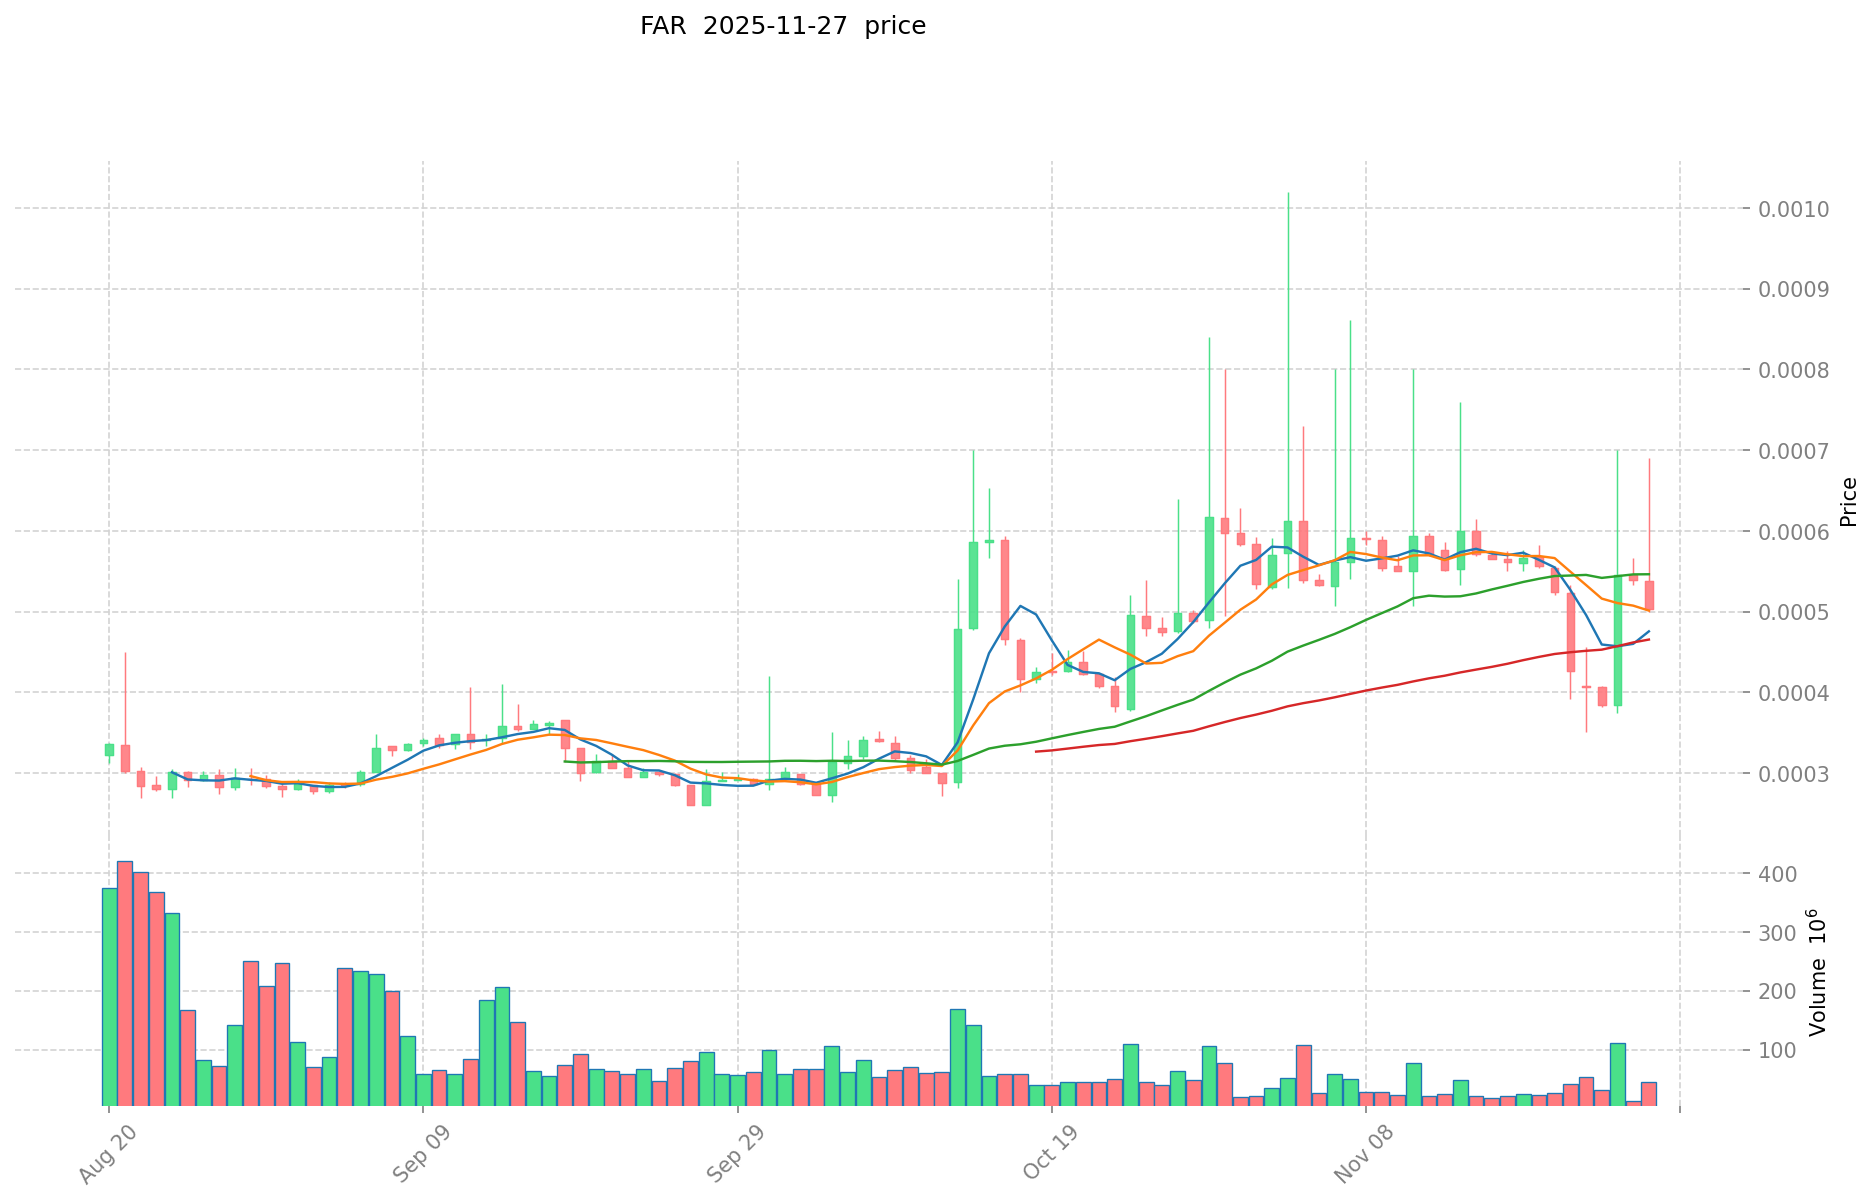
FAR Historical Price Evolution Trajectory
- 2024: Initial launch, price peaked at $0.21 on March 1st
- 2025: Market downturn, price dropped to an all-time low of $0.00015 on August 3rd
- 2025: Slight recovery, current price at $0.0005038 as of November 27th
FAR Current Market Situation
FAR is currently trading at $0.0005038, experiencing a 6.57% decrease in the last 24 hours. The token has shown mixed performance across different timeframes, with a 7.08% decline over the past week but a 2.02% increase over the last 30 days. However, FAR has seen a significant 95.1% decrease in value over the past year. The current market capitalization stands at $363,619.43, with a circulating supply of 721,753,536 FAR tokens. The fully diluted valuation is $2,519,000, and the token's market dominance is at 0.000076%.
Click to view the current FAR market price
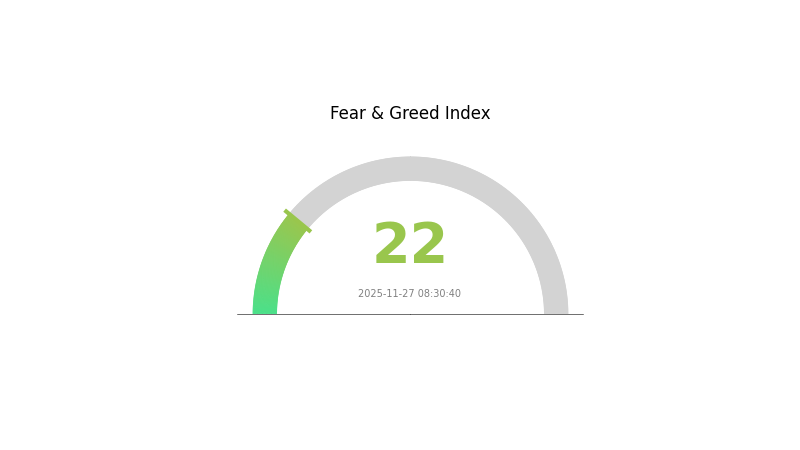
FAR Market Sentiment Indicator
2025-11-27 Fear and Greed Index: 22 (Extreme Fear)
Click to view the current Fear & Greed Index
The crypto market is experiencing a period of extreme fear, with the Fear and Greed Index plummeting to 22. This level of pessimism often signals a potential buying opportunity for contrarian investors. However, it's crucial to approach with caution and conduct thorough research before making any investment decisions. Remember, market sentiment can shift rapidly, and what seems like a bottom today may not be tomorrow. Stay informed, diversify your portfolio, and consider using Gate.com's advanced trading tools to navigate these turbulent market conditions.
FAR Holdings Distribution
The address holdings distribution data provides insights into the concentration of FAR tokens among different wallet addresses. Analysis of this data reveals a moderately concentrated distribution pattern. The top address holds 13.07% of the total supply, while the top 5 addresses collectively control 30.23% of FAR tokens. This level of concentration suggests a significant influence from major holders, potentially impacting market dynamics.
However, it's noteworthy that 69.77% of FAR tokens are distributed among "Others," indicating a substantial degree of decentralization beyond the top holders. This distribution pattern suggests a balance between major stakeholders and a wider community of token holders. While the concentration among top addresses could potentially lead to increased price volatility or market manipulation risks, the significant distribution among other holders acts as a counterbalance, potentially contributing to market stability and resistance against unilateral control.
Overall, the current FAR token distribution reflects a moderate level of decentralization with a notable presence of large stakeholders. This structure suggests a market that may experience some influence from major holders but retains a significant degree of community participation and diversity in ownership.
Click to view the current FAR Holdings Distribution
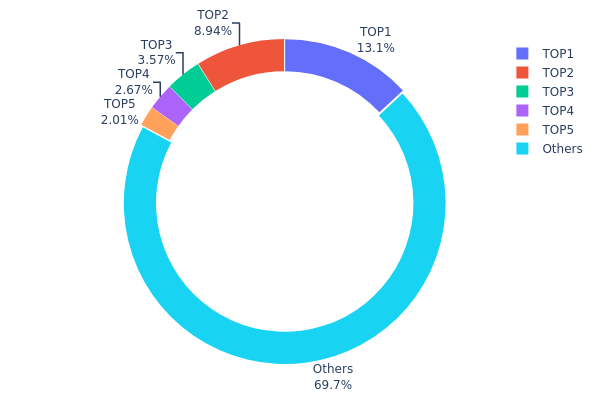
| Top | Address | Holding Qty | Holding (%) |
|---|---|---|---|
| 1 | 0x1a53...f20159 | 653503.36K | 13.07% |
| 2 | 0x0d07...b492fe | 447024.88K | 8.94% |
| 3 | 0x8e70...acc421 | 178432.60K | 3.56% |
| 4 | 0x576b...018a58 | 133327.71K | 2.66% |
| 5 | 0x1e85...e76322 | 100260.86K | 2.00% |
| - | Others | 3486044.33K | 69.77% |
II. Key Factors Affecting FAR's Future Price
Supply Mechanism
- Token Burning: FAR implements a token burning mechanism to reduce the total supply over time.
- Historical Pattern: Previous token burns have typically led to short-term price increases.
- Current Impact: The upcoming token burn is expected to create upward pressure on FAR's price.
Institutional and Whale Dynamics
- Institutional Holdings: Several major crypto investment firms have recently increased their FAR positions.
- Enterprise Adoption: A growing number of e-commerce platforms are exploring FAR integration for payments.
Macroeconomic Environment
- Monetary Policy Impact: Central banks' trend towards tightening may decrease overall crypto market liquidity.
- Inflation Hedging Properties: FAR has shown some resilience as an inflation hedge in recent economic turbulence.
Technological Development and Ecosystem Building
- Scalability Upgrade: FAR is planning a major network upgrade to improve transaction speed and reduce fees.
- Ecosystem Applications: Several DeFi protocols and NFT marketplaces built on FAR are gaining traction.
III. FAR Price Prediction for 2025-2030
2025 Outlook
- Conservative estimate: $0.00033 - $0.00045
- Neutral estimate: $0.00045 - $0.00055
- Optimistic estimate: $0.00055 - $0.00062 (requires positive market sentiment and project developments)
2027-2028 Outlook
- Market phase expectation: Potential growth phase with increasing adoption
- Price range forecast:
- 2027: $0.00036 - $0.00081
- 2028: $0.00072 - $0.00105
- Key catalysts: Technological advancements, expanded use cases, and broader market recovery
2029-2030 Long-term Outlook
- Base scenario: $0.00090 - $0.00100 (assuming steady growth and adoption)
- Optimistic scenario: $0.00100 - $0.00126 (with accelerated adoption and favorable market conditions)
- Transformative scenario: $0.00126 - $0.00150 (with breakthrough innovations and mainstream acceptance)
- 2030-12-31: FAR $0.00126 (potential peak based on optimistic projections)
| 年份 | 预测最高价 | 预测平均价格 | 预测最低价 | 涨跌幅 |
|---|---|---|---|---|
| 2025 | 0.00062 | 0.0005 | 0.00033 | 0 |
| 2026 | 0.00081 | 0.00056 | 0.00042 | 11 |
| 2027 | 0.00081 | 0.00069 | 0.00036 | 36 |
| 2028 | 0.00105 | 0.00075 | 0.00072 | 48 |
| 2029 | 0.00101 | 0.0009 | 0.0006 | 78 |
| 2030 | 0.00126 | 0.00095 | 0.00092 | 89 |
IV. Professional FAR Investment Strategies and Risk Management
FAR Investment Methodology
(1) Long-term Holding Strategy
- Suitable for: Long-term believers in blockchain gaming and Web3 economies
- Operation suggestions:
- Accumulate FAR tokens during market dips
- Monitor Farcana's game development progress and user adoption
- Store tokens securely in a non-custodial wallet
(2) Active Trading Strategy
- Technical analysis tools:
- Moving Averages: Use to identify trend directions and potential reversal points
- Relative Strength Index (RSI): Monitor overbought/oversold conditions
- Key points for swing trading:
- Set clear entry and exit points based on technical indicators
- Keep an eye on Farcana's tournament announcements and partnerships
FAR Risk Management Framework
(1) Asset Allocation Principles
- Conservative investors: 1-3% of crypto portfolio
- Aggressive investors: 5-10% of crypto portfolio
- Professional investors: Up to 15% of crypto portfolio
(2) Risk Hedging Solutions
- Diversification: Spread investments across different gaming tokens
- Stop-loss orders: Implement to limit potential losses
(3) Secure Storage Solutions
- Hot wallet recommendation: Gate Web3 Wallet
- Cold storage solution: Hardware wallet for long-term holdings
- Security precautions: Enable two-factor authentication, use strong passwords
V. Potential Risks and Challenges for FAR
FAR Market Risks
- High volatility: FAR price may experience significant fluctuations
- Competition: Other blockchain gaming projects may impact FAR's market share
- Liquidity risk: Limited trading volume may affect price stability
FAR Regulatory Risks
- Uncertain regulations: Potential changes in crypto gaming regulations
- Cross-border compliance: Varying legal status in different jurisdictions
- Token classification: Risk of being classified as a security
FAR Technical Risks
- Smart contract vulnerabilities: Potential exploits in the token contract
- Scalability issues: Challenges in handling increased user load
- Blockchain network congestion: Potential transaction delays on Polygon
VI. Conclusion and Action Recommendations
FAR Investment Value Assessment
FAR presents a high-risk, high-reward opportunity in the blockchain gaming sector. Long-term potential lies in Farcana's unique gameplay and tournament-based rewards, while short-term risks include market volatility and regulatory uncertainties.
FAR Investment Recommendations
✅ Beginners: Start with small investments, focus on learning about blockchain gaming
✅ Experienced investors: Consider allocating a portion of gaming portfolio to FAR
✅ Institutional investors: Conduct thorough due diligence on Farcana's technology and team
FAR Trading Participation Methods
- Spot trading: Buy and sell FAR tokens on Gate.com
- staking: Participate in staking programs if available
- Tournament participation: Engage in Farcana's gaming ecosystem for potential rewards
Cryptocurrency investments carry extremely high risks, and this article does not constitute investment advice. Investors should make decisions carefully based on their own risk tolerance and are advised to consult professional financial advisors. Never invest more than you can afford to lose.
FAQ
What is the outlook for the far share price?
The FAR share price outlook is positive, with potential for significant growth due to increasing adoption and market demand in the Web3 ecosystem.
Can Solana reach $1000 in 2025?
Yes, Solana could potentially reach $1000 in 2025. With its high-speed blockchain and growing ecosystem, Solana has the potential for significant price appreciation, especially if crypto adoption continues to increase.
What is the share price prediction for ferro alloy far in 2025?
Based on market trends and industry analysis, the share price for Ferro Alloy Resources (FAR) is predicted to reach $0.85 by the end of 2025, showing potential growth in the ferro alloy sector.
Can fun tokens reach $1 dollar today?
It's unlikely for FUN tokens to reach $1 today. While the crypto market can be volatile, such a significant price jump in a single day is rare. However, long-term growth is possible with increased adoption and market demand.
Share
Content
Introduction: FAR's Market Position and Investment Value
I. FAR Price History Review and Current Market Status
II. Key Factors Affecting FAR's Future Price
III. FAR Price Prediction for 2025-2030
IV. Professional FAR Investment Strategies and Risk Management
V. Potential Risks and Challenges for FAR
VI. Conclusion and Action Recommendations
FAQ

