2025 DRAC Price Prediction: Analyzing Market Trends and Potential Growth Factors for the Digital Asset
Introduction: DRAC's Market Position and Investment Value
DRAC (DRAC), as a BRC-20 meme token, has made significant strides since its inception in 2023. As of 2025, DRAC's market capitalization has reached $601,953.24, with a circulating supply of approximately 106,824,000 tokens, and a price hovering around $0.005635. This asset, often referred to as a "Bitcoin-based inscription," is playing an increasingly crucial role in the meme token and BRC-20 ecosystem.
This article will provide a comprehensive analysis of DRAC's price trends from 2025 to 2030, combining historical patterns, market supply and demand, ecosystem development, and macroeconomic factors to offer professional price predictions and practical investment strategies for investors.
I. DRAC Price History Review and Current Market Status
DRAC Historical Price Evolution
- 2023: Initial launch on May 10, price started at $0.000046
- 2023: Reached all-time high of $0.04844 on May 10, marking a significant spike
- 2023-2025: Experienced volatility, price fluctuated between the all-time high and low
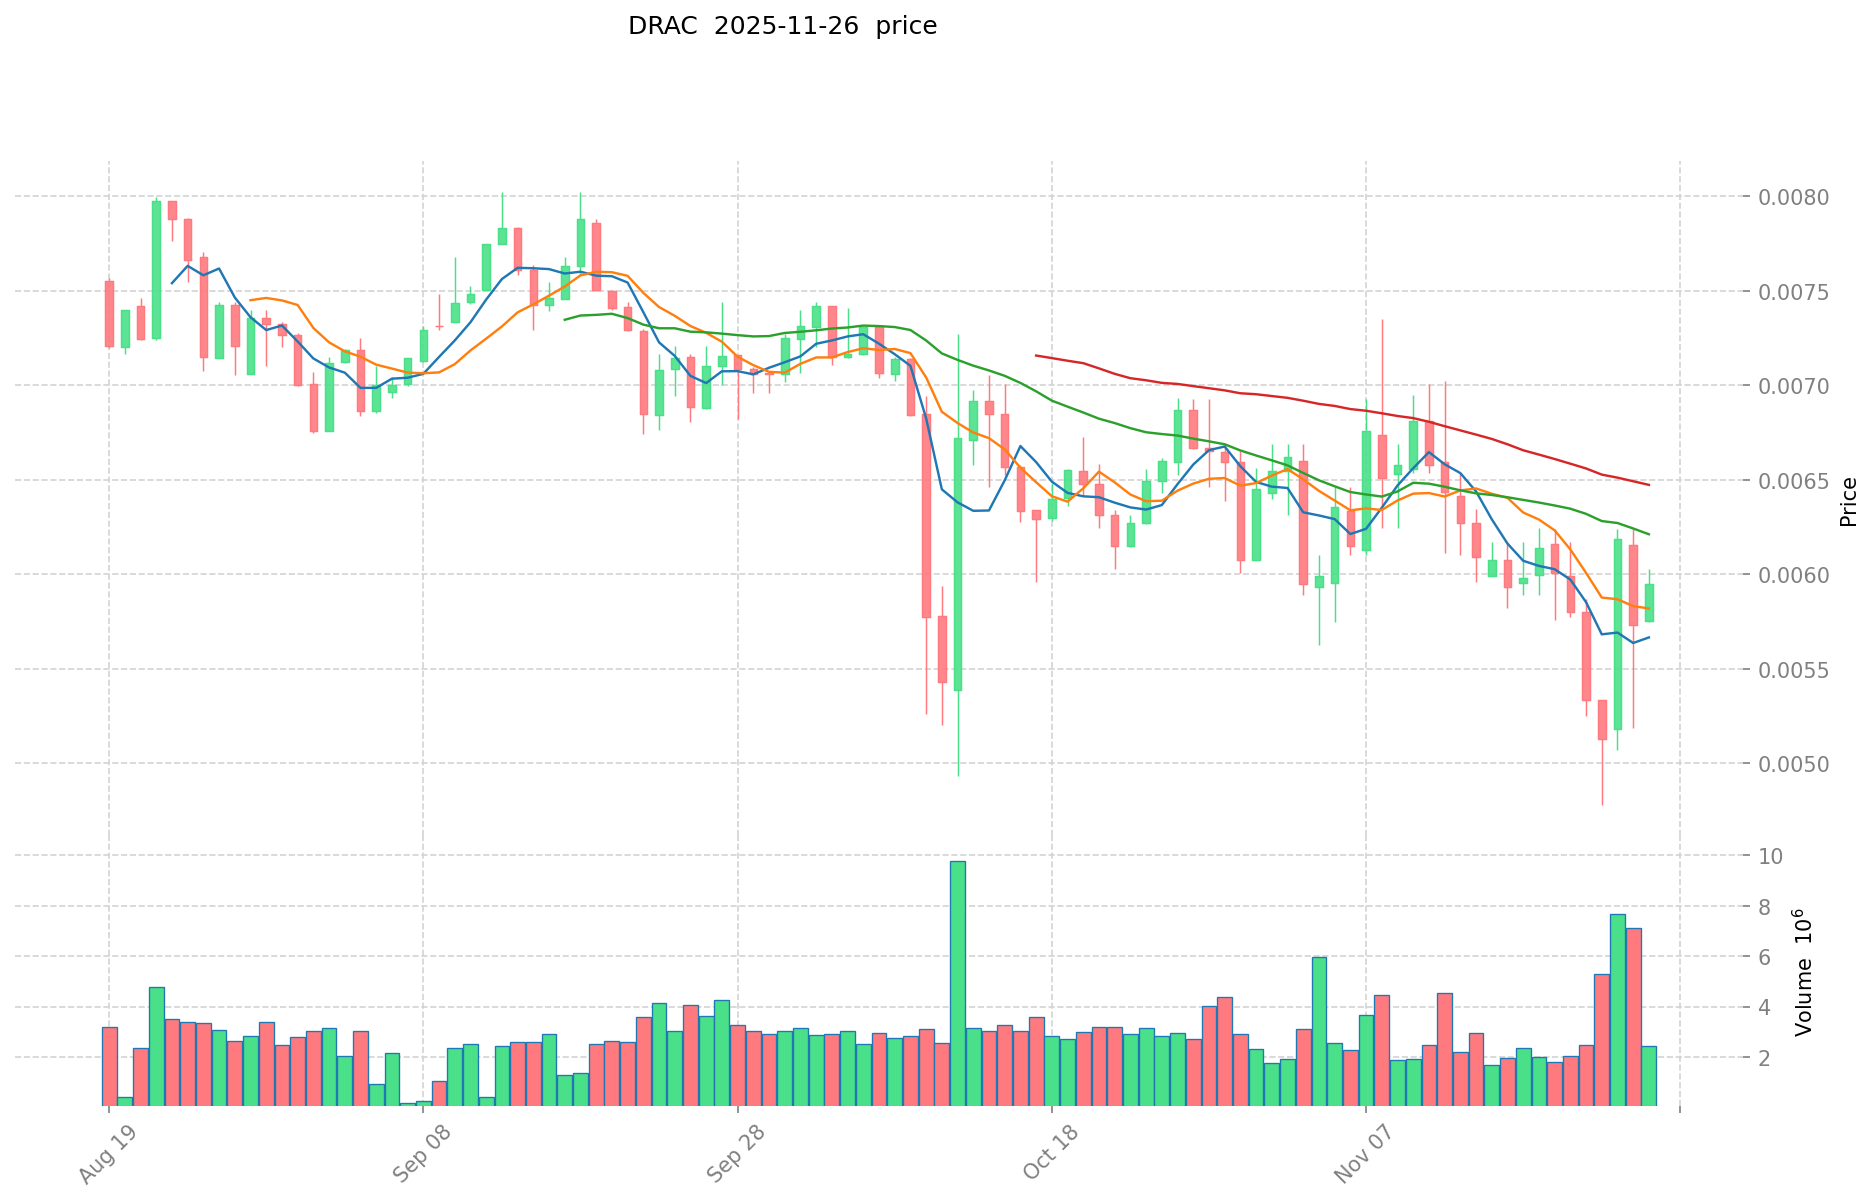
DRAC Current Market Situation
As of November 26, 2025, DRAC is trading at $0.005635. The token has seen a 24-hour decline of 4.57%, with the price ranging between a low of $0.00556 and a high of $0.006028. The current market cap stands at $601,953.24, with a circulating supply of 106,824,000 DRAC. The token's fully diluted valuation is $405,727.77, and it ranks 3073 in the cryptocurrency market.
Over the past week, DRAC has experienced a 6.36% decrease, while the 30-day performance shows a more significant drop of 16.72%. However, the yearly performance remains positive, with a 44.49% increase. The token's all-time high of $0.04844 was recorded on May 10, 2023, the same day as its all-time low of $0.000046.
Click to view the current DRAC market price
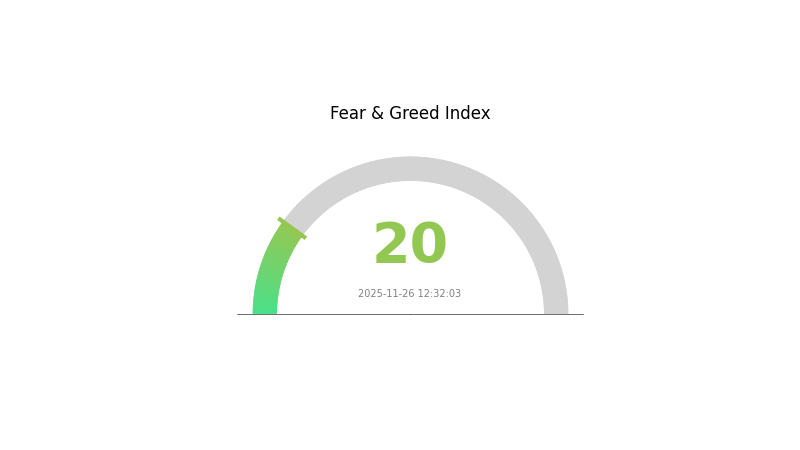
DRAC Market Sentiment Indicator
2025-11-26 Fear and Greed Index: 20 (Extreme Fear)
Click to view the current Fear & Greed Index
The cryptocurrency market is currently experiencing a state of extreme fear, with the Fear and Greed Index registering a low score of 20. This level of pessimism often indicates a potential buying opportunity for long-term investors, as markets tend to overreact to negative news. However, it's crucial to exercise caution and conduct thorough research before making any investment decisions. Remember that market sentiment can shift rapidly, and past performance doesn't guarantee future results.
DRAC Holdings Distribution
The address holdings distribution data provides insights into the concentration of DRAC tokens among different wallet addresses. According to the data, the top two addresses hold 9.83% and 9.68% of the total supply respectively, accounting for nearly 20% of all DRAC tokens. The next three largest holders possess between 1.27% and 2.25% each, while the remaining 75.67% is distributed among other addresses.
This distribution pattern suggests a moderate level of concentration, with a significant portion held by a few major addresses. While not excessively centralized, this structure could potentially impact market dynamics. The presence of large holders may introduce volatility risks, as substantial sales from these addresses could influence price movements. However, the fact that over 75% of tokens are distributed among numerous smaller holders indicates a degree of decentralization, which can contribute to market stability and resilience against individual manipulations.
The current holdings distribution reflects a balanced market structure for DRAC, combining elements of both centralization and decentralization. This hybrid structure may provide a foundation for liquidity while maintaining a diverse holder base, potentially supporting long-term ecosystem development and token utility.
Click to view the current DRAC Holdings Distribution
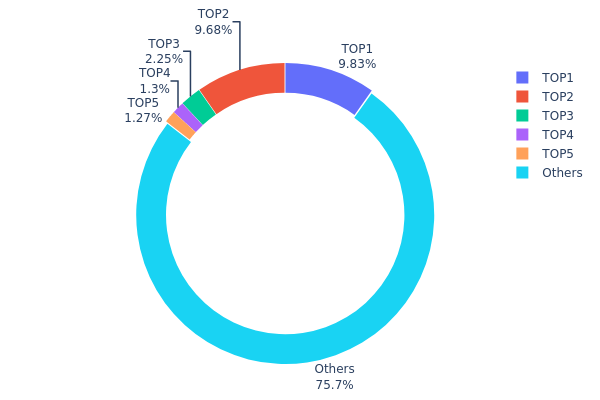
| Top | Address | Holding Qty | Holding (%) |
|---|---|---|---|
| 1 | 16G1xY...Vp9Wxh | 10504.40K | 9.83% |
| 2 | 1FJdZH...B9HgSf | 10344.88K | 9.68% |
| 3 | 14LEqn...F2UWYj | 2405.71K | 2.25% |
| 4 | 1CPu7W...dn92XA | 1393.26K | 1.30% |
| 5 | 1KMLqL...BvJHno | 1359.18K | 1.27% |
| - | Others | 80816.57K | 75.67% |
II. Core Factors Affecting DRAC's Future Price
Supply Mechanism
- Deflationary Model: DRAC implements a deflationary tokenomics model, which gradually reduces the total supply over time.
- Historical Patterns: Previous supply reductions have generally led to price increases due to increased scarcity.
- Current Impact: The ongoing deflationary mechanism is expected to continue supporting price stability and potential appreciation.
Institutional and Whale Dynamics
- Institutional Holdings: Several major cryptocurrency funds have included DRAC in their portfolios, indicating growing institutional interest.
- Corporate Adoption: Tech startups in the DeFi space have begun integrating DRAC into their platforms, expanding its utility.
Macroeconomic Environment
- Monetary Policy Impact: Central banks' potential shift towards tightening monetary policies may affect risk appetite for cryptocurrencies like DRAC.
- Inflation Hedge Properties: DRAC has shown some correlation with inflation hedging assets, potentially attracting investors during inflationary periods.
Technological Development and Ecosystem Building
- Layer 2 Integration: DRAC is planning to integrate with Layer 2 solutions to improve scalability and reduce transaction costs.
- Cross-chain Interoperability: Development of cross-chain bridges to enhance DRAC's accessibility across different blockchain networks.
- Ecosystem Applications: Several DeFi protocols and NFT marketplaces have adopted DRAC, expanding its use cases within the cryptocurrency ecosystem.
III. DRAC Price Prediction for 2025-2030
2025 Outlook
- Conservative forecast: $0.00384 - $0.00565
- Neutral forecast: $0.00565 - $0.00647
- Optimistic forecast: $0.00647 - $0.00729 (requires positive market sentiment and project developments)
2026-2028 Outlook
- Market stage expectation: Potential growth phase with increasing adoption
- Price range forecasts:
- 2026: $0.00343 - $0.00867
- 2027: $0.00530 - $0.01038
- 2028: $0.00745 - $0.01050
- Key catalysts: Technological advancements, expanding use cases, and overall crypto market trends
2029-2030 Long-term Outlook
- Base scenario: $0.00944 - $0.00993 (assuming steady project development and market growth)
- Optimistic scenario: $0.00993 - $0.01410 (with accelerated adoption and favorable market conditions)
- Transformative scenario: $0.01410+ (under extremely favorable conditions and breakthrough innovations)
- 2030-11-26: DRAC $0.00993 (potential stabilization after significant growth)
| 年份 | 预测最高价 | 预测平均价格 | 预测最低价 | 涨跌幅 |
|---|---|---|---|---|
| 2025 | 0.00729 | 0.00565 | 0.00384 | 0 |
| 2026 | 0.00867 | 0.00647 | 0.00343 | 14 |
| 2027 | 0.01038 | 0.00757 | 0.0053 | 34 |
| 2028 | 0.0105 | 0.00897 | 0.00745 | 59 |
| 2029 | 0.01013 | 0.00974 | 0.00944 | 72 |
| 2030 | 0.0141 | 0.00993 | 0.00824 | 76 |
IV. DRAC Professional Investment Strategies and Risk Management
DRAC Investment Methodology
(1) Long-term Holding Strategy
- Suitable for: Risk-tolerant investors with a long-term perspective
- Operation suggestions:
- Accumulate DRAC during market dips
- Set price targets for partial profit-taking
- Store tokens in a secure non-custodial wallet
(2) Active Trading Strategy
- Technical analysis tools:
- Moving Averages: Monitor short-term and long-term trends
- RSI: Identify overbought and oversold conditions
- Key points for swing trading:
- Set stop-loss orders to limit potential losses
- Take profits at predetermined resistance levels
DRAC Risk Management Framework
(1) Asset Allocation Principles
- Conservative investors: 1-3%
- Aggressive investors: 5-10%
- Professional investors: 10-15%
(2) Risk Hedging Solutions
- Diversification: Spread investments across multiple cryptocurrencies
- Stop-loss orders: Implement to limit potential losses
(3) Secure Storage Solutions
- Hot wallet recommendation: Gate Web3 Wallet
- Cold storage solution: Hardware wallet for long-term holdings
- Security precautions: Enable two-factor authentication, use strong passwords
V. DRAC Potential Risks and Challenges
DRAC Market Risks
- High volatility: Price fluctuations can be extreme
- Limited liquidity: May affect ability to enter or exit positions
- Market sentiment: Susceptible to rapid changes in investor sentiment
DRAC Regulatory Risks
- Uncertain regulatory landscape: Potential for stricter regulations
- Cross-border restrictions: Varying legal status in different jurisdictions
- Compliance challenges: Evolving KYC/AML requirements
DRAC Technical Risks
- Smart contract vulnerabilities: Potential for exploits or bugs
- Network congestion: May affect transaction speed and costs
- Scalability issues: Limitations in handling increased transaction volume
VI. Conclusion and Action Recommendations
DRAC Investment Value Assessment
DRAC presents a high-risk, high-reward opportunity in the BRC-20 token space. While it offers potential for significant returns, investors must be prepared for extreme volatility and regulatory uncertainties.
DRAC Investment Recommendations
✅ Beginners: Allocate only a small portion of portfolio, focus on education
✅ Experienced investors: Consider as part of a diversified crypto portfolio
✅ Institutional investors: Conduct thorough due diligence, implement robust risk management
DRAC Trading Participation Methods
- Spot trading: Available on Gate.com
- DeFi platforms: Participate in liquidity pools or yield farming
- OTC trading: For large volume transactions
Cryptocurrency investments carry extremely high risks, and this article does not constitute investment advice. Investors should make decisions carefully based on their own risk tolerance and are advised to consult professional financial advisors. Never invest more than you can afford to lose.
FAQ
What is the best AI crypto prediction for 2030?
The best AI crypto prediction for 2030 suggests a significant market growth, with leading AI cryptocurrencies potentially reaching $50,000 to $100,000 per coin.
What crypto has the highest price prediction?
Bitcoin (BTC) is often predicted to have the highest future price among cryptocurrencies, with some analysts forecasting it could reach $500,000 or more by 2030.
What will CRO be worth in 5 years?
Based on market trends and potential growth, CRO could reach $2-$3 in 5 years, driven by increased adoption and ecosystem expansion.
What is the future of DCR coin?
DCR coin has a promising future with potential for growth. Its unique hybrid consensus mechanism and focus on governance may drive adoption and value increase in the coming years.
Share
Content
Introduction: DRAC's Market Position and Investment Value
I. DRAC Price History Review and Current Market Status
II. Core Factors Affecting DRAC's Future Price
III. DRAC Price Prediction for 2025-2030
IV. DRAC Professional Investment Strategies and Risk Management
V. DRAC Potential Risks and Challenges
VI. Conclusion and Action Recommendations
FAQ

