2025 DERI Price Prediction: Analyzing Market Trends and Potential Growth Factors for the DeFi Derivative Token
Introduction: DERI's Market Position and Investment Value
Deri Protocol (DERI), as a decentralized protocol for risk exposure trading, has been making waves in the DeFi space since its inception. As of 2025, DERI's market capitalization stands at $438,968, with a circulating supply of approximately 131,192,006 tokens, and a price hovering around $0.003346. This asset, often referred to as a "capital-efficient risk trading solution," is playing an increasingly crucial role in the decentralized derivatives market.
This article will provide a comprehensive analysis of DERI's price trends from 2025 to 2030, considering historical patterns, market supply and demand, ecosystem development, and macroeconomic factors to offer professional price predictions and practical investment strategies for investors.
I. DERI Price History Review and Current Market Status
DERI Historical Price Evolution
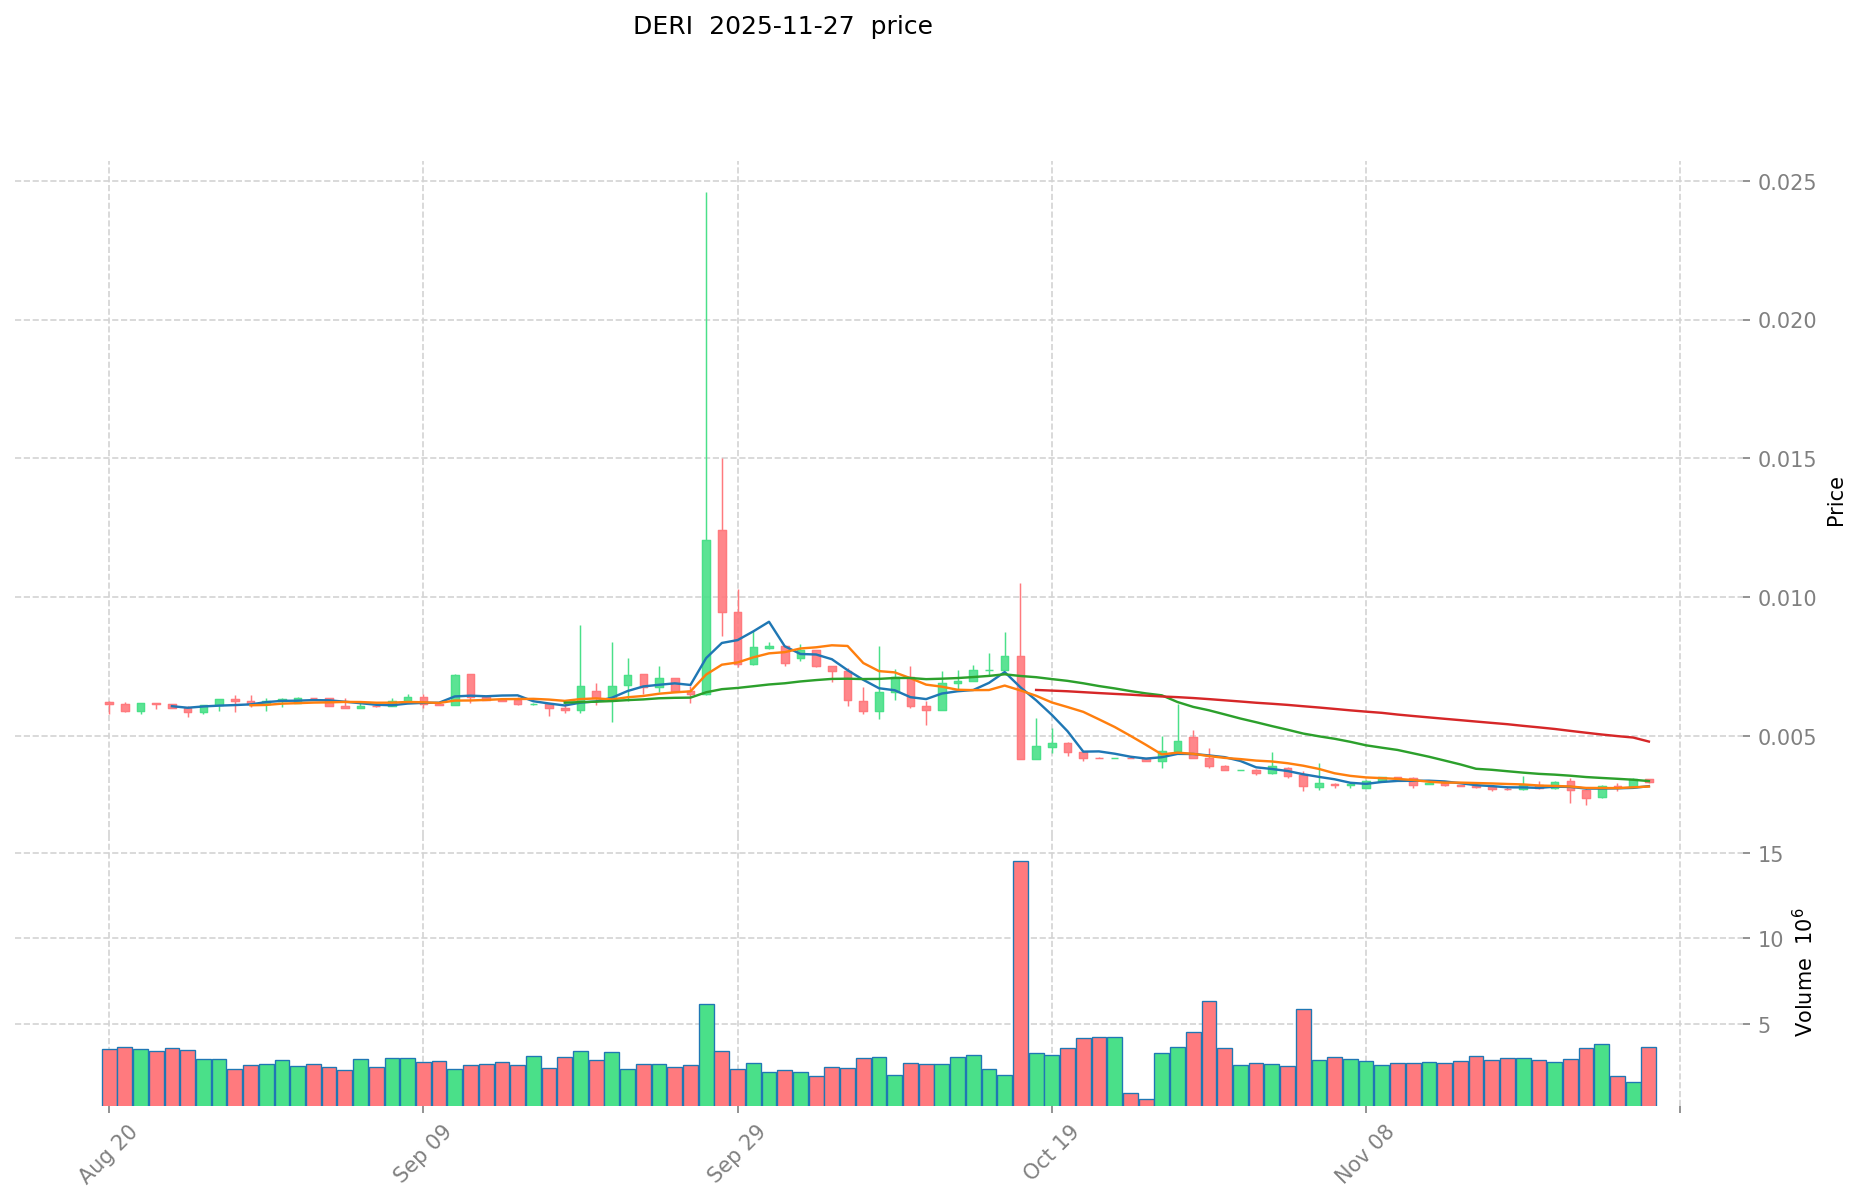
- 2021: DERI reached its all-time high of $3.77 on February 13, marking a significant milestone
- 2022-2024: Gradual decline in price as the crypto market entered a bearish phase
- 2025: DERI hit its all-time low of $0.00200107 on September 1, reflecting severe market downturn
DERI Current Market Situation
As of November 27, 2025, DERI is trading at $0.003346. The token has experienced a 2.93% decrease in the last 24 hours, with a trading volume of $12,525.35. DERI's current market cap stands at $438,968.45, ranking it at 3373 in the global cryptocurrency market. The circulating supply is 131,192,006.31 DERI, which represents 26.75% of the total supply of 490,441,296.59 DERI. Despite a recent 7-day increase of 7.63%, DERI has seen significant losses over longer periods, with a 32.42% decrease in the past 30 days and a 65.79% drop over the last year.
Click to view the current DERI market price
DERI Market Sentiment Indicator
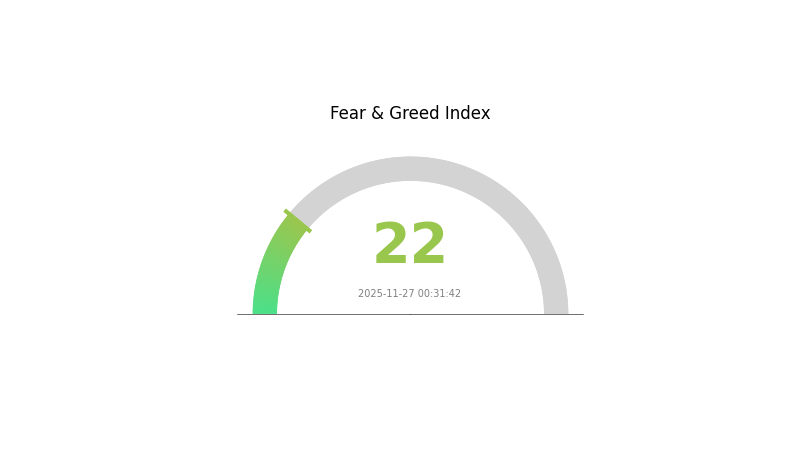
2025-11-27 Fear and Greed Index: 22 (Extreme Fear)
Click to view the current Fear & Greed Index
The crypto market is currently experiencing a state of extreme fear, with the Fear and Greed Index plummeting to 22. This significant drop signals heightened investor anxiety and pessimism. During such periods, assets may be undervalued as panic selling often occurs. However, seasoned investors might view this as a potential buying opportunity, adhering to the contrarian strategy of "be fearful when others are greedy, and greedy when others are fearful." Traders should exercise caution and conduct thorough research before making any decisions in this volatile market environment.
DERI Holdings Distribution
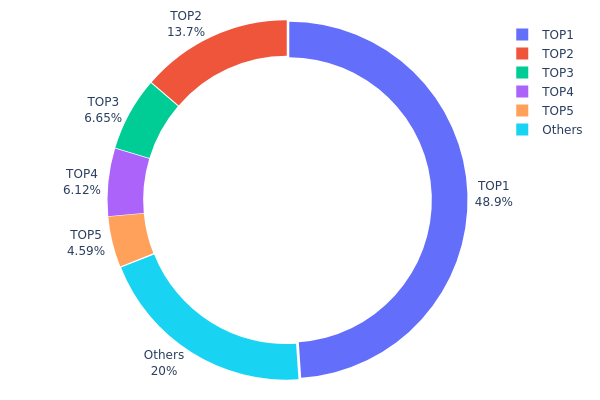
The address holdings distribution data for DERI reveals a highly concentrated ownership structure. The top address holds a staggering 48.93% of the total supply, while the top 5 addresses collectively control 79.95% of all DERI tokens. This level of concentration raises concerns about potential market manipulation and volatility.
Such a concentrated distribution can have significant implications for DERI's market dynamics. The dominance of a few large holders may lead to increased price volatility, as any substantial movement from these addresses could dramatically impact the market. Furthermore, this concentration potentially undermines the project's decentralization efforts and may pose risks to the overall stability of the DERI ecosystem.
The current address distribution reflects a market structure that is vulnerable to the actions of a small number of players. While this concentration might provide some short-term price stability, it also introduces long-term risks and may deter broader adoption among retail investors who may be concerned about potential market manipulation by these large holders.
Click to view the current DERI holdings distribution
| Top | Address | Holding Qty | Holding (%) |
|---|---|---|---|
| 1 | 0x96de...fe25d6 | 240000.00K | 48.93% |
| 2 | 0xbf15...5f5044 | 67141.07K | 13.68% |
| 3 | 0xa3a7...d60eec | 32627.20K | 6.65% |
| 4 | 0x1383...8f17bc | 30000.00K | 6.11% |
| 5 | 0x0000...00dead | 22504.54K | 4.58% |
| - | Others | 98168.49K | 20.05% |
II. Key Factors Influencing DERI's Future Price
Technical Development and Ecosystem Building
- Ecosystem Applications: DERI Protocol is a key project in the decentralized derivatives trading ecosystem, providing various DApps and protocols for options and futures trading.
III. DERI Price Prediction for 2025-2030
2025 Outlook
- Conservative forecast: $0.00211 - $0.00335
- Neutral forecast: $0.00335 - $0.00395
- Optimistic forecast: $0.00395 - $0.00455 (requires positive market sentiment and project developments)
2026-2028 Outlook
- Market phase expectation: Gradual growth and consolidation
- Price range predictions:
- 2026: $0.00367 - $0.0045
- 2027: $0.00254 - $0.0057
- 2028: $0.00268 - $0.00561
- Key catalysts: Increased adoption, technological improvements, and overall crypto market recovery
2029-2030 Long-term Outlook
- Base scenario: $0.00529 - $0.00632 (assuming steady market growth)
- Optimistic scenario: $0.00632 - $0.00735 (with strong project performance and market favor)
- Transformative scenario: $0.00735 - $0.00809 (with major breakthroughs and widespread adoption)
- 2030-12-31: DERI $0.00809 (potential peak based on optimistic projections)
| 年份 | 预测最高价 | 预测平均价格 | 预测最低价 | 涨跌幅 |
|---|---|---|---|---|
| 2025 | 0.00455 | 0.00335 | 0.00211 | 0 |
| 2026 | 0.0045 | 0.00395 | 0.00367 | 18 |
| 2027 | 0.0057 | 0.00423 | 0.00254 | 26 |
| 2028 | 0.00561 | 0.00497 | 0.00268 | 48 |
| 2029 | 0.00735 | 0.00529 | 0.00296 | 58 |
| 2030 | 0.00809 | 0.00632 | 0.00556 | 88 |
IV. DERI Professional Investment Strategies and Risk Management
DERI Investment Methodology
(1) Long-term Holding Strategy
- Suitable for: Risk-tolerant investors with a long-term perspective
- Operational suggestions:
- Accumulate DERI tokens during market dips
- Hold for at least 1-2 years to ride out market volatility
- Store tokens in a secure non-custodial wallet
(2) Active Trading Strategy
- Technical analysis tools:
- Moving Averages: Use to identify trends and potential reversal points
- RSI (Relative Strength Index): Monitor overbought/oversold conditions
- Key points for swing trading:
- Set clear entry and exit points based on technical indicators
- Use stop-loss orders to manage risk
DERI Risk Management Framework
(1) Asset Allocation Principles
- Conservative investors: 1-3% of crypto portfolio
- Aggressive investors: 5-10% of crypto portfolio
- Professional investors: Up to 15% of crypto portfolio
(2) Risk Hedging Solutions
- Diversification: Spread investments across multiple crypto assets
- Options strategies: Use options to hedge against potential price drops
(3) Secure Storage Solutions
- Hot wallet recommendation: Gate Web3 Wallet
- Cold storage solution: Hardware wallet for long-term holdings
- Security precautions: Enable two-factor authentication, use strong passwords
V. Potential Risks and Challenges for DERI
DERI Market Risks
- High volatility: DERI price may experience significant fluctuations
- Low liquidity: Limited trading volume may impact ease of entry/exit
- Market sentiment: Susceptible to broader crypto market trends
DERI Regulatory Risks
- Uncertain regulatory landscape: Potential for stricter regulations on DeFi protocols
- Cross-border compliance: Challenges in adhering to varying international regulations
- Legal classification: Risk of being classified as a security in some jurisdictions
DERI Technical Risks
- Smart contract vulnerabilities: Potential for exploits in the protocol's code
- Scalability issues: May face challenges in handling increased user activity
- Interoperability concerns: Compatibility issues with other blockchain networks
VI. Conclusion and Action Recommendations
DERI Investment Value Assessment
DERI offers exposure to the growing DeFi derivatives market but carries significant risks due to its low market cap and high volatility. Long-term potential exists if the protocol gains adoption, but short-term price movements may be unpredictable.
DERI Investment Recommendations
✅ Beginners: Consider small, experimental positions after thorough research ✅ Experienced investors: Allocate a small portion of high-risk portfolio, use risk management tools ✅ Institutional investors: Evaluate for potential inclusion in diversified DeFi-focused portfolios
DERI Trading Participation Methods
- Spot trading: Purchase DERI tokens on Gate.com
- Limit orders: Set buy/sell orders at desired price levels
- DeFi staking: Explore staking options within the Deri Protocol ecosystem
Cryptocurrency investment carries extremely high risk. This article does not constitute investment advice. Investors should make decisions carefully based on their own risk tolerance and are advised to consult professional financial advisors. Never invest more than you can afford to lose.
FAQ
How high can a render token go?
Render token could potentially reach $10-$15 by 2025, driven by increased adoption of 3D rendering and AI technologies in various industries.
Does dYdX have a future?
Yes, dYdX has a promising future. As a leading decentralized exchange, it's well-positioned to capitalize on the growing DeFi market and continue innovating in crypto derivatives trading.
What crypto has the highest price prediction?
Bitcoin (BTC) is often predicted to have the highest future price among cryptocurrencies, with some analysts forecasting it could reach $500,000 or more by 2030.
What is the price prediction for Dai in 2030?
Based on market trends and expert analysis, Dai is predicted to maintain its $1 peg in 2030, with potential slight fluctuations within a narrow range of $0.99 to $1.01.
Share
Content
Introduction: DERI's Market Position and Investment Value
I. DERI Price History Review and Current Market Status
II. Key Factors Influencing DERI's Future Price
III. DERI Price Prediction for 2025-2030
IV. DERI Professional Investment Strategies and Risk Management
V. Potential Risks and Challenges for DERI
VI. Conclusion and Action Recommendations
FAQ

