2025 AVC Price Prediction: Analyzing Market Trends and Future Prospects for AVC Tokens
Introduction: AVC's Market Position and Investment Value
AlterVerse (AVC), as a decentralized metaverse project built on blockchain technology, has been empowering users with unique and immersive digital world experiences since its inception. As of 2025, AVC's market capitalization has reached $264,779.90, with a circulating supply of approximately 959,000,000 tokens, and a price hovering around $0.0002761. This asset, often referred to as a "virtual universe enabler," is playing an increasingly crucial role in the fields of gaming, NFTs, and decentralized finance (DeFi).
This article will provide a comprehensive analysis of AVC's price trends from 2025 to 2030, combining historical patterns, market supply and demand, ecosystem development, and macroeconomic factors to offer professional price predictions and practical investment strategies for investors.
I. AVC Price History Review and Current Market Status
AVC Historical Price Evolution Trajectory
- 2024: Initial launch, price peaked at $0.019 (all-time high)
- 2025: Market downturn, price dropped to $0.0001234 (all-time low)
AVC Current Market Situation
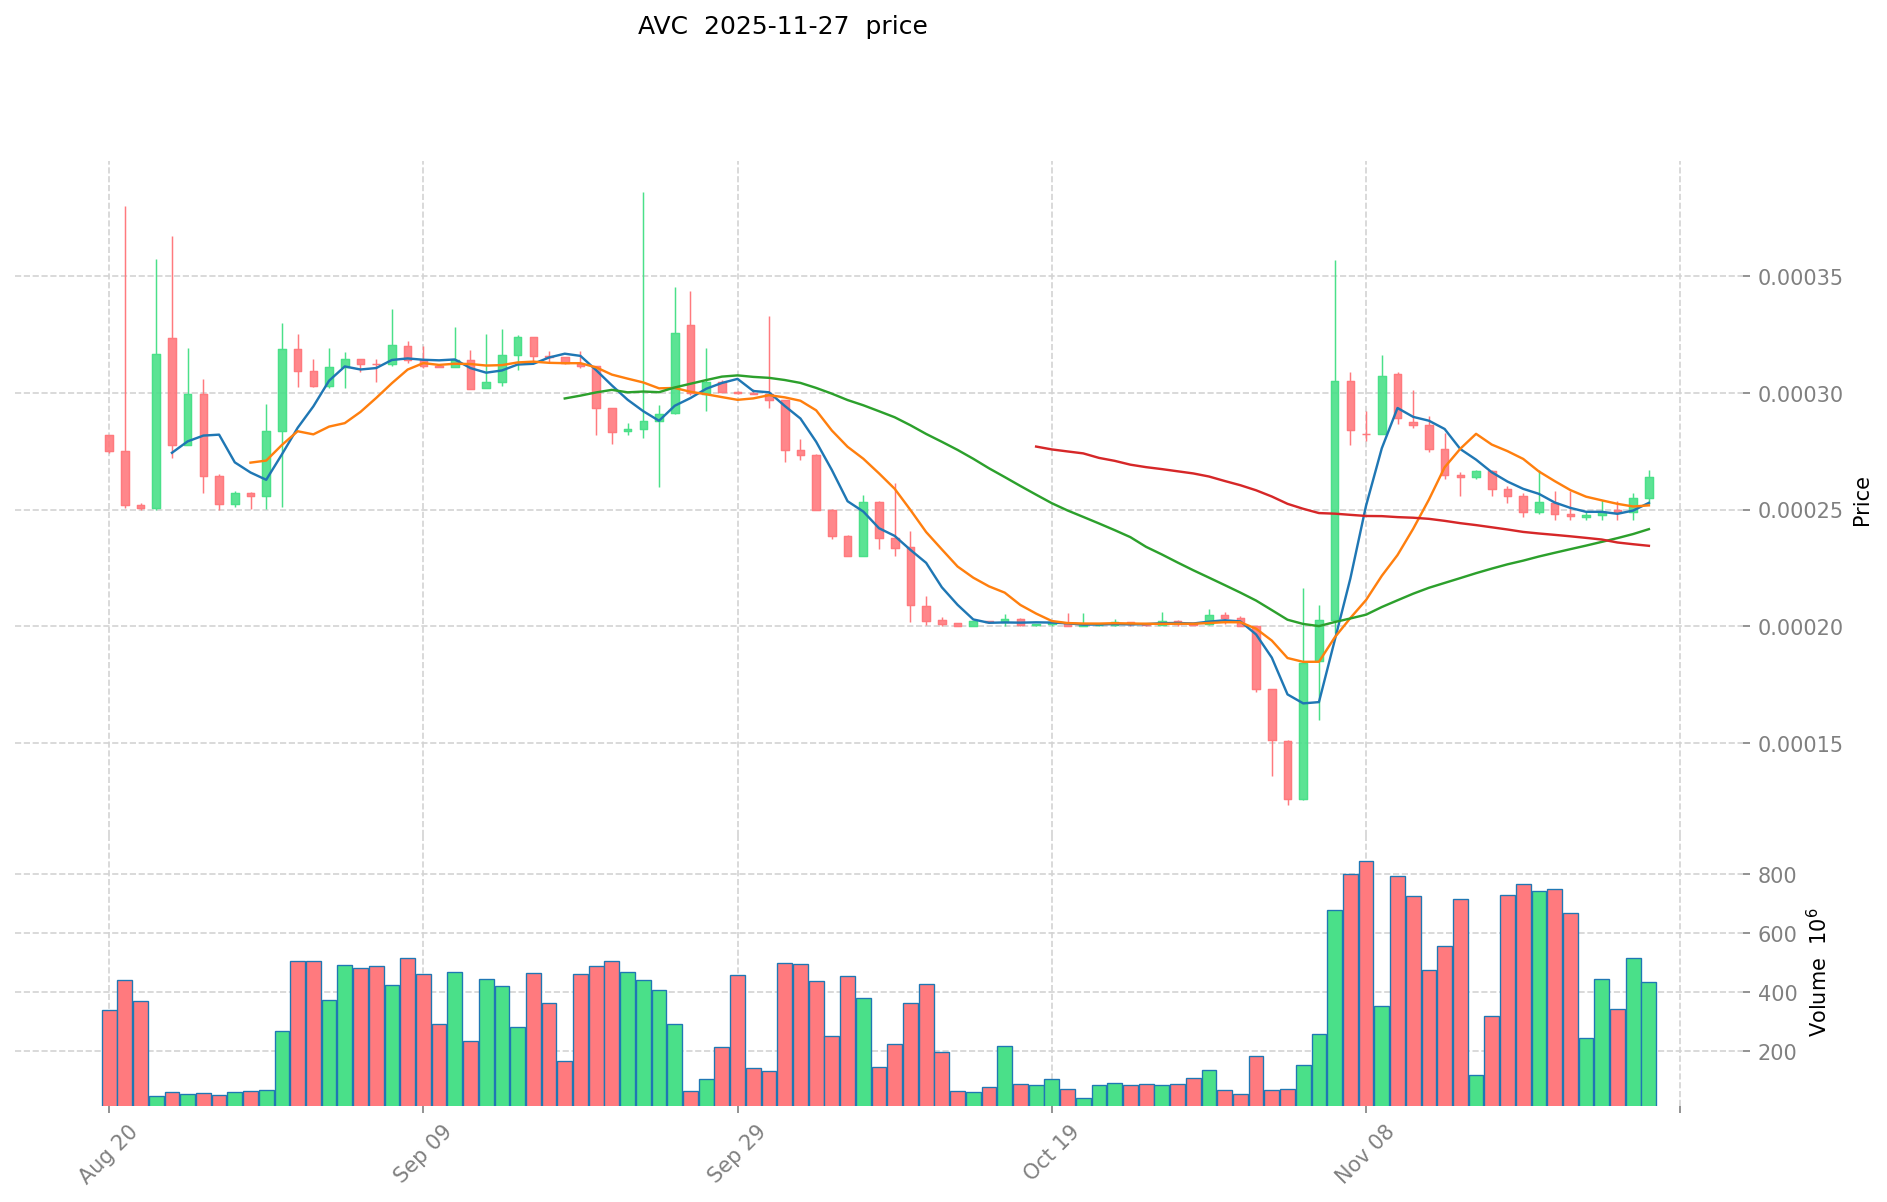
As of November 28, 2025, AVC is trading at $0.0002761, showing signs of recovery from its all-time low. The token has experienced significant price movements in recent periods:
- 1-hour change: -0.29%
- 24-hour change: +4.78%
- 7-day change: +11.46%
- 30-day change: +37.5%
Despite the recent positive momentum, AVC is still down 99.33% from its all-time high set in December 2024. The current market capitalization stands at $264,779.90, with a circulating supply of 959,000,000 AVC tokens. The fully diluted market cap is $2,761,000.
Trading volume in the last 24 hours reached $72,781.72, indicating moderate market activity. The token's market dominance is currently at 0.000083%, reflecting its relatively small position in the overall cryptocurrency market.
Click to view the current AVC market price
AVC Market Sentiment Indicator
2025-11-27 Fear and Greed Index: 22 (Extreme Fear)
Click to view the current Fear & Greed Index
The crypto market is currently gripped by extreme fear, with the Fear and Greed Index plummeting to 22. This significant drop signals a highly pessimistic sentiment among investors, potentially indicating oversold conditions. While such extreme fear often precedes market bottoms, it's crucial to approach with caution. Savvy traders might see this as an opportunity to accumulate, adhering to the contrarian principle of "be fearful when others are greedy, and greedy when others are fearful." However, always conduct thorough research and manage risks carefully in these volatile times.

AVC Holdings Distribution
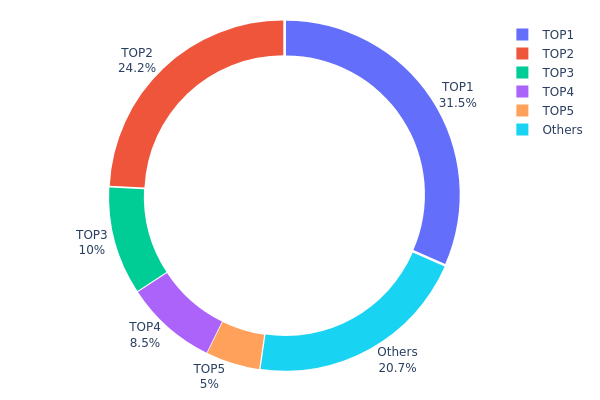
The address holdings distribution data provides crucial insights into the concentration of AVC tokens among different addresses. Analysis of this data reveals a highly concentrated distribution pattern. The top five addresses collectively hold 79.26% of the total AVC supply, with the largest address controlling 31.54% alone. This level of concentration raises concerns about potential market manipulation and price volatility.
Such a concentrated distribution structure could significantly impact market dynamics. The top holders have substantial influence over the token's supply and demand, potentially leading to increased price fluctuations or coordinated market movements. This concentration also implies a lower degree of decentralization, which may be at odds with the principles of many cryptocurrency projects.
From a market structure perspective, this distribution suggests a relatively immature ecosystem for AVC. The high concentration in a few addresses indicates limited circulation and adoption among a broader user base. This could pose challenges for liquidity and may deter some investors concerned about potential whale manipulation. However, it's worth noting that 20.74% of the supply is distributed among other addresses, which could provide some level of market stability and diversity.
Click to view the current AVC Holdings Distribution
| Top | Address | Holding Qty | Holding (%) |
|---|---|---|---|
| 1 | 0x7da0...af7e94 | 3154310.01K | 31.54% |
| 2 | 0xa728...ef43f9 | 2422132.18K | 24.22% |
| 3 | 0x0aa5...65b668 | 1000000.00K | 10.00% |
| 4 | 0xa373...ee3b99 | 850000.00K | 8.50% |
| 5 | 0xe595...d677fd | 500000.00K | 5.00% |
| - | Others | 2073557.81K | 20.74% |
II. Key Factors Affecting AVC's Future Price
Macroeconomic Environment
- Inflation Hedging Properties: As a cryptocurrency, AVC may potentially serve as a hedge against inflation in certain economic conditions. However, its effectiveness as an inflation hedge would depend on various factors and market dynamics.
Technological Development and Ecosystem Building
- Ecosystem Applications: The development of decentralized applications (DApps) and other ecosystem projects built on AVC's blockchain could potentially drive adoption and value. However, specific details about AVC's ecosystem are not provided in the given context.
III. AVC Price Prediction for 2025-2030
2025 Outlook
- Conservative prediction: $0.00016 - $0.00028
- Neutral prediction: $0.00028 - $0.00037
- Optimistic prediction: $0.00037 - $0.00046 (requires favorable market conditions and increased adoption)
2027-2028 Outlook
- Market stage expectation: Potential growth phase with increasing volatility
- Price range forecast:
- 2027: $0.00020 - $0.00042
- 2028: $0.00027 - $0.00057
- Key catalysts: Technological advancements, wider crypto market trends, and potential regulatory clarity
2029-2030 Long-term Outlook
- Base scenario: $0.00040 - $0.00055 (assuming steady market growth and adoption)
- Optimistic scenario: $0.00055 - $0.00062 (with accelerated adoption and favorable market conditions)
- Transformative scenario: $0.00062 - $0.00070 (under extremely favorable conditions and breakthrough use cases)
- 2030-11-28: AVC $0.00055 (potential steady growth trajectory)
| 年份 | 预测最高价 | 预测平均价格 | 预测最低价 | 涨跌幅 |
|---|---|---|---|---|
| 2025 | 0.00037 | 0.00028 | 0.00016 | 0 |
| 2026 | 0.00046 | 0.00032 | 0.00023 | 17 |
| 2027 | 0.00042 | 0.00039 | 0.0002 | 41 |
| 2028 | 0.00057 | 0.0004 | 0.00027 | 46 |
| 2029 | 0.00062 | 0.00049 | 0.0004 | 75 |
| 2030 | 0.00057 | 0.00055 | 0.00048 | 99 |
IV. Professional Investment Strategies and Risk Management for AVC
AVC Investment Methodology
(1) Long-term Holding Strategy
- Suitable for: Long-term investors and believers in metaverse technology
- Operation suggestions:
- Accumulate AVC tokens during market dips
- Set price alerts for significant market movements
- Store tokens in a secure hardware wallet
(2) Active Trading Strategy
- Technical analysis tools:
- Moving Averages: Use to identify trends and potential reversal points
- RSI (Relative Strength Index): Monitor overbought/oversold conditions
- Key points for swing trading:
- Monitor project developments and partnerships
- Pay attention to trading volume for confirmation of price movements
AVC Risk Management Framework
(1) Asset Allocation Principles
- Conservative investors: 1-3% of crypto portfolio
- Aggressive investors: 5-10% of crypto portfolio
- Professional investors: Up to 15% of crypto portfolio
(2) Risk Hedging Solutions
- Diversification: Spread investments across multiple metaverse projects
- Stop-loss orders: Implement to limit potential losses
(3) Secure Storage Solutions
- Hardware wallet recommendation: Gate Web3 Wallet
- Software wallet option: Official AlterVerse wallet (if available)
- Security precautions: Enable two-factor authentication, use strong passwords
V. Potential Risks and Challenges for AVC
AVC Market Risks
- High volatility: AVC price may experience significant fluctuations
- Liquidity risk: Limited trading volume may affect entry and exit positions
- Competition: Increasing number of metaverse projects may impact market share
AVC Regulatory Risks
- Uncertain regulatory environment: Potential for stricter regulations on metaverse tokens
- Cross-border compliance: Varying regulations across different jurisdictions
- Tax implications: Evolving tax laws regarding virtual assets and metaverse income
AVC Technical Risks
- Smart contract vulnerabilities: Potential for exploits or bugs in the token contract
- Scalability challenges: Possible network congestion during high user activity
- Interoperability issues: Compatibility problems with other blockchain networks or metaverse platforms
VI. Conclusion and Action Recommendations
AVC Investment Value Assessment
AVC presents a high-risk, high-potential opportunity in the emerging metaverse sector. Long-term value lies in the project's ability to attract users and develop a thriving virtual ecosystem. Short-term risks include market volatility and regulatory uncertainties.
AVC Investment Recommendations
✅ Beginners: Consider small, experimental investments to understand the metaverse concept ✅ Experienced investors: Implement dollar-cost averaging strategy with strict risk management ✅ Institutional investors: Conduct thorough due diligence and consider AVC as part of a diversified metaverse portfolio
AVC Trading Participation Methods
- Spot trading: Buy and sell AVC tokens on Gate.com
- Staking: Participate in staking programs if offered by AlterVerse
- In-game purchases: Utilize AVC tokens within the AlterVerse ecosystem for virtual assets or experiences
Cryptocurrency investments carry extremely high risks, and this article does not constitute investment advice. Investors should make decisions based on their own risk tolerance and are advised to consult professional financial advisors. Never invest more than you can afford to lose.
FAQ
What is the future potential of Avacoin Ava Coin?
Avacoin Ava Coin shows promising potential for growth in the Web3 ecosystem. With increasing adoption and technological advancements, it could see significant value appreciation and wider use cases by 2026.
What is the price prediction for virtual crypto in 2030?
Based on current trends and market analysis, virtual crypto is predicted to reach $500 by 2030, with potential for higher growth depending on adoption and technological advancements.
What is the price prediction for AWC coin?
Based on market trends and expert analysis, AWC coin is predicted to reach $0.50 by the end of 2025, with potential for further growth in 2026.
What is the price prediction for Ava stock?
Based on current market trends and expert analysis, Ava stock is predicted to reach $75-$80 per share by the end of 2026, representing a potential 20-30% increase from its current value.
Share
Content
Introduction: AVC's Market Position and Investment Value
I. AVC Price History Review and Current Market Status
II. Key Factors Affecting AVC's Future Price
III. AVC Price Prediction for 2025-2030
IV. Professional Investment Strategies and Risk Management for AVC
V. Potential Risks and Challenges for AVC
VI. Conclusion and Action Recommendations
FAQ

