2025 ASTR Price Prediction: Analyzing Growth Trends and Market Potential for Astar Network's Token
Introduction: ASTR's Market Position and Investment Value
Astar Token (ASTR), as a collective driving web3 adoption originating from Japan, has seamlessly bridged the Astar Network and Soneium ecosystems since its inception. As of 2025, ASTR's market capitalization has reached $188,045,119, with a circulating supply of approximately 8,179,431,044 tokens, and a price hovering around $0.02299. This asset, hailed as the "Japanese Web3 Pioneer," is playing an increasingly crucial role in consumer-friendly applications, payment solutions, and decentralized finance.
This article will comprehensively analyze ASTR's price trends from 2025 to 2030, combining historical patterns, market supply and demand, ecosystem development, and macroeconomic factors to provide professional price predictions and practical investment strategies for investors.
I. ASTR Price History Review and Current Market Status
ASTR Historical Price Evolution
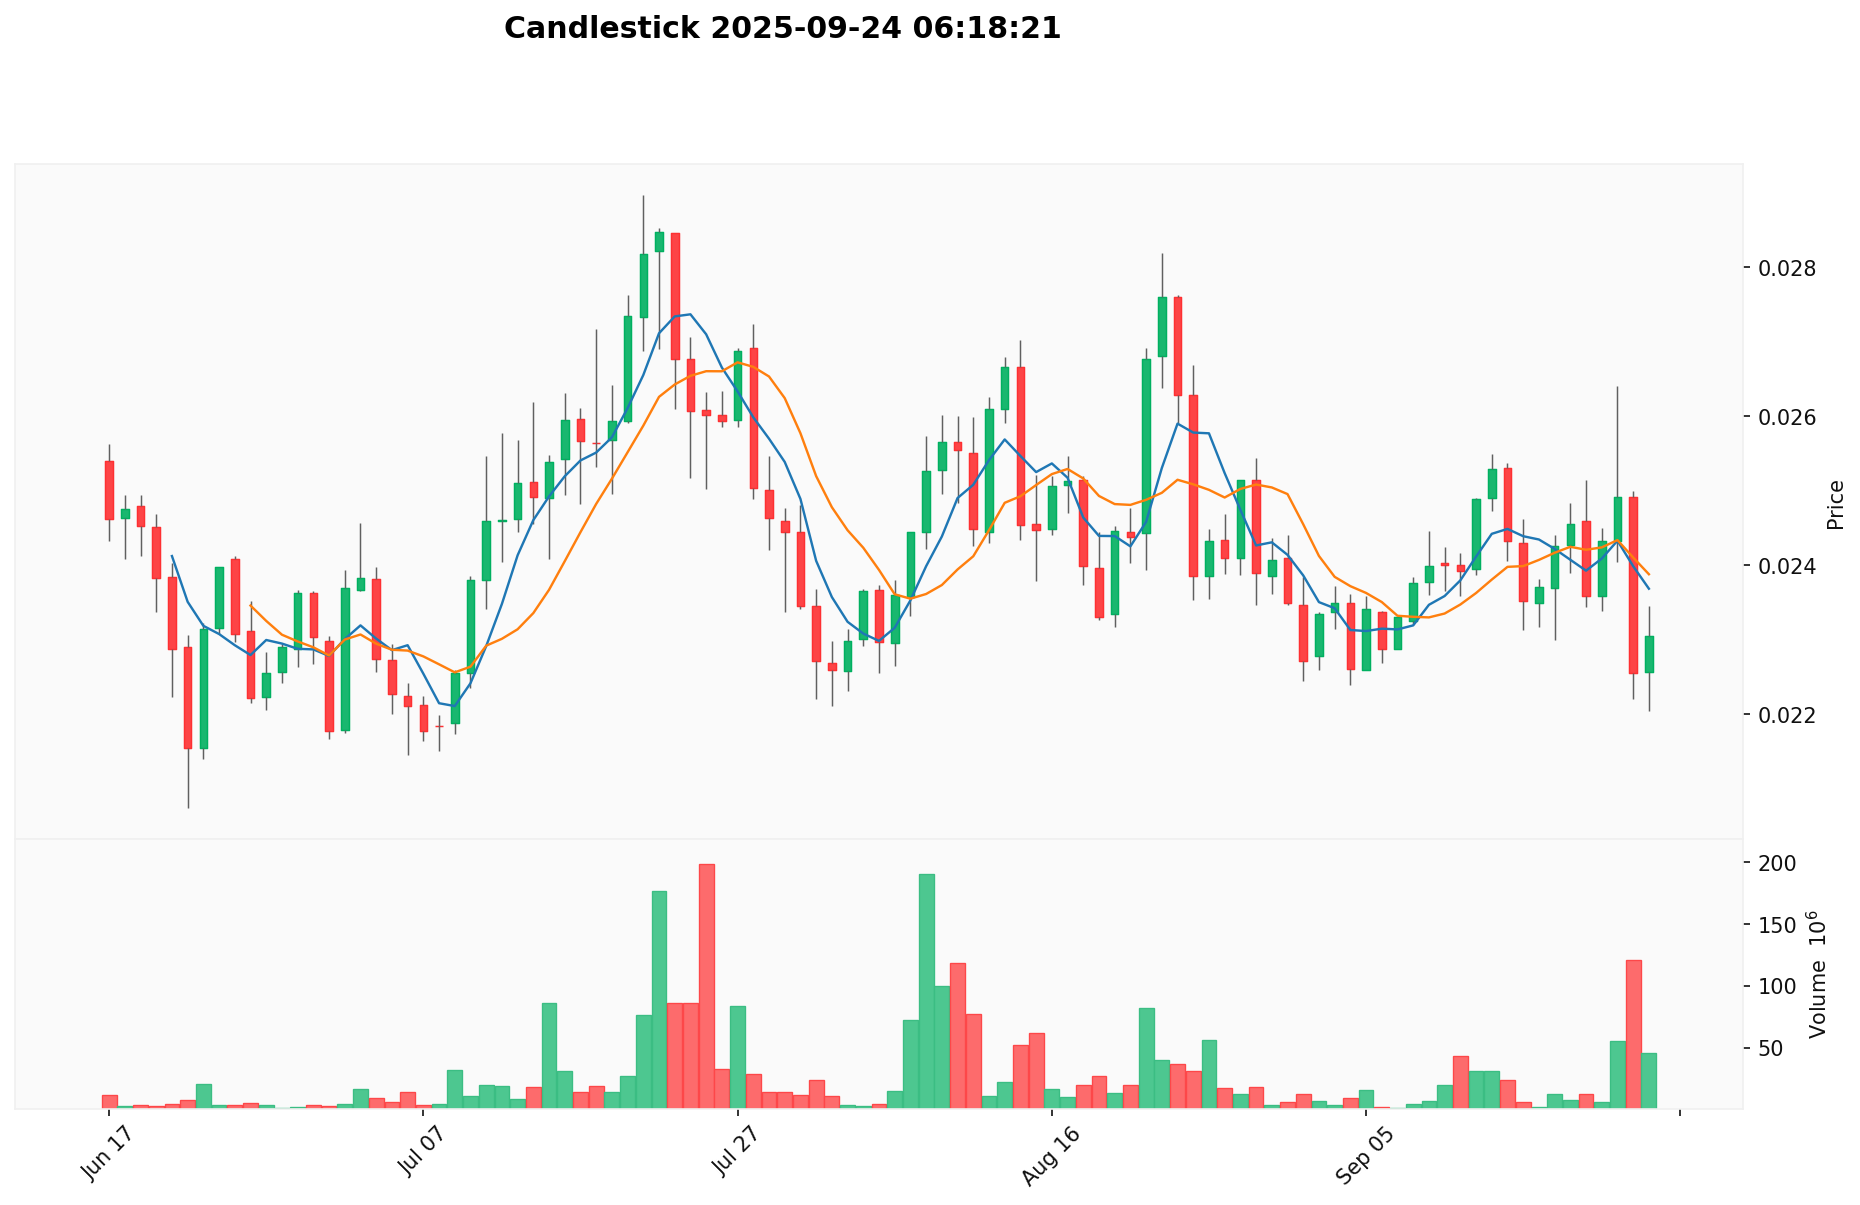
- 2022: ASTR reached its all-time high of $0.421574 on January 17, marking a significant milestone for the token.
- 2025: The token experienced a substantial decline, hitting its all-time low of $0.0208857 on June 23.
- 2025: Current market cycle, price has rebounded slightly from its lowest point to $0.02299.
ASTR Current Market Situation
As of September 24, 2025, ASTR is trading at $0.02299, showing a 1.95% increase in the last 24 hours. The token's market capitalization stands at $188,045,119, ranking it 306th in the global cryptocurrency market. ASTR has seen mixed performance across different timeframes, with a 1.099% gain in the past hour and a 1.95% increase over the last day. However, it has experienced declines of 2.59% over the past week, 11.35% over the last month, and a significant 65.63% drop over the past year. The current price represents a 94.55% decrease from its all-time high, but it has risen 10.07% from its all-time low. With a circulating supply of 8,179,431,044 ASTR and a total supply of 8,519,579,873 ASTR, the token maintains a relatively high circulating ratio of 116.85%.
Click to view the current ASTR market price
ASTR Market Sentiment Indicator
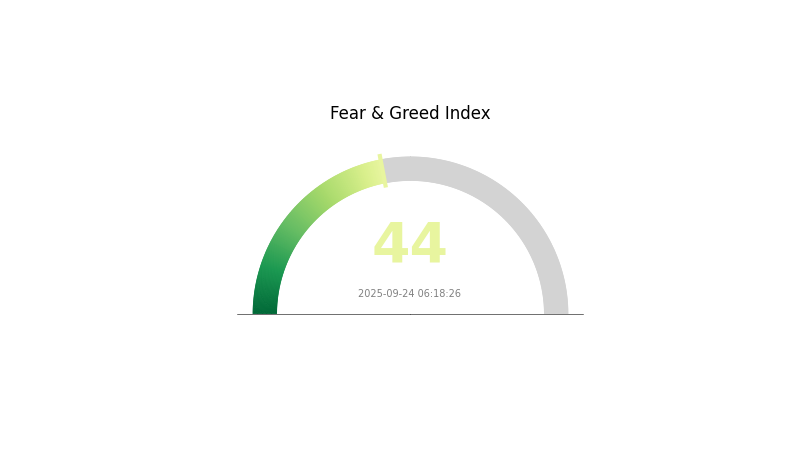
2025-09-24 Fear and Greed Index: 44 (Fear)
Click to view the current Fear & Greed Index
The crypto market sentiment remains cautious, with the Fear and Greed Index at 44, indicating a state of fear. This suggests investors are hesitant and potentially looking for safer options. However, for seasoned traders, periods of fear can present buying opportunities. It's crucial to conduct thorough research and manage risks effectively. Gate.com offers a range of tools and analytics to help navigate these market conditions. Remember, market sentiment can shift rapidly, so stay informed and trade responsibly.
ASTR Holdings Distribution
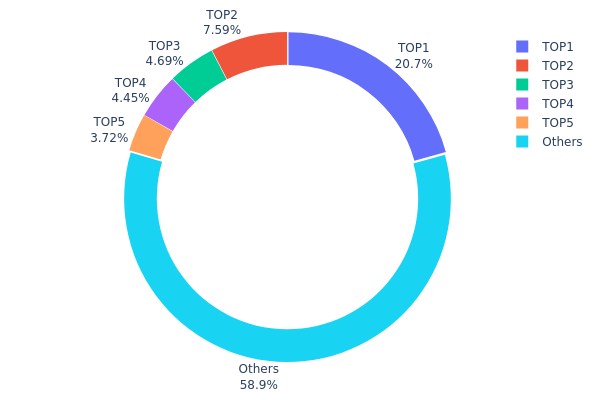
The address holdings distribution data provides crucial insights into the concentration of ASTR tokens among different addresses. Based on the provided data, we observe a significant concentration of ASTR tokens in the top addresses. The top address holds 20.67% of the total supply, while the top 5 addresses collectively control 41.11% of ASTR tokens.
This level of concentration suggests a relatively centralized distribution of ASTR tokens. Such a distribution pattern could potentially impact market dynamics, as large holders may have substantial influence over price movements. The concentration in top addresses might lead to increased volatility if these major holders decide to make significant transactions. However, it's worth noting that 58.89% of the tokens are distributed among other addresses, indicating a degree of wider participation in the ASTR ecosystem.
The current distribution reflects a market structure where a few key players hold significant sway, potentially affecting the overall stability and decentralization of the ASTR network. This concentration level warrants attention from investors and analysts when assessing the market's resilience and potential for price manipulation.
Click to view the current ASTR Holdings Distribution
| Top | Address | Holding Qty | Holding (%) |
|---|---|---|---|
| 1 | YDFuxC...pzHGgA | 1761657.39K | 20.67% |
| 2 | aRXcHQ...pPX5ve | 646619.84K | 7.59% |
| 3 | Yc66s2...sZxSVM | 399444.59K | 4.68% |
| 4 | agF2sH...jDVgae | 379272.95K | 4.45% |
| 5 | ZEyDXf...ma57Tg | 317286.89K | 3.72% |
| - | Others | 5015079.74K | 58.89% |
II. Key Factors Influencing ASTR's Future Price
Supply Mechanism
- Native Token ASTR: ASTR is the native token of the Astar platform, used for transaction fees. Token holders can also earn rewards by participating in the platform's governance system.
Institutional and Whale Dynamics
- Enterprise Adoption: Astar aims to build a high-performance blockchain platform to meet the needs of decentralized applications (dApps) and enterprise-level use cases.
Macroeconomic Environment
- Monetary Policy Impact: Macroeconomic headwinds, weak consumer sentiment, and a strong dollar are factors that could affect ASTR's growth and sustainability.
Technological Development and Ecosystem Building
- Cosmos SDK-based: Astar is built on Cosmos SDK, a popular open-source blockchain development framework that provides tools and modules for building custom blockchain applications.
- Ecosystem Applications: The project focuses on providing scalability, security, and developer-friendliness for dApps and enterprise use cases.
III. ASTR Price Prediction for 2025-2030
2025 Outlook
- Conservative prediction: $0.01541 - $0.02
- Neutral prediction: $0.02 - $0.025
- Optimistic prediction: $0.025 - $0.03128 (requires strong market recovery and project developments)
2027-2028 Outlook
- Market stage expectation: Potential growth phase with increased adoption
- Price range forecast:
- 2027: $0.01559 - $0.04139
- 2028: $0.02034 - $0.04604
- Key catalysts: Ecosystem expansion, technological advancements, and broader crypto market trends
2030 Long-term Outlook
- Base scenario: $0.04 - $0.05 (assuming steady growth and market stability)
- Optimistic scenario: $0.05 - $0.07 (assuming strong project performance and favorable market conditions)
- Transformative scenario: $0.07 - $0.07428 (assuming breakthrough innovations and mass adoption)
- 2030-12-31: ASTR $0.04985 (projected average price)
| 年份 | 预测最高价 | 预测平均价格 | 预测最低价 | 涨跌幅 |
|---|---|---|---|---|
| 2025 | 0.03128 | 0.023 | 0.01541 | 0 |
| 2026 | 0.03284 | 0.02714 | 0.02307 | 18 |
| 2027 | 0.04139 | 0.02999 | 0.01559 | 30 |
| 2028 | 0.04604 | 0.03569 | 0.02034 | 55 |
| 2029 | 0.05884 | 0.04086 | 0.02901 | 77 |
| 2030 | 0.07428 | 0.04985 | 0.02941 | 116 |
IV. ASTR Professional Investment Strategies and Risk Management
ASTR Investment Methodology
(1) Long-term Holding Strategy
- Suitable for: Risk-tolerant investors with a long-term perspective
- Operational suggestions:
- Accumulate ASTR tokens during market dips
- Participate in staking to earn additional rewards
- Store tokens in a secure non-custodial wallet
(2) Active Trading Strategy
- Technical analysis tools:
- Moving Averages: Use to identify trends and potential entry/exit points
- RSI (Relative Strength Index): Monitor overbought/oversold conditions
- Key points for swing trading:
- Set clear stop-loss and take-profit levels
- Monitor project developments and market sentiment
ASTR Risk Management Framework
(1) Asset Allocation Principles
- Conservative investors: 1-3% of crypto portfolio
- Aggressive investors: 5-10% of crypto portfolio
- Professional investors: Up to 15% of crypto portfolio
(2) Risk Hedging Solutions
- Diversification: Spread investments across multiple crypto assets
- Stop-loss orders: Implement to limit potential losses
(3) Secure Storage Solutions
- Hot wallet recommendation: Gate Web3 wallet
- Cold storage solution: Hardware wallet for long-term holdings
- Security precautions: Enable two-factor authentication, use strong passwords
V. Potential Risks and Challenges for ASTR
ASTR Market Risks
- High volatility: ASTR price may experience significant fluctuations
- Competition: Other Layer 1 and Layer 2 solutions may impact Astar's market share
- Liquidity risk: Limited trading volume may affect entry and exit positions
ASTR Regulatory Risks
- Uncertain regulatory environment: Evolving crypto regulations may impact ASTR's adoption
- Cross-border compliance: Varying international regulations may affect global expansion
- Potential security token classification: May lead to additional regulatory scrutiny
ASTR Technical Risks
- Smart contract vulnerabilities: Potential exploits in the network's code
- Scalability challenges: Possible network congestion during high-demand periods
- Interoperability issues: Complications in bridging with other blockchain networks
VI. Conclusion and Action Recommendations
ASTR Investment Value Assessment
ASTR presents a unique value proposition with its Japan-focused approach and Sony partnership. However, investors should be cautious due to high market volatility and regulatory uncertainties in the crypto space.
ASTR Investment Recommendations
✅ Beginners: Start with small positions and focus on learning about the project ✅ Experienced investors: Consider a balanced approach with regular DCA and staking ✅ Institutional investors: Conduct thorough due diligence and consider OTC options for large positions
ASTR Trading Participation Methods
- Spot trading: Buy and sell ASTR on Gate.com
- Staking: Participate in network validation for additional rewards
- DeFi integration: Explore decentralized finance opportunities within the Astar ecosystem
Cryptocurrency investments carry extremely high risks, and this article does not constitute investment advice. Investors should make decisions carefully based on their own risk tolerance and are advised to consult professional financial advisors. Never invest more than you can afford to lose.
FAQ
What is the Astar all time high?
Astar's all-time high price was $0.3353, reached on April 10, 2022.
What is the price prediction for Astar in 2040?
Based on a projected annual growth rate of 5%, the price of Astar (ASTR) is expected to reach $0.05643 by 2040.
What crypto has the highest price prediction?
Bitcoin (BTC) has the highest price prediction for 2025, followed closely by Ethereum (ETH). These predictions are based on current market trends and expert analysis.
What is Astra Labs price prediction?
Astra Labs' price may rise in the short term. Current price is $245.20, with analysts suggesting a potential buying opportunity due to positive market signals.
Share
Content
Introduction: ASTR's Market Position and Investment Value
I. ASTR Price History Review and Current Market Status
II. Key Factors Influencing ASTR's Future Price
III. ASTR Price Prediction for 2025-2030
IV. ASTR Professional Investment Strategies and Risk Management
V. Potential Risks and Challenges for ASTR
VI. Conclusion and Action Recommendations
FAQ

