EagleEye

vip
Age 1.7 Year
Peak Tier 5
Actions speak louder than words prove it by your actions
Pin
#WCTCTradingKingPK
🚨 Join My Team & Dominate WCTC S8 — Let’s Win Together 🏆🔥
This is not just another competition… this is WAR.
The WCTC S8 Trading Competition is now LIVE, and I am building a powerful team that is ready to rise, compete, and win big. 💪
I have already entered the arena with my team, and now I am inviting YOU to join me and become part of something bigger — a team that doesn’t just participate, but a team that dominates.
💥 Why join my team?
Because we are not here to play small. We are here to:
✔️ Build strong trading strategies together
✔️ Support each other in every tra
GT0.13%
post-image
post-image
post-image
post-image
post-image
post-image
post-image
post-image
  • Reward
  • 50
  • 1
  • Share
Luna_Star:
LFG 🔥
View More
🔹 Bitcoin mining difficulty decreased by 2.3 percent
1,438 views
2026-05-04 13:30
  • Reward
  • Comment
  • Repost
  • Share
#GateSquareMayTradingShare
📊 Dogecoin Deep Market Breakdown — Strategy, Structure, Psychology & Full Price Outlook
The current market for Dogecoin is in a complex phase where price action is being driven less by fundamentals and more by liquidity cycles, sentiment shifts, and broader crypto market behavior. Unlike assets with strong institutional valuation models, DOGE is heavily influenced by momentum, retail participation, and attention cycles. This makes its price behavior more dynamic, but also less predictable in the short term.
💰 Current Price Context:Dogecoin is currently trading ar
DOGE1.54%
BTC1.54%
MEME1.78%
post-image
post-image
post-image
post-image
post-image
post-image
post-image
post-image
post-image
  • Reward
  • 11
  • Repost
  • Share
SoominStar:
To The Moon 🌕
View More
#WCTCTradingKingPK
🏆 WCTC S8 Hot Discussion Show Your Achievements, Build Your Team, and Compete for Luxury Reward
The WCTC S8 event is now live, bringing a competitive and reward-filled experience for all participants. Hosted on Gate.com, this campaign is designed to encourage users to share their trading achievements, team strategies, and battle performance while competing for exclusive prizes and platform exposure. Whether you are a strategist, a competitive player, or a team builder, this event offers multiple reward paths based on your participation style and contribution.
At its core,
GT0.13%
post-image
post-image
post-image
post-image
post-image
post-image
post-image
  • Reward
  • 11
  • 1
  • Share
SoominStar:
To The Moon 🌕
View More
#USSeeksStrategicBitcoinReserve
US Seeks Strategic Bitcoin Reserve Crypto Enters the Era of Geopolitics, State Power, and Global Competition Over Digital Assets
The latest developments around Bitcoin signal a major shift in how digital assets are being perceived at the highest levels of government. Reports indicating that the United States is exploring strategic positioning in Bitcoin, alongside confirmed seizures of large-scale crypto assets tied to foreign entities, suggest that cryptocurrency is no longer being treated purely as a financial innovation or speculative asset class. Instead
post-image
post-image
post-image
post-image
post-image
post-image
post-image
  • Reward
  • 12
  • 1
  • Share
HighAmbition:
To The Moon 🌕
View More
#BitcoinETFOptionLimitQuadruples
📈 Bitcoin ETF Options Limits Quadruple — Institutional Access Just Got a Major Upgrade
The U.S. Securities and Exchange Commission has approved Nasdaq’s request to significantly expand position and exercise limits for options tied to the Bitcoin exchange-traded fund IBIT. The cap has now been raised from 250,000 contracts to 1,000,000 contracts — a fourfold increase. This is not a small technical adjustment; it represents a meaningful structural shift in how large-scale investors can interact with Bitcoin-linked financial products. By expanding these limits,
BTC1.54%
post-image
post-image
post-image
post-image
post-image
post-image
post-image
  • Reward
  • 11
  • Repost
  • Share
SoominStar:
Ape In 🚀
View More
#FedHoldsRateButDividesDeepen
Fed Holds Rates, But Deep Internal Division Signals a Turning Point in Global Liquidity Conditions
On April 30, the Federal Reserve voted to keep interest rates unchanged at 3.50%–3.75% for the third consecutive meeting, maintaining a pause in its tightening cycle. At first glance, this might look like a continuation of stability and “wait-and-see” policy behavior. However, beneath the surface, the decision revealed one of the most significant internal fractures in decades. The 8–4 vote split represents the deepest disagreement within the Federal Reserve since 19
post-image
  • Reward
  • 8
  • Repost
  • Share
SoominStar:
To The Moon 🌕
View More
#DeFiLossesTop600MInApril
💥 DeFi Losses Cross $600M in April Is Composability Turning Into “Attackability”?
April has turned into one of the most painful months in recent decentralized finance history, with confirmed losses across DeFi security incidents reaching around $651 million — the highest monthly total since March 2022. The scale of these exploits is not just a number on a chart; it represents real breakdowns in trust, infrastructure, and risk management across the ecosystem. Platforms like DeFi are designed to operate without centralized control, but this very openness also creates
ARB-1.92%
ETH0.86%
post-image
  • Reward
  • 10
  • Repost
  • Share
Yusfirah:
Diamond Hands 💎
View More
#DailyPolymarketHotspot
🔥 Gate Square Daily Event Explained in Simple Words Join the Polymarket Hot Topics Prediction and Explore the Big Elon Musk vs OpenAI Case Step by Step
Gate Square Daily Hot Topics Prediction Event is a simple way for users to take part in real world discussions and try to guess outcomes of major global events. Instead of only reading news, people can now share their opinion, explain their thinking, and also get a chance to win small rewards. This event is connected with Polymarket, which is a platform where users make predictions about future events. These events ca
post-image
  • Reward
  • 9
  • Repost
  • Share
Yusfirah:
2026 GOGOGO 👊
View More
#TapAndPayWithGateCard
Tap. Pay. Live Freely How Crypto Is Quietly Transforming Everyday Spending Into a Seamless, Borderless Experience
The way we interact with money is evolving faster than ever, and one of the most noticeable shifts is how digital assets are beginning to merge with daily life. With tools like the Gate Card, crypto is no longer something that exists only inside exchanges or long-term investment portfolios — it’s becoming a functional part of everyday transactions. Imagine walking into your favorite café, ordering your usual coffee, and paying instantly with your phone, with
post-image
  • Reward
  • 10
  • 2
  • Share
Yusfirah:
Diamond Hands 💎
View More
#TreasuryYieldBreaks5PercentCryptoUnderPressure
Treasury Yields Hit 5% Is Liquidity Leaving Crypto Markets?
The global macro landscape is shifting again as the 30-year U.S. Treasury yield climbs to 5%, marking its highest level since mid-2025. This move in U.S. Treasury bonds is more than just a headline number — it represents a significant tightening in financial conditions and a powerful signal about where capital may flow next. When yields on long-duration government debt rise to these levels, they begin to offer something markets haven’t seen in a while: relatively attractive, lower-ris
BTC1.54%
post-image
  • Reward
  • 8
  • 1
  • Share
SoominStar:
LFG 🔥
View More
#OilBreaks110
🛢️ Oil Shockwaves Across Global Markets Volatility, Inflation, and the Macro Reset
Global energy markets were sent into overdrive as Brent Crude briefly surged past $141 amid escalating geopolitical tensions and a reported disruption around the Strait of Hormuz — one of the most strategically vital النفط corridors in the world. Although prices have since retraced toward the $111–$112 range, the magnitude and speed of the spike reveal just how sensitive markets remain to supply-side risks. This is not merely a short-term reaction driven by headlines; it reflects a deeper struct
post-image
  • Reward
  • 8
  • Repost
  • Share
Yusfirah:
Buy To Earn 💰️
View More
#BitcoinSpotVolumeNewLow
📉 Bitcoin Spot Volume Hits Multi-Month Lows Calm Before the Storm or Strategic Silence?
The latest data shows that daily spot trading volume for Bitcoin has fallen below the $8 billion mark, reaching its lowest levels since October 2023. This sharp contraction down nearly 70–80% from peak activity — is not just a statistic, but a signal worth paying close attention to. At first glance, such a drop might suggest that interest in the market is fading or that momentum has stalled. However, financial markets, especially crypto, rarely operate in such a straightforward
BTC1.54%
post-image
  • Reward
  • 8
  • 3
  • Share
MrFlower_XingChen:
To The Moon 🌕
View More
View Original
SoominStar
#GlobalLiquidityShift #BitcoinMacroCycle #CryptoEconomy2026
The cryptocurrency market has entered a completely new era where price action is no longer controlled only by technical analysis, whale activity, or blockchain metrics. In 2026, the biggest driver behind Bitcoin and the broader crypto market is the global economy itself. Every movement in inflation, every interest rate decision, every central bank statement, and every economic slowdown now directly impacts digital assets. Crypto has evolved from an isolated financial experiment into a fully integrated part of the global economic system.
A few years ago, traders mainly focused on chart patterns, support zones, resistance levels, and on-chain activity. Today, professional investors begin their analysis somewhere else entirely. They watch Federal Reserve meetings, inflation releases, bond markets, GDP growth, labor market data, and liquidity conditions before even looking at the Bitcoin chart. This transformation explains why crypto market behavior feels very different compared to previous cycles.
The rise of institutional participation changed everything. Spot Bitcoin ETFs, corporate treasury allocations, hedge fund exposure, and large-scale asset management involvement pushed crypto deeper into traditional finance. Bitcoin now trades in an environment influenced by global capital flows rather than only retail speculation. When liquidity expands, crypto accelerates aggressively. When liquidity contracts, the market immediately feels pressure.
This is why interest rates have become one of the strongest forces in the industry. Cheap money historically supports aggressive risk-taking behavior. Investors search for higher returns and capital flows toward technology stocks, growth sectors, and cryptocurrencies. But when central banks raise rates to fight inflation, borrowing becomes expensive, liquidity tightens, and investors become defensive. Crypto markets react instantly because modern Bitcoin is highly sensitive to liquidity conditions.
The recent Federal Reserve decision demonstrated this shift clearly. Even though policymakers kept rates unchanged, markets reacted not to the decision itself but to the tone behind the announcement. Investors carefully analyzed every sentence, every economic projection, and every signal regarding future policy direction. Bitcoin briefly weakened because traders feared that inflation concerns could delay future rate cuts. That reaction revealed how advanced the market has become. Crypto is now trading expectations, not just headlines.
Inflation remains one of the most important macroeconomic variables affecting digital assets. If inflation stays elevated, central banks are forced to maintain restrictive policies for longer periods. That reduces available liquidity across financial markets and increases pressure on speculative assets. Whenever inflation data surprises to the upside, Bitcoin often experiences short-term weakness because traders immediately adjust expectations for future monetary policy.
The relationship between inflation and crypto is now deeply interconnected. Higher inflation leads to tighter monetary conditions. Tighter conditions reduce market liquidity. Reduced liquidity weakens risk appetite. And weaker risk appetite directly impacts Bitcoin, Ethereum, and the broader altcoin market. This chain reaction has become one of the defining mechanisms of the 2026 market structure.
Economic growth is equally important. Weak growth data creates fear across financial markets, but crypto reactions are not always straightforward. Sometimes slowing growth pressures Bitcoin because investors avoid risk. Other times weak economic data actually supports crypto because markets believe central banks may eventually cut rates to stimulate the economy. This creates a complex environment where bad economic news can occasionally become bullish for digital assets.
Bitcoin itself has evolved far beyond its original narrative. It is no longer viewed only as digital gold or only as a speculative asset. Depending on market conditions, Bitcoin can behave like a technology stock, a liquidity-sensitive risk asset, or a long-term alternative reserve system. During periods of aggressive liquidity expansion, Bitcoin often rallies alongside growth equities. During periods of financial instability, its limited supply attracts investors searching for alternatives to traditional monetary systems.
This dual identity makes Bitcoin one of the most fascinating assets in global finance. It no longer belongs to a single category. Instead, it adapts to the macroeconomic environment surrounding it. That flexibility is one reason institutional investors continue increasing exposure despite volatility.
ETF flows have become another critical market driver. In previous cycles, retail traders dominated crypto momentum. In 2026, institutional inflows through regulated investment vehicles are shaping long-term price direction. Large ETF inflows create powerful buying pressure and strengthen market confidence. Outflows, however, can rapidly weaken sentiment. This institutional layer has fundamentally transformed how Bitcoin behaves during major macroeconomic events.
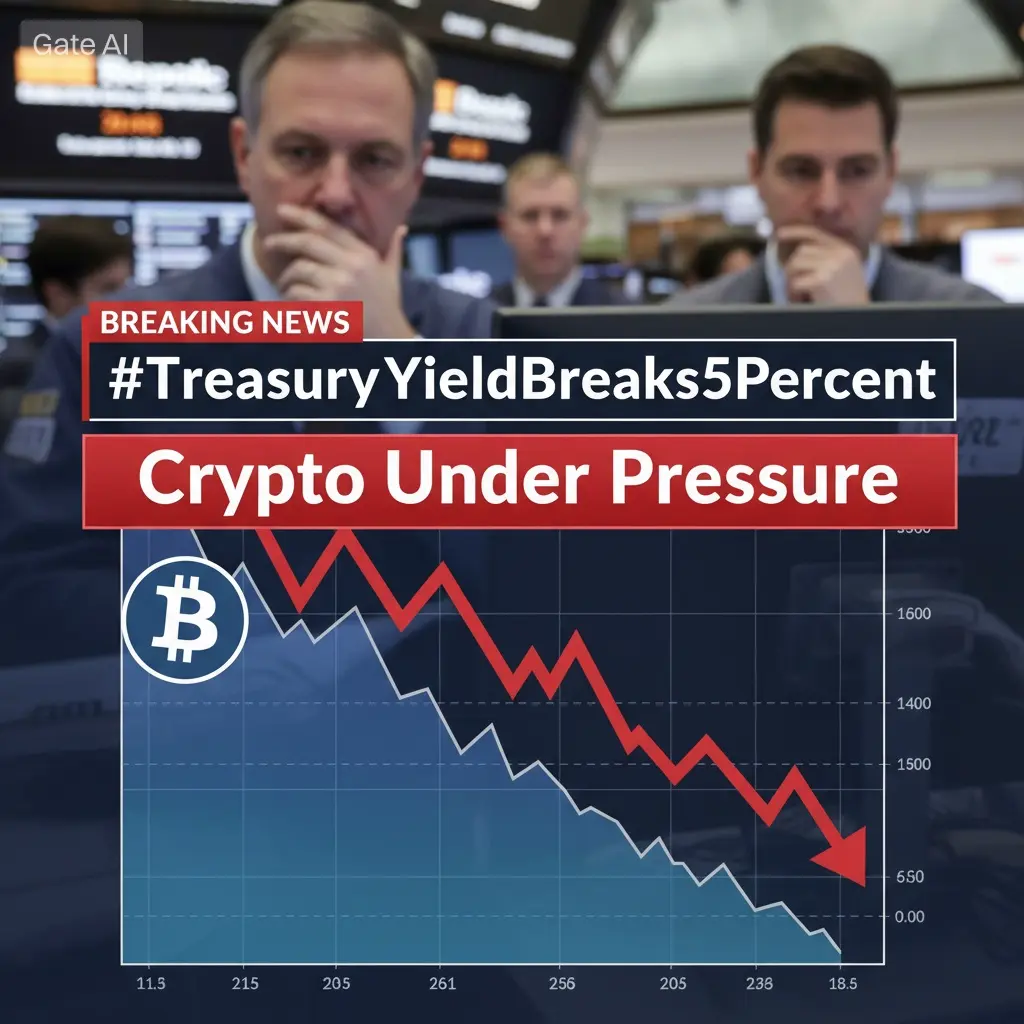
Professional investors now combine macroeconomics with crypto analysis in ways that barely existed a few years ago. They monitor Treasury yields, the US Dollar Index, central bank balance sheets, inflation expectations, labor market trends, and global liquidity conditions alongside blockchain data and technical indicators. The crypto market has become too interconnected with the broader economy to ignore these factors.
What makes this cycle unique is that the market reacts less to emotions and more to economic reality. Speculative hype still exists, but long-term direction increasingly depends on monetary policy and capital flows. The modern crypto investor must understand not only volatility and market psychology but also how global economic systems function.
The biggest lesson of 2026 is simple: crypto is no longer operating outside the financial world. It has become deeply tied to it. Bitcoin’s future direction now depends as much on inflation trends and central bank decisions as it does on blockchain innovation or adoption growth.
The question traders ask today is no longer simply whether Bitcoin will rise or fall. The deeper question is where the global economy is heading next. Because modern crypto markets are shaped by liquidity, policy, and macroeconomic forces far bigger than any individual chart pattern.
  • Reward
  • 4
  • Repost
  • Share
ybaser:
Buy the dip 😎
View More
View Original
Yusfirah
#BitcoinSpotVolumeNewLow
Bitcoin is entering May 2026 in one of the most critical market structures of this cycle. As of today, Bitcoin is trading around $78,300–$78,500 while 24-hour trading volume has sharply contracted compared to recent momentum phases. Market data shows daily spot volume dropping nearly 55% from recent active periods, confirming that this is no ordinary consolidation—it is a liquidity compression phase. Price is holding, but participation is fading. That difference matters because markets do not move sustainably on price alone. They move on conviction, and conviction is measured through volume. Right now, the market has price stability but weak participation, which makes this environment extremely sensitive to macro catalysts.
The most important thing traders need to understand today is that Bitcoin is not weak—it is waiting. This market is caught between bullish structural accumulation and bearish macro uncertainty. That conflict is creating the current low-volume regime.
The first major factor driving this environment is macroeconomic uncertainty. Inflation remains the dominant global market driver. Every CPI report now directly impacts Bitcoin because inflation determines the Federal Reserve’s policy path. If inflation remains elevated, interest rates stay restrictive for longer. Higher rates increase the attractiveness of bonds and cash while reducing speculative capital flow into crypto. This is why Bitcoin reacts less to internal crypto news and more to economic data.
The Federal Reserve remains the single strongest liquidity driver for Bitcoin in 2026. Markets entered this year expecting multiple rate cuts, but those expectations continue to shift. Delayed easing means delayed liquidity. Bitcoin historically performs best during expansion cycles when capital becomes cheaper. That environment has not fully returned yet. This is why despite bullish long-term fundamentals, short-term spot volume remains weak.
At the same time, oil remains a hidden but powerful Bitcoin driver. Energy market instability continues to pressure inflation expectations globally. If oil sustains elevated pricing, inflation pressure remains stronger, and central banks become more cautious. That slows risk appetite. Bitcoin does not directly trade on oil—but oil changes inflation, inflation changes rates, and rates change liquidity. That chain matters.
Another major factor today is retail participation decline. Retail traders drove previous explosive Bitcoin rallies, but the current cycle shows structural exhaustion. After repeated liquidations, volatility shocks, and difficult market conditions, many smaller traders have shifted toward holding rather than active spot trading. Some capital has moved into stablecoin yield opportunities instead of active BTC accumulation.
This retail absence changes market behavior dramatically.
Without retail:
Order books become thinner.
Breakouts lose strength.
Volatility becomes less organic.
Price reacts harder to external headlines.
This is exactly what current Bitcoin behavior reflects.
However, beneath weak visible volume, institutional activity remains highly important. ETF-based Bitcoin accumulation continues to absorb supply while OTC desks remain active. This creates a hidden accumulation effect where public exchange activity looks weak but strategic ownership keeps increasing. Institutional players do not chase candles—they build positions in silence.
That creates the current paradox.
Spot volume weak.
Price stable.
Institutional demand alive.
Retail waiting.
Macro uncertain.
This combination creates compression.
Technically, Bitcoin today remains inside a highly compressed zone. Immediate support is holding between $76,000 and $77,800. This area is acting as defensive territory for buyers. Resistance remains between $79,500 and $82,500. Every move into resistance is currently failing due to weak spot confirmation. Market structure shows indecision.
Current momentum indicators show neutral-to-slightly bullish strength, but not enough for confirmed breakout conditions. RSI remains healthy but not overheated. Funding rates remain relatively balanced, meaning aggressive long-side positioning is still limited. That reduces immediate liquidation risk but also limits breakout aggression.
What makes this market dangerous right now is that low-volume markets create false confidence.
When liquidity is thin:
Small capital can move price faster.
Fake breakouts become common.
Stop hunts increase.
Reaction speed accelerates.
This means traders chasing momentum without volume confirmation are exposed to higher failure probability.
Looking at the next market scenarios:
Bullish scenario:
If CPI softens, Fed language becomes more dovish, and macro tensions cool, Bitcoin can reclaim strong momentum quickly. A clean break above $82,500 with strong spot volume could open the path toward $88,000–$95,000 initially, with larger upside toward $100,000+ if ETF inflows accelerate again.
Neutral scenario:
If inflation remains mixed and Fed stays cautious, Bitcoin likely remains trapped between $74,000 and $83,000. This becomes a rotational market where range traders outperform trend traders.
Bearish scenario:
If inflation rises again, oil spikes further, or geopolitical escalation expands, Bitcoin could retest $70,000 and potentially revisit deeper liquidity zones between $65,000 and $68,000 before stabilizing.
The current trading framework should remain disciplined.
In this environment:
Range trading remains strongest.
Support buying is safer than breakout chasing.
Leverage should remain controlled.
Capital preservation matters more than aggressive exposure.
Volume must be the final confirmation.
If price moves without volume, the move remains fragile.
If price moves with volume, the move gains legitimacy.
My current market interpretation is this:
Bitcoin is not showing demand collapse.
It is showing participation hesitation.
Supply remains increasingly locked.
Institutions continue silent accumulation.
Retail remains defensive.
Macro remains unresolved.
Historically, these conditions often come before major expansion phases because compressed liquidity stores directional energy.
The market right now feels quiet, but quiet markets often produce the loudest next move.
Bitcoin today is in an energy build-up phase.
Low volume.
Strong support.
Macro pressure.
Institutional absorption.
Retail hesitation.
When liquidity returns, it will not return slowly.
It will return aggressively.
And when it does, the move will define the next major phase of the 2026 Bitcoin cycle.
repost-content-media
  • Reward
  • 3
  • Repost
  • Share
ybaser:
Buy the dip 😎
View More
View Original
Crypto__iqraa
#GateSquareMayTradingShare
Ethereum Price Prediction Insight: Next Move – Breakout to New High or Sharp Pullback First?
Ethereum is currently sitting at one of its most sensitive decision zones in the market cycle, where both continuation and correction scenarios are actively competing. Price is hovering around a key psychological region near 3,000 USD (with real-time fluctuations depending on exchange and market conditions), and the structure suggests that Ethereum is not in a clear trending phase at this exact moment, but rather in a consolidation-before-expansion phase.
This is the kind of environment where the market looks “calm” on the surface, but internally, liquidity is building aggressively on both sides.
Current Market Structure Overview
Ethereum’s broader trend still leans bullish when viewed on higher timeframes, but the short-term behavior is showing hesitation and compression.
What we are seeing in the current structure:
Repeated testing of resistance without strong breakout continuation
Buyers stepping in at key support zones but lacking strong momentum follow-through
Short-term swings becoming tighter, indicating consolidation
Liquidity being accumulated above recent highs and below recent lows
This type of structure is not random. It usually appears before a major expansion move where the market chooses direction after grabbing liquidity.
In simple terms: Ethereum is preparing for its next impulsive move, but it has not confirmed direction yet.
Bullish Scenario: Breakout to New Highs
If Ethereum manages to break above its current resistance zone with strong volume and sustained momentum, the market could enter a powerful expansion phase.
In that scenario, we may see:
A clean breakout above recent highs
Short liquidations fueling rapid upward acceleration
Strong momentum candles with minimal pullbacks
Retail FOMO entering after confirmation of trend continuation
Ethereum historically performs very strongly once it clears major resistance zones, especially when Bitcoin is also stable or trending upward. In such conditions, ETH often accelerates faster in percentage terms due to its higher volatility.
If this bullish breakout confirms, Ethereum could quickly move into price discovery zones beyond previous cycle highs.
Bearish Scenario: Fake Breakout Before Drop
On the other side, Ethereum also has a strong probability of a liquidity sweep before continuation.
This would typically look like:
A quick push above resistance to trap breakout buyers
Immediate rejection with strong selling pressure
Rapid drop back into the consolidation range
Liquidation of over-leveraged long positions
This is a very common pattern in crypto markets, where the first breakout attempt is often used to collect liquidity before the real directional move begins.
In this case, Ethereum would not be reversing its bullish structure, but simply resetting market positioning before a stronger upward move later.
What the Market Is Really Doing
The most important thing to understand right now is that Ethereum is not trending aggressively in either direction—it is balancing liquidity.
That means:
Buyers are defending key support zones
Sellers are defending major resistance zones
Both sides are building pressure
The market is waiting for imbalance to trigger expansion
This is what traders often misinterpret as “uncertainty,” but in reality, it is preparation.
Markets do not move randomly. They move when liquidity is sufficient.
Psychological Side of the Market
Right now, sentiment is divided:
Bulls expect an immediate breakout into new highs
Bears expect a rejection and deeper correction
Retail traders are getting trapped in both directions
Smart money is waiting for confirmation, not prediction
This type of environment is designed to create confusion before a strong directional move.
The longer Ethereum stays compressed, the more powerful the eventual breakout or breakdown tends to be.
My Personal Thought & Prediction
Based on current structure, Ethereum looks more likely to go through one final liquidity sweep phase before confirming its next major trend.
So the most probable sequence in my view is:
Short-term scenario:
Fake breakout or wick above resistance
Sudden rejection or volatility spike
Short-term pullback toward support zones
Mid-term scenario:
Strong base formation after liquidity grab
Accumulation with reduced volatility
Then a stronger, more sustained breakout
In simple terms, I do not expect a clean one-direction move without manipulation or liquidity hunting first.
Ethereum is still structurally bullish, but timing is not immediate and patience is required.
Key Behavioral Zones to Watch
Instead of focusing only on price levels, it is more important to observe behavior:
Resistance zone: area where breakout attempts are repeatedly failing or stalling
Support zone: region where buyers consistently absorb selling pressure
Volume confirmation: whether breakout attempts are supported by real momentum
Fakeout signals: sharp moves without continuation
The real move will only become clear once one side loses control decisively.
Risk Perspective
At this stage of the market:
Volatility is expected to increase
False breakouts become more common
Leverage becomes extremely risky
Emotional trading leads to poor decisions
Waiting for confirmation becomes an edge
This is not a phase for guessing—it is a phase for observation and disciplined execution.
Final Market Outlook
Ethereum is positioned at a critical decision point where the next major move will likely define short-to-mid term direction.
While the broader trend remains bullish, the market is still incomplete in its current structure. A liquidity sweep before continuation is highly possible, and that often leads to stronger upward moves afterward.
Whether Ethereum breaks directly into new highs or first pulls back to reset before continuation, the eventual expansion phase is likely to be significant.
The market is preparing—question is only about timing.
So the real question is:
Will Ethereum first fake a breakout and sweep liquidity below/above current levels before launching into a strong bullish expansion, or are we about to see an immediate and clean breakout into new highs without any major correction first?
repost-content-media
  • Reward
  • 3
  • Repost
  • Share
ybaser:
Just charge forward 👊
View More
View Original
Vortex_King
#GateSquareMayTradingShare
Weekly Trading Plan
Dogecoin (DOGE)
Current Market Context: Sideways / Consolidation Phase
Timeframe: 1 Week Plan
Market Structure: Range-bound with liquidity grabs
Dogecoin is currently moving in a broad consolidation structure where price is repeatedly reacting between key demand and supply zones. There is no confirmed strong bullish or bearish trend in the short-term weekly structure. Instead, the market is rotating liquidity between support and resistance, creating fake breakouts, quick reversals, and high volatility spikes.
This kind of environment is not trending—it is a range market, meaning traders should focus on buying low and selling high instead of chasing momentum.
---
Market Context (Weekly Bias)
DOGE is currently:
Moving in a horizontal consolidation zone
Showing repeated rejection from resistance areas
Finding strong demand near lower support zones
Trapping retail traders in fake breakouts
Liquidity behavior indicates:
Smart money is accumulating at lower levels
Distribution happens near resistance
Market makers are sweeping stops in both directions
📌 Weekly Bias: Neutral (Range Trading Environment)
📌 Strategy Type: Buy support, sell resistance
---
Key Levels for This Week
🔵 Strong Buy Zone (Accumulation Area)
$0.135 – $0.145
This is the most important accumulation zone of the week. Historically, DOGE has shown strong reactions in this region where buyers step in aggressively.
Market behavior in this zone:
Strong bounce probability
High liquidity accumulation
Long wick rejection possible
Institutional-style buying interest
📌 Trading Plan:
Best area to open long positions
Scale into buys gradually
Stop-loss below $0.128
⚠️ This is the safest and highest probability buy zone of the week.
---
⚪ Mid Zone (No Trade Area)
$0.145 – $0.165
This zone represents market indecision. Price tends to:
Chop sideways
Create fake breakouts
Trap both buyers and sellers
Market participants often lose money here due to lack of direction.
📌 Trading Rule:
Avoid new positions
Only scalp if experienced
Wait for clear breakout or rejection
This is the low edge zone where discipline is more important than opportunity.
---
🔴 Sell / Resistance Zone
$0.165 – $0.180
This is the major supply zone where sellers consistently enter the market.
Market behavior:
Strong rejection wicks
Profit-taking by whales
Short-term distribution phase
📌 Trading Plan:
Take profit on long positions
Look for short opportunities on rejection
Avoid buying aggressively here
⚠️ This is a high-risk buy zone and high-reward short zone.
---
Weekly Trading Strategy
---
📈 Strategy 1: Range Buy Setup (Core Strategy)
Entry Zone: $0.135 – $0.145
Target: $0.165 – $0.180
Stop-Loss: Below $0.128
Probability: High
This is the primary strategy for the week. The market structure supports mean-reversion trading.
📌 Execution Plan:
Enter gradually (not all-in)
Confirm bounce with price action (wick rejection or bullish candle)
Take partial profits at mid resistance
Hold remainder for upper range test
This strategy works best in sideways markets like the current DOGE structure.
---
📉 Strategy 2: Resistance Short Setup
Entry Zone: $0.165 – $0.180
Target: $0.145 – $0.135
Stop-Loss: Above $0.185
Probability: Medium to High (if rejection confirmed)
Short opportunities appear only when strong rejection is visible.
📌 Conditions for Short Entry:
Bearish engulfing candle
Volume spike with rejection
Failed breakout above resistance
📌 Execution:
Enter after confirmation, not early
Take quick profits at mid support
Avoid holding against unexpected breakout
---
🚀 Strategy 3: Breakout Trade (Advanced Setup)
This is a low-frequency but high-reward setup.
---
🟢 Bullish Breakout Scenario
Condition: Daily close above $0.180 with strong volume
Confirmation: Retest holds above resistance
Target Levels:
$0.195
$0.210
$0.235
📌 Key Rule: Do NOT enter on first breakout candle
Wait for confirmation retest to avoid fakeouts
---
🔴 Bearish Breakdown Scenario
Condition: Break below $0.135 with strong bearish momentum
Target Levels:
$0.120
$0.110
$0.095
📌 Key Rule: Only enter if breakdown is supported by volume
Otherwise it may be a liquidity sweep (fake move)
---
Risk Management Rules (Critical)
In a range-bound market like DOGE, risk control is more important than prediction.
Key rules:
Never use high leverage in sideways conditions
Always place stop-loss before entry
Avoid trading mid-zone ($0.145 – $0.165)
Do not chase breakout candles
Take partial profits at resistance zones
Protect capital over chasing opportunities
📌 Rule of Discipline: “If the market is unclear, your trade should be zero.”
---
Weekly Market Behavior Expectation
DOGE is expected to behave in the following way:
Repeated fake breakouts above $0.165
Sharp liquidity wicks below $0.140
Fast reversals inside the range
High volatility but no trend continuation
Strong reactions at both support and resistance
This is typical accumulation-distribution behavior where smart money accumulates positions quietly while retail traders get trapped in volatility.
---
Market Psychology Insight
This week’s DOGE structure is heavily psychological:
Retail traders will buy resistance → get trapped
Retail traders will sell support → miss rebounds
Smart money will accumulate low and distribute high
The key advantage is patience and discipline:
Buy fear at support
Sell greed at resistance
Avoid emotional trading in mid-zone noise
---
Weekly Outlook Summary
📊 Market Type: Range / Consolidation
📉 Trend Strength: Weak / Neutral
📈 Volatility: Medium-High
🎯 Best Strategy: Range Trading
⚠️ Risk Level: Medium (due to fake breakouts)
Breakout probability remains low unless there is a volume expansion event or macro catalyst.
---
Final Plan (Simple Version)
✔️ Buy Zone: $0.135 – $0.145
✔️ Sell Zone: $0.165 – $0.180
✔️ Avoid Zone: $0.145 – $0.165
✔️ Breakout Trade: Only after confirmed close
✔️ Strategy: Buy low, sell high, repeat range cycle
---
#GateSquare #CreatorCarnival #ContentMining
repost-content-media
  • Reward
  • 4
  • Repost
  • Share
ybaser:
Just charge forward 👊
View More
View Original
HighAmbition
#GateSquareMayTradingShare
BITCOIN (BTC) NEXT MOVE — ADVANCED PROBABILITY MODEL (MAY 2026)
Current Price: $78,500 — A Critical Liquidity Zone Where Decisions Define Outcomes
This is not just another moment in the market where price randomly fluctuates and traders chase green candles or panic during red ones, this is a structurally important phase where Bitcoin is compressing within a high-stakes zone, and beneath this calm-looking price action, a complex battle is unfolding between institutional positioning, algorithmic execution, and retail psychology, and the outcome of this phase will define the next major directional move that can either reward prepared traders or completely wipe out those who are operating on emotions instead of structured thinking.
Most traders at this level are still stuck in a binary mindset, constantly asking whether Bitcoin will go up or down next, but that approach is fundamentally flawed because the market does not operate on certainty, it operates on probabilities, and the only way to stay consistently profitable in such an environment is to break the market into multiple scenarios, assign realistic percentage expectations, and prepare actionable strategies for each outcome instead of reacting late when the move has already happened
At the current $78,500 level, Bitcoin is sitting at a pivot zone where liquidity is building both above and below the price, meaning the market has incentives in both directions, which increases volatility potential and decreases predictability, and this is exactly why we shift from prediction to probability-based execution models.
SCENARIO 1: BULLISH EXPANSION (+12% to +18%) — MOMENTUM IGNITION PHASE
In this scenario, Bitcoin successfully defends its support structure and begins to attract aggressive buying pressure, not only from retail participants but more importantly from institutional flows that are quietly positioning themselves before a breakout becomes obvious to the majority, and once price starts pushing above key resistance zones, the market transitions from accumulation to expansion, triggering a chain reaction of momentum-driven buying and short liquidations.
From the current $78,500, a +12% to +18% move projects Bitcoin into the range of:
$87,900 → $92,600
This move is not just a simple upward trend, it is typically characterized by acceleration phases, where price moves faster as it rises due to the presence of liquidity clusters above resistance levels, and these clusters act like magnets, pulling price toward them as market makers exploit stop-loss orders and forced exits from short sellers.
However, one of the biggest misconceptions about bullish markets is that they are easy to trade, when in reality, they are filled with manipulative micro pullbacks, sudden volatility spikes, and fake breakdowns designed to remove weak hands before continuation, which means that traders without a clear plan often exit early and miss the majority of the move.
In this environment, patience and structure are more valuable than speed, and traders who scale into positions instead of chasing entries are the ones who extract the most value.
Bullish Strategic Insight:
If Bitcoin breaks above resistance with strong volume and holds above it, the probability of continuation toward $88K–$92K increases significantly, but success depends on disciplined execution rather than emotional reaction.
SCENARIO 2: SIDEWAYS CONSOLIDATION (±5%) — LIQUIDITY ACCUMULATION PHASE
This is the most deceptive phase of the market, where Bitcoin appears stable on the surface but is internally building the conditions necessary for a larger move, and during this time, price oscillates within a relatively tight range, creating multiple false signals that trap traders on both sides.
From $78,500, a ±5% range defines:
👉 Lower Range: ~$74,500
👉 Upper Range: ~$82,400
This phase is often misunderstood as “boring” or “inactive,” but in reality, it is one of the most strategically important zones, because it is where large players accumulate positions without significantly moving the market, while retail traders exhaust themselves through overtrading and inconsistent decision-making
The defining characteristics of this phase include:
Frequent fake breakouts above resistance followed by quick reversals
Sudden dips below support that recover rapidly
Lack of sustained momentum in either direction
Declining emotional conviction among traders
This environment punishes impatience and rewards precision, and traders who understand this phase shift their focus from aggressive trend trading to range-based strategies, smaller position sizes, and strict risk management.
Sideways Strategic Insight:
Bitcoin moving between $74K–$82K is not a signal of weakness, it is a preparation phase, and those who preserve capital here gain a significant advantage when the breakout eventually occurs.
SCENARIO 3: BEARISH CORRECTION (-10% to -15%) — LIQUIDITY RESET PHASE
If Bitcoin fails to maintain its current support structure and selling pressure intensifies, the market can enter a controlled corrective phase where price moves downward with purpose, targeting liquidity zones below and resetting the overall structure
From $78,500, a -10% to -15% move places Bitcoin in the range of:
$70,600 → $66,700
This phase is often perceived as a collapse by inexperienced traders, but in reality, it is a necessary market function, where excess leverage is removed, funding rates normalize, and long positions that were built without proper risk control are forced out of the system
The transition into this phase is typically confirmed by:
Strong breakdown below support with increased volume
Weak recovery attempts that fail to reclaim lost levels
Rapid shift in sentiment from optimism to fear
This is where the majority makes critical mistakes, either by panic selling near the bottom or attempting to catch reversals without confirmation, both of which result in losses, while experienced traders either capitalize on the downside with controlled risk or patiently wait for high-probability re-entry zones.
Bearish Strategic Insight:
A move toward $66K–$70K is not the end of Bitcoin’s structure, it is a recalibration phase that creates future opportunity for those who remain patient and calculated.
DEEP MARKET REALITY — UNDERSTAND THIS OR GET LEFT BEHIND
At $78,500, Bitcoin is not simply choosing a direction, it is building a decision environment, and traders who fail to adapt to this complexity will continue to operate with outdated thinking patterns that no longer work in modern markets.
The truth is harsh but clear:
👉 The market is engineered to exploit emotional behavior
👉 Liquidity exists where traders are most vulnerable
👉 Price moves toward pain, not comfort
And this is why probability-based thinking is not optional, it is essential.
repost-content-media
  • Reward
  • 4
  • Repost
  • Share
ybaser:
Just charge forward 👊
View More
View Original
Ryakpanda
#Gate广场五月交易分享 $80k Enclosure Without Attack! Bitcoin has experienced four consecutive days of short squeezing, exchange reserves are depleted, how much longer can the last shorts hold out?
Since late April, Bitcoin has attempted to break through the $80k mark four times in a row but has yet to achieve an effective breakout. Just as this "bomb" remains unresolved, there has been intense divergence within the crypto market—over the past 24 hours, liquidations of $105 million have occurred, twice the long positions, forcing tens of thousands of bearish traders to exit. Meanwhile, exchange reserves of BTC have fallen to their lowest level since 2018, with liquidity continuously tightening. Conversely, Ethereum has set a nearly one-year record for ETF inflows, indicating that smart money is rotating massively from Bitcoin to Ethereum.
$80k is within reach—who will be the final winner?
1. Market Overview: Enclosing at $80k but not breaking through, liquidations burn shorts
On May 4th, the crypto market staged a tug-of-war between bulls and bears amid sideways consolidation.
Bitcoin (BTC) repeatedly tested the $77,500–$79,000 range in the early session, marking the fourth attempt this month to push past $80k. As of this report, Bitcoin trades around $78,400, up slightly by 0.4% in 24 hours. Bitcoin’s market share remains at 58.5%, with capital still highly concentrated in the leading asset. Ethereum (ETH) performed more steadily. Currently priced around $2,325, ETH has maintained support above the $2,300 level for several days. Its performance outshines Bitcoin, with the ETH/BTC ratio rising from 0.029 on April 22 to about 0.030, indicating a rotation of funds from Bitcoin to Ethereum. The Fear & Greed Index rose to 47 on May 3, climbing from a low of 9 in early April, officially exiting the "fear" zone and returning to "neutral," rebounding 38 points over the past month.
In April, Bitcoin gained about 12%, marking its strongest monthly performance in nearly a year, but market sentiment lagged behind the price rebound, with widespread caution about the sustainability of this rally.
Liquidation data shows that in the past 24 hours, total liquidations across the network reached approximately $166 million. Of these, short positions accounted for $105 million, over 63%, far exceeding long liquidations of $60.27 million. Bitcoin short liquidations were about $30.78 million, with longs at only $5.99 million; Ethereum short liquidations were approximately $28.02 million, longs just $7.37 million. This indicates that during Bitcoin’s four attempts to breach $80k, bearish bets have been continuously "short squeezed" by major funds.
2. Geopolitical Standoff: High oil prices become the biggest macro headwind
The US-Iran negotiations remain a Damocles sword hanging over the market. Recent reports indicate Iran no longer demands that Trump lift the blockade of the Strait of Hormuz before face-to-face talks, and is even willing to reopen this critical energy route before a formal ceasefire. However, Iran’s core condition is a permanent ceasefire, making this gesture more a strategic concession in negotiations. Meanwhile, the US Central Command continues maritime blockade operations in the Strait, with demining efforts expected to take at least six months. If the ceasefire collapses, a 60-day countdown will restart. US officials confirm that current hostilities pause and the extension of the ceasefire are "temporary," with the risk of sudden escalation always present. Even if positive signals emerge from ceasefire talks, oil prices remain high between $95 and $100 per barrel. This means inflation expectations cannot significantly decline in the short term, and the Fed’s rate cut prospects are essentially closed. March’s core PCE inflation rose to 3.2% YoY, above the previous 3%, with core inflation still manageable but not low, as high oil prices continue to transmit inflationary pressures to global risk assets through expectations. As long as the Hormuz Strait issue remains unresolved, oil prices will struggle to return quickly to comfortable levels, and macro headwinds will continue to limit crypto valuation potential.
3. Capital Flows: Ethereum defies the trend, smart money accelerates rotation
In the context of continuous outflows from Bitcoin ETFs since late April, ETF capital flows are showing clear divergence.
Bitcoin ETF: In late April, Bitcoin ETFs saw a net outflow of $137.8 million, with BlackRock’s IBIT declining for three consecutive days. On May 1st, there was a net inflow of $14.7 million, ending the streak, but the momentum was weak, far from the $2.44 billion net inflow seen in April’s peak.
Ethereum ETF: In stark contrast, Ethereum ETFs have recorded four consecutive days of net inflows totaling about $23.64 million. Although modest, this marks one of the longest recent streaks of net inflows into Ethereum ETFs. After several weeks of net outflows at the end of April, Ethereum ETFs are once again attracting capital. Morgan Stanley’s MSBT continues to see inflows, and institutional appetite for Ethereum is rebounding, explaining why ETH prices have outperformed Bitcoin recently. On May 1st, combined ETF net inflows for Bitcoin and Ethereum reached $731 million, a recent high. This suggests a broader asset reallocation rather than a single institutional move. Some previously cautious funds are shifting from high-liquidity T+0 Bitcoin trading to Ethereum ETFs. Smart money is actively voting with their capital.
4. On-Chain Depth: Exchange reserves depleted, liquidity crisis imminent
On-chain data signals the most dangerous supply shortage in recent years. Exchange reserves of Bitcoin have fallen to their lowest since 2018. According to data from Gate and CoinGlass, exchange-held BTC has dropped to about 192837465657.48T BTC, a new low since 2018. This means roughly 770k BTC have been permanently removed from tradable liquidity over the past three years. When supply shrinks rapidly while demand remains steady, a systemic price reevaluation is inevitable.
The two main holders—ETF issuers and listed companies (like Strategy)—hold over 1.2 million BTC combined, mostly locked in long-term holdings, unavailable for trading on the open market. If buy-side demand surges, current exchange balances may be insufficient to meet immediate needs, causing sharp price jumps. Whales continue accumulating heavily. Addresses holding 10 to 10,000 BTC have added about 41,000 BTC in the past two weeks, the most concentrated and sustained whale accumulation since early March. The $77,000 support level aligns with the average cost basis of these whales. Meanwhile, a whale address withdrew 400 BTC from Binance, increasing its total holdings to about 3,535 BTC (worth over $260 million). This ongoing transfer from exchanges to cold wallets reflects some large holders’ preference for long-term holdings over short-term trading.
Exchange inflows have also sharply declined, confirming this trend: no new chips are entering the market, and existing chips are continuously leaving. Once the shorts targeting $80k are squeezed out, supply-demand imbalance could trigger a sudden price spike.
Meanwhile, stablecoins are quietly increasing. Binance received a large inflow of $100 million USDT on May 2nd, part of a recent trend of about $6 billion net inflow over the past two months. On-chain data shows that within just 24 hours, $216 million USDT entered exchanges. These stablecoins are waiting for the right market entry point—once investors see an attractive price, they will convert into buy orders. The bullets are loaded and ready to fire at any moment.
5. Technical Outlook: $80k shorts under pressure, countdown to $80k
Bitcoin: The $80k level has formed a short squeeze countdown.
Bitcoin has tested the $80k mark four times without success, but technical signals indicate that the bearish space has been severely compressed.
Key levels:
- Short-term support: $77,300 (a break below would target $75,600–$76,800)
- Lower defense: $74,900 (a break here would trigger large-scale long liquidations)
- Key resistance: $80k (psychological and technical barrier after multiple attempts)
- Breakout trigger: above $80k (about $2.1 billion in short positions are gathering; a breakout could trigger a massive short squeeze)
- Ultimate target: $82,000 (if Bitcoin stabilizes above $80,000, the double top on the daily chart will be invalidated)
On the 4-hour chart, the market is gradually entering a "pre-squeeze" phase—price repeatedly approaches but fails to break through $80,000. This is not due to weak bulls but rather a sideways consolidation that exhausts bears’ patience and margin. Discussions of a double top on the daily chart are emerging, but a successful breakout above $80,000 would turn $82,000 into a key target for bulls. From a macro on-chain perspective, the "true market average" price is around $78,100—an important cost basis for Bitcoin’s spot liquidity, first broken since January 2026, signaling a potential early trend strength. This breakout suggests that pent-up demand over the past months is gradually being activated.
Liquidation warning:
- If BTC breaks above $80,000, approximately $2.1 billion in short positions will be liquidated instantly, creating a classic short squeeze.
- If it falls below $74,900, about $80k in long positions will be liquidated.
The longer the sideways consolidation, the more concentrated the liquidation ammunition becomes. Every second is building toward the final turning point.
Ethereum: Weakness brewing into strength
ETH trades around $2,325, outperforming Bitcoin with a solid technical setup.
Key levels:
- Short-term support: $2,300 (a break below would test $2,100–$2,200)
- Lower defense: $2,000
- Key resistance: $2,400 (a volume breakout could open the way to $2,500–$2,600)
On the technical front, ETH/BTC is strengthening, showing signs of rotation for the first time in weeks. The main difference from Bitcoin is that Ethereum has not accumulated large-scale short positions. ETF inflows and on-chain activity are supporting a solid independent rally.
6. Liquidation Alert: $80k critical threshold under dual squeeze
The most dangerous feature now is the dual concentration of liquidations reaching critical levels. According to CoinGlass, if BTC breaks above $80,000, major CEXs could see short liquidations totaling around $1.07 billion, concentrated between $80,000 and $82,000. These short positions are maintained with high leverage, and the longer they last, the lower the forced liquidation price drifts. Sideways markets are quietly "killing" bearish traders.
Similarly, for Ethereum, if it breaks through $2,460–$2,500, CEXs could see liquidations of several hundred million dollars. This dual squeeze means that once the market chooses a direction, volatility will be amplified by the liquidation engine—both upward and downward. Until leverage is fully unwound, every move is on a knife’s edge.
7. Trading Outlook: Consolidation narrows, the direction is imminent
Short-term traders should be cautious as the market is on the eve of a potential breakout—prefer to watch more and act less until the trend becomes clear. Specific signals to watch:
Bitcoin: Focus on whether $79,500–$80,000 can be volume-breakout.
- Breakout could rapidly push prices to $82,000–$83,000.
- Falling below $77,000 support warns of a correction to $75,000–$76,000.
Ethereum: Watch for volume breakout above $2,400.
- If successful, consider light long positions targeting $2,500–$2,600.
- If it drops below $2,250, cut losses promptly.
Dual strategy: The sideways range could break at any moment. Aggressive traders can buy at $77,500–$79,000 and sell at the top, but must set strict stop-losses—above at $80,500, below at $76,800.
Ethereum’s rally: ETH/BTC is accelerating rotation, so small long positions could profit from the rebound. Long-term holders can consider building positions below $75,000 in stages.
Exchange reserves depletion, declining miner difficulty, and continued institutional ETF buying are jointly driving a structural supply-demand reversal. The key debate is whether geopolitical risks will release first (favoring bears) or liquidity tightening will trigger price surges (favoring bulls).
For long-term holdings, holding the core position is more effective than frequent timing.
Key Risks:
- Massive liquidation above $80,000: Short positions are not yet forcibly closed, and a breakout could trigger rapid squeezes.
- Double-sided liquidation vulnerability: Large liquidation clusters exist just below $77,000 and above $80,000; a breach of support or resistance could amplify volatility.
- Geopolitical risks: US-Iran ceasefire remains "temporary," and any change could reverse risk appetite.
- Miner exit and hash rate decline: On May 1st, Bitcoin difficulty was cut for the second time this month by 2.3%, with total hash rate dropping below 1 ZH/s. Weak miners’ exit reduces selling pressure but also reflects market uncertainty. Difficulty reduction also lowers unit costs for remaining miners, with neutral effects on price needing further assessment.
- ETH at $2,300 support is critical: Losing this level could quickly sour market sentiment and drag Bitcoin down.
This is for informational sharing only and not investment advice! Wishing everyone smooth trading!!
repost-content-media
  • Reward
  • 3
  • Repost
  • Share
ybaser:
Just charge forward 👊
View More
Ryakpanda
#Gate广场五月交易分享 BlackRock Lobbying to Shape US Stablecoin Regulation
BlackRock is actively influencing the future of US stablecoin regulation by submitting a detailed comment letter to the Office of the Comptroller of the Currency (OCC) regarding the GENIUS Act. The asset management firm is pushing back against the proposed limit of 20% on tokenized assets in stablecoin reserves, a rule that would directly restrict the growth of its own tokenized Treasury fund BUIDL. BlackRock is also seeking clear confirmation that Treasury ETFs qualify as eligible reserve assets. This strategic lobbying aims to position BlackRock’s products as infrastructure within the regulated digital asset economy. If successful, it will solidify BUIDL’s role as a primary reserve asset for US-based stablecoins, demonstrate a deep institutional commitment to the tokenized market, and shape the competitive landscape for years to come.
repost-content-media
  • Reward
  • 3
  • Repost
  • Share
ybaser:
Just charge forward 👊
View More
View Original
HighAmbition
#GateSquareMayTradingShare
WHY YOUR STOP LOSS ALWAYS GETS HIT BEFORE THE MARKET MOVES IN YOUR DIRECTION
This is not bad luck. This is not randomness. This is engineered market structure, smart money psychology, and liquidity mechanics working in perfect harmony to extract value from predictable retail behavior.
In today’s Bitcoin market hovering around $78,500, we are in a classic consolidation zone where both bullish and bearish positions are heavily clustered. Price isn’t wandering aimlessly — it is deliberately probing liquidity pools on both sides before committing to the next major directional leg. Most traders lose here not because their analysis is wrong, but because they fail to understand that their stop loss is often the very fuel the market needs.
THE CORE TRUTH: STOP LOSSES = LIQUIDITY POOLS
Large institutions, whales, and market makers cannot enter or exit multi-million or billion-dollar positions without sufficient liquidity. They need opposing orders to absorb their size without massive slippage.
Where does this liquidity come from?
Retail stop losses
Panic sells/buys
Overleveraged liquidations
Late breakout entries
Emotional FOMO/FUD reactions
Your stop loss is not hidden. In aggregated order flow data, clustered stops appear as clear liquidity zones. Algorithms and smart money target these zones first because that’s where the easiest order execution happens.
Markets do not move toward “fair value” — they move toward liquidity. Once liquidity is swept (collected), the real directional move often begins.
THE CLASSIC STOP LOSS HUNT MECHANISM — STEP BY STEP
Retail identifies obvious level
Example: Support at $75,000 or Resistance at $80,000.
Predictable placement
Longs put stops 1-2% below support ($74,500–$74,800)
Shorts put stops above resistance
Breakout traders set buy-stops or limit orders at round numbers
The hunt phase
Price is driven toward the cluster with increasing speed. Volume spikes as liquidations cascade and fuel the move.
Liquidity collection
Stops are triggered → large block of orders executed → smart money enters/exits the opposite side.
Reversal & real move
Price reverses sharply. The original directional bias you expected now plays out — but without you in the trade.
This pattern repeats across timeframes: 15-minute wicks, daily fakeouts, and weekly liquidity sweeps.
UPWARD STOP HUNT (BULL TRAP / SHORT SQUEEZE LIQUIDATION)
Scenario at $78,500:
Resistance cluster at $80,000 (psychological round number)
Short sellers’ stops and retail breakout buy orders stacked above
Price raids $81,000–$82,500 on strong volume and green candles
Social media turns euphoric, FOMO buying accelerates
Short liquidations add rocket fuel
Then the trap:
Sharp rejection candle with long upper wick
Price collapses back below $78,500, often targeting the lower liquidity pool
Result:
Late longs trapped at highs
Shorts liquidated at worst possible moment
Smart money distributed into strength
DOWNWARD STOP HUNT (BEAR TRAP / LONG LIQUIDATION)
Opposite scenario:
Support at $75,000 breaks
Panic selling + long liquidations drive price to $74,000 or $72,000–$70,000 zone
Headlines scream “Bitcoin crash”
Weak hands capitulate
Then the reversal:
Aggressive buying appears from lower liquidity pool
Price sweeps lows, reverses, and climbs back through $78,500 toward $80K+
Result:
Cheap accumulation by smart money
Panic sellers miss the rebound
Bears who shorted the low get squeezed
WHY YOUR STOPS ARE “TOO OBVIOUS”
Retail behavior is highly correlated because:
Same YouTube channels, Twitter accounts, and TradingView setups
Same textbook support/resistance rules
Same risk management teachings (tight stops below/above candles)
Emotional clustering around round numbers ($70K, $75K, $80K, $100K)
This creates liquidity symmetry that institutions can map and exploit with high precision.
VOLUME + WICK STRUCTURE — THE TELLTALE SIGNS
During a hunt:
Explosive volume spike
Long wick (upper or lower)
Fast move into obvious level
Immediate reversal on decreasing volume
After liquidity sweep:
Volume dries up
Price consolidates or trends cleanly
Higher probability continuation
Many traders get stopped out, then watch the market move in their original direction with perfect structure — the classic “wrong twice” feeling.
PSYCHOLOGY: THE INVISIBLE FUEL
Greed → Late entries at breakouts
Fear → Premature exits at breakdowns
Hope → Holding through hunts
FOMO → Chasing wicks
Smart money doesn’t fight this psychology — they engineer it.
PROFESSIONAL APPROACH — HOW TO STOP FEEDING LIQUIDITY
Wait for the sweep: Enter after obvious liquidity has been taken, not before.
Wider invalidation: Use structural levels (higher timeframe swing points) instead of tight candle-based stops.
Avoid round numbers for stops — place them in less obvious zones.
Lower leverage in consolidation/uncertain zones.
Think in liquidity terms: Ask “Where will stops be clustered?” instead of “Where will price go?”
Multiple timeframe confirmation: Look for alignment across daily + 4H + 1H.
Position sizing: Risk less when liquidity hunts are probable.
Fakeout trading: Some advanced traders deliberately trade the manipulation phase.
CURRENT BTC LIQUIDITY MAP — MAY 2026 ($78,500)
Upper Liquidity Pool: $80,000 – $83,000+
(Short stops, breakout buys, FOMO targets)
Lower Liquidity Pool: $74,000 – $70,000
(Long stops, panic liquidation clusters, support breaks)
Most probable near-term behavior:
Sweep one side aggressively → trap participants → reverse and target the opposite pool → then expansion into the real trend.
THE HARDEST TRUTH
Your stop loss isn’t being hunted personally. It is simply part of a statistically predictable liquidity map that the market clears before its next major move.
The market is mechanical, not emotional.
If your placement is obvious, your exit was already priced in.
ULTIMATE POWER LINE:
“The market does not punish your stop loss — it collects what was always predictable. Master liquidity, or remain part of the liquidity.”
Trade less. Observe more. Think like the institutions, not like the crowd.
Once you internalize that price is the distraction and liquidity is the truth, your entire trading psychology shifts — and so do your results.
Stay disciplined.#GateSquare #CreatorCarnival #ContentMining
repost-content-media
  • Reward
  • 4
  • Repost
  • Share
ybaser:
Just charge forward 👊
View More
  • Pin