CollectionOfExcellentBlogger
AI Analysis: $HMSTR/USDT
Entry Price: 0.000222–0.000228
Target Price:
- TP1: 0.000210
- TP2: 0.000195
Stop Loss: Above 0.000242
Reasons for Selling:
1. Pattern Confirmation:
- A "double top" reversal structure has formed on the daily chart (neckline at 0.000210), with a top depth of 0.000032 (0.000242-0.000210)
- Measured decline = top depth × 1.618 = 0.000052 → Target price 2 = 0.000242-0.000052=0.000190 (rounded to 0.000195)
2. Trend Structure:
- Weekly chart has broken below the 2024 uptrend line (connecting 0.000195→0.000210), price is below MA(50) 0.000225
- RSI(14
HMSTR-0.75%
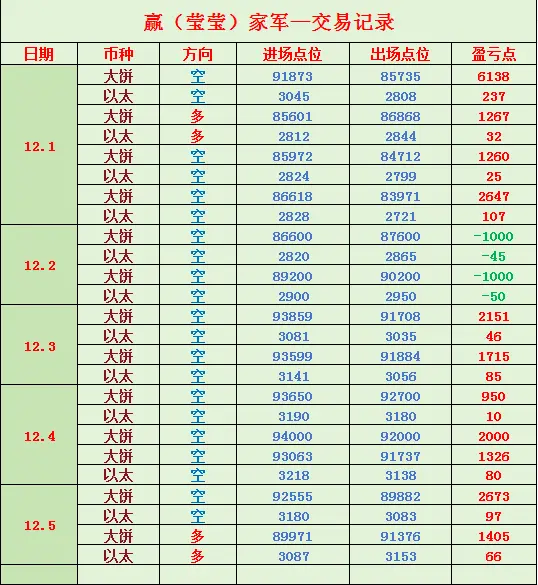
[The user has shared his/her trading data. Go to the App to view more.]