Qifei
vip
Quant Trader
Futures Trading Strategist
No content yet
From the market data, NEWT is currently in a strong pump trend, but there may be a pullback demand in the short term. The key levels are as follows:
support level
- Strong support: 0.5584 (a support level tested multiple times in the past, breaking below may indicate weakness)
- Short-term support: 0.6352 (recent pullback low, suitable for light position long testing)
resistance level
- Short-term resistance: 0.6950 (24-hour high, may accelerate after breaking through)
- Strong resistance: 0.7120 (psychological barrier, may surge towards 0.8+ after breaking through)
Entry position
- Radicals:
NEWT86.85%
View Original
  • Reward
  • Comment
  • Share
7.24 Bit Morning Analysis
After BTC surged to 118491, it fell back to the support at 117384, while ETH reached a high of 3614 and then pulled back to stabilize at 3528. The market maintains a bearish pattern, but the pullback is limited, showing characteristics of short-term opportunities.
**Technical Analysis**
The 4H level has continuously formed long lower shadow candlesticks, indicating strong buying support below. Despite repeated pressure from bears, the price has still managed to hold the key level of the middle band of the Bollinger Bands, and the bottom-rebound pattern suggests that b
BTC0.08%
ETH-1.13%
View Original
  • Reward
  • Comment
  • Share
Evening analysis on 7.23$
Bollinger Bands hourly level
- The channel shows a明显向下开口形态, with the upper track continuously applying pressure.
- The price is running along the lower track, causing the lower track to shift downwards, indicating a bearish dominance pattern.
- The short-term downward trend has sufficient momentum and is relatively strong in continuity.
Four-hour level
- Continuous bearish line tests the mid-level support
- The trading volume has not shrunk, and the support level is facing a risk of breakdown.
Hourly Chart Features
- Bearish candles dominate with spo
BTC0.08%
ETH-1.13%
View Original
  • Reward
  • Comment
  • Share
Bitcoin has encountered resistance and retreated at the 120,000 level, currently in a phase of consolidation. It has not yet formed a unilateral trend, and it is expected to continue maintaining range fluctuations in the short term.
Operational Strategy
✅ Sell high and buy low: Before breaking through the oscillation range, it is recommended to adopt a sell high and buy low strategy.
✅ Breakthrough Following: If the price strongly breaks through the range, then layout the next wave of market trends accordingly.
Specific point reference
🔻 Short selling opportunity: A rebound to around 120,000
BTC0.08%
View Original
  • Reward
  • Comment
  • Share
7.23 Bit Morning Thought Analysis
From the hourly chart, Bitcoin is currently running along the upper Bollinger Band, with a continuous appearance of "long upper shadow + small bullish candle" combinations, indicating that there is significant selling pressure above, and the bulls seem to be struggling to push further.
The red bars of MACD are shortening, and the two lines of DIF and DEA are about to stick together at a high position, which may form a death cross at any moment. If the price does not push up, the bears are likely to start gaining strength. The three lines of KDJ are still lying
BTC0.08%
ETH-1.13%
View Original
  • Reward
  • Comment
  • Share
Breaking news! Powell concluded his speech without mentioning his resignation at all.
However, the senators remained firm in their views and strongly urged Powell to resign. Meanwhile, rumors about his impending departure became more and more rampant.
View Original
post-image
  • Reward
  • Comment
  • Share
7.22 Evening Ether Analysis $BTC $ETH
From the 4-hour chart, the market has now entered a clear consolidation phase, with prices fluctuating back and forth within a fixed range. There is strong resistance above, as prices cannot break through that level; there is also support below, as prices tend to bounce back when they reach that level, typical of a "top on the upside and a bottom on the downside" trend.
Technical indicators:
- The MACD indicator is oscillating around the zero line, indicating that both the bulls and bears are evenly matched.
- The RSI indicator hovers around 50, indicating
ETH-1.13%
BTC0.08%
View Original
  • Reward
  • Comment
  • Share
Another Ether 3720 short layout was given at midday, with precise entry positions provided. Undoubtedly, the first target point has not yet been reached, but it has indeed moved 80 points! Currently, it is still being held!
View Original
  • Reward
  • Comment
  • Share
Morning analysis of 7.22
Last night, Bitcoin first fell and then rose, being pushed down from around 118,400 all the way to 116,600. This morning, the bulls began to fight back and it is now fluctuating around 117,200. Ethereum also followed suit, dropping from 3,815 to 3,716, and is currently rebounding to around 3,760.
Short-term trend analysis:
Looking at the 1-hour chart, Bitcoin has consecutively closed several bullish candles, indicating that the bulls are gradually gaining strength. Although the MACD is still underwater, the green bars are shortening, suggesting that the bearish momentu
BTC0.08%
ETH-1.13%
View Original
  • Reward
  • Comment
  • Share
7.21 Ether Evening Thought Analysis
Ethereum has broken through with consecutive bullish candles, and there has been no significant pullback at the daily level, indicating that bullish funds continue to flow in, with the short-term trend still dominated by buyers.
- Key resistance level: $4000 is a psychological barrier, but be aware that there may be some profit-taking pressure in the 3900-3950 range (such as derivative hedging or institutional profit-taking).
-Support levels: 3770 (short-term), 3680 (trend watershed). If the pullback does not break 3680, the upward channel remains vali
ETH-1.13%
BTC0.08%
View Original
  • Reward
  • 12
  • Share
JustBeHappyvip:
Just go for it💪
View More
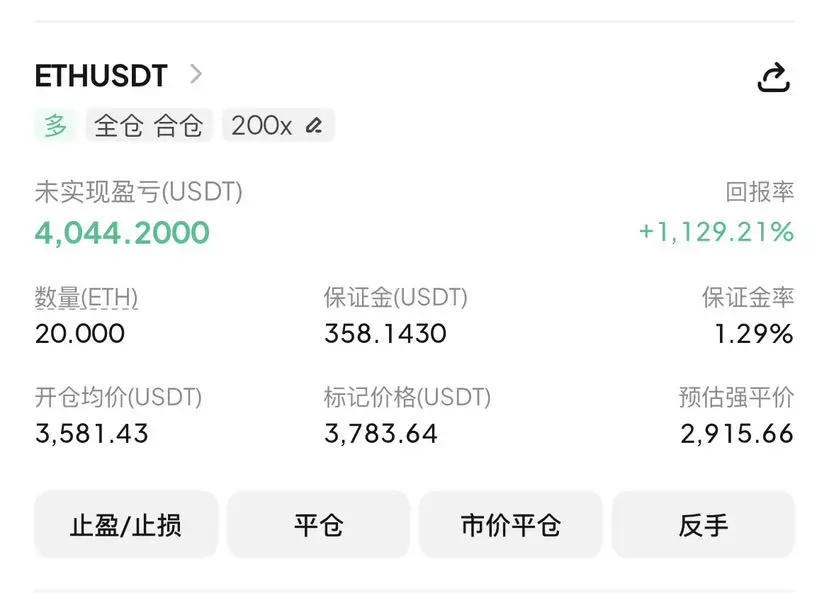
Ether long order gained 200 points, continue to hold, waiting for it to go up to 4000! Follow Qifei, daily updates on strategies for free.
ETH-1.13%
View Original
post-image
  • Reward
  • 1
  • Share
SoaringFreelyvip:
So awesome, Flying Brother please take me along.
7.21 Morning Ethereum Market Analysis and Trading Suggestions
Market Review
The recent trend of Ethereum has been rather unusual. It was originally expected to fluctuate within a range over the weekend. Saturday basically met expectations, maintaining a range-bound movement; however, on Sunday, there was a unilateral upward movement, briefly breaking through the **3800** key defense line, forming a short-term divergence. However, the market was unable to stabilize and quickly fell back. **Just during the recent analysis period, ETH plummeted below 3600, reaching a low of around 3680, and then
ETH-1.13%
View Original
  • Reward
  • Comment
  • Share
Analysis of thoughts on the evening of July 20
Market Review and Analysis:
1. Bitcoin ( big cake ):
The daytime market started around 117,200 and showed a stepwise upward oscillation.
The price ultimately ran to around 118,200 and entered a consolidation phase.
4-hour level: Observed a reduction in bullish trading volume. The current key resistance level is at 118,500, and attention should be paid to whether the price can effectively break through and hold this position; the key support level is around 117,000.
1-hour level: Bullish trading volume is gradually increasing, and the price pattern
BTC0.08%
ETH-1.13%
View Original
  • Reward
  • Comment
  • Share
7.20 BTC midday strategy analysis
The market continued its previous narrow range oscillation over the weekend, showing a stable overall performance. From the daily chart perspective, all technical indicators are signaling a pullback, so the intraday trading strategy should focus on looking for pullbacks after rebounds. It is expected that the market will still maintain a small range oscillation trend. The trading strategy can maintain a high sell and low buy rhythm.

On the daily level, pay close attention to the short-term resistance levels in the range of 119000 and 118500 above, while the
BTC0.08%
View Original
  • Reward
  • Comment
  • Share
Litecoin crazy bull market starts! Current price 112 dollars (¥800) big pump 10% enters the rise leaderboard 🔥 24-hour explosive pump 740 million in trading volume, close your eyes and All in! 🚀💥
LTC-3.82%
View Original
post-image
  • Reward
  • Comment
  • Share
Morning analysis of thoughts on 7.20
The overall trend remains in a fluctuating downward pattern. In the early morning, the price briefly fell to around 117,200. In the short term, the market lacks significant trading volume, making the possibility of effectively breaking through the current situation relatively low.
Four-hour level analysis:
Bollinger Bands: The three lines are nearly parallel and diverging, indicating that the forces of both bulls and bears are relatively balanced, and the market is in a critical transitional period for directional choice.
MACD: The fast line is gradually ap
BTC0.08%
ETH-1.13%
View Original
  • Reward
  • Comment
  • Share
Analysis of thoughts on the evening of July 19
The midday market shows limited fluctuations, with the current price hovering around 118200, undergoing narrow consolidation. Both bulls and bears are currently at a stalemate, with neither side gaining a significant advantage.
Observing the hourly chart, the Bollinger Bands exhibit a "converging parallel" pattern— the distance between the upper, middle, and lower bands is gradually narrowing, and the trend is tending to be parallel. This pattern usually indicates that market volatility will decrease in the short term, and there is a high probabil
BTC0.08%
ETH-1.13%
View Original
  • Reward
  • Comment
  • Share
  • Topic
    1/3
  • Pin
Trade Crypto Anywhere Anytime
qrCode
Scan to download Gate app
Community
English
  • 简体中文
  • English
  • Tiếng Việt
  • 繁體中文
  • Español
  • Русский
  • Français (Afrique)
  • Português (Portugal)
  • Bahasa Indonesia
  • 日本語
  • بالعربية
  • Українська
  • Português (Brasil)