


Trader Xia Lao Zheng's thought sharing on Thursday, 8.7 in the early morning:
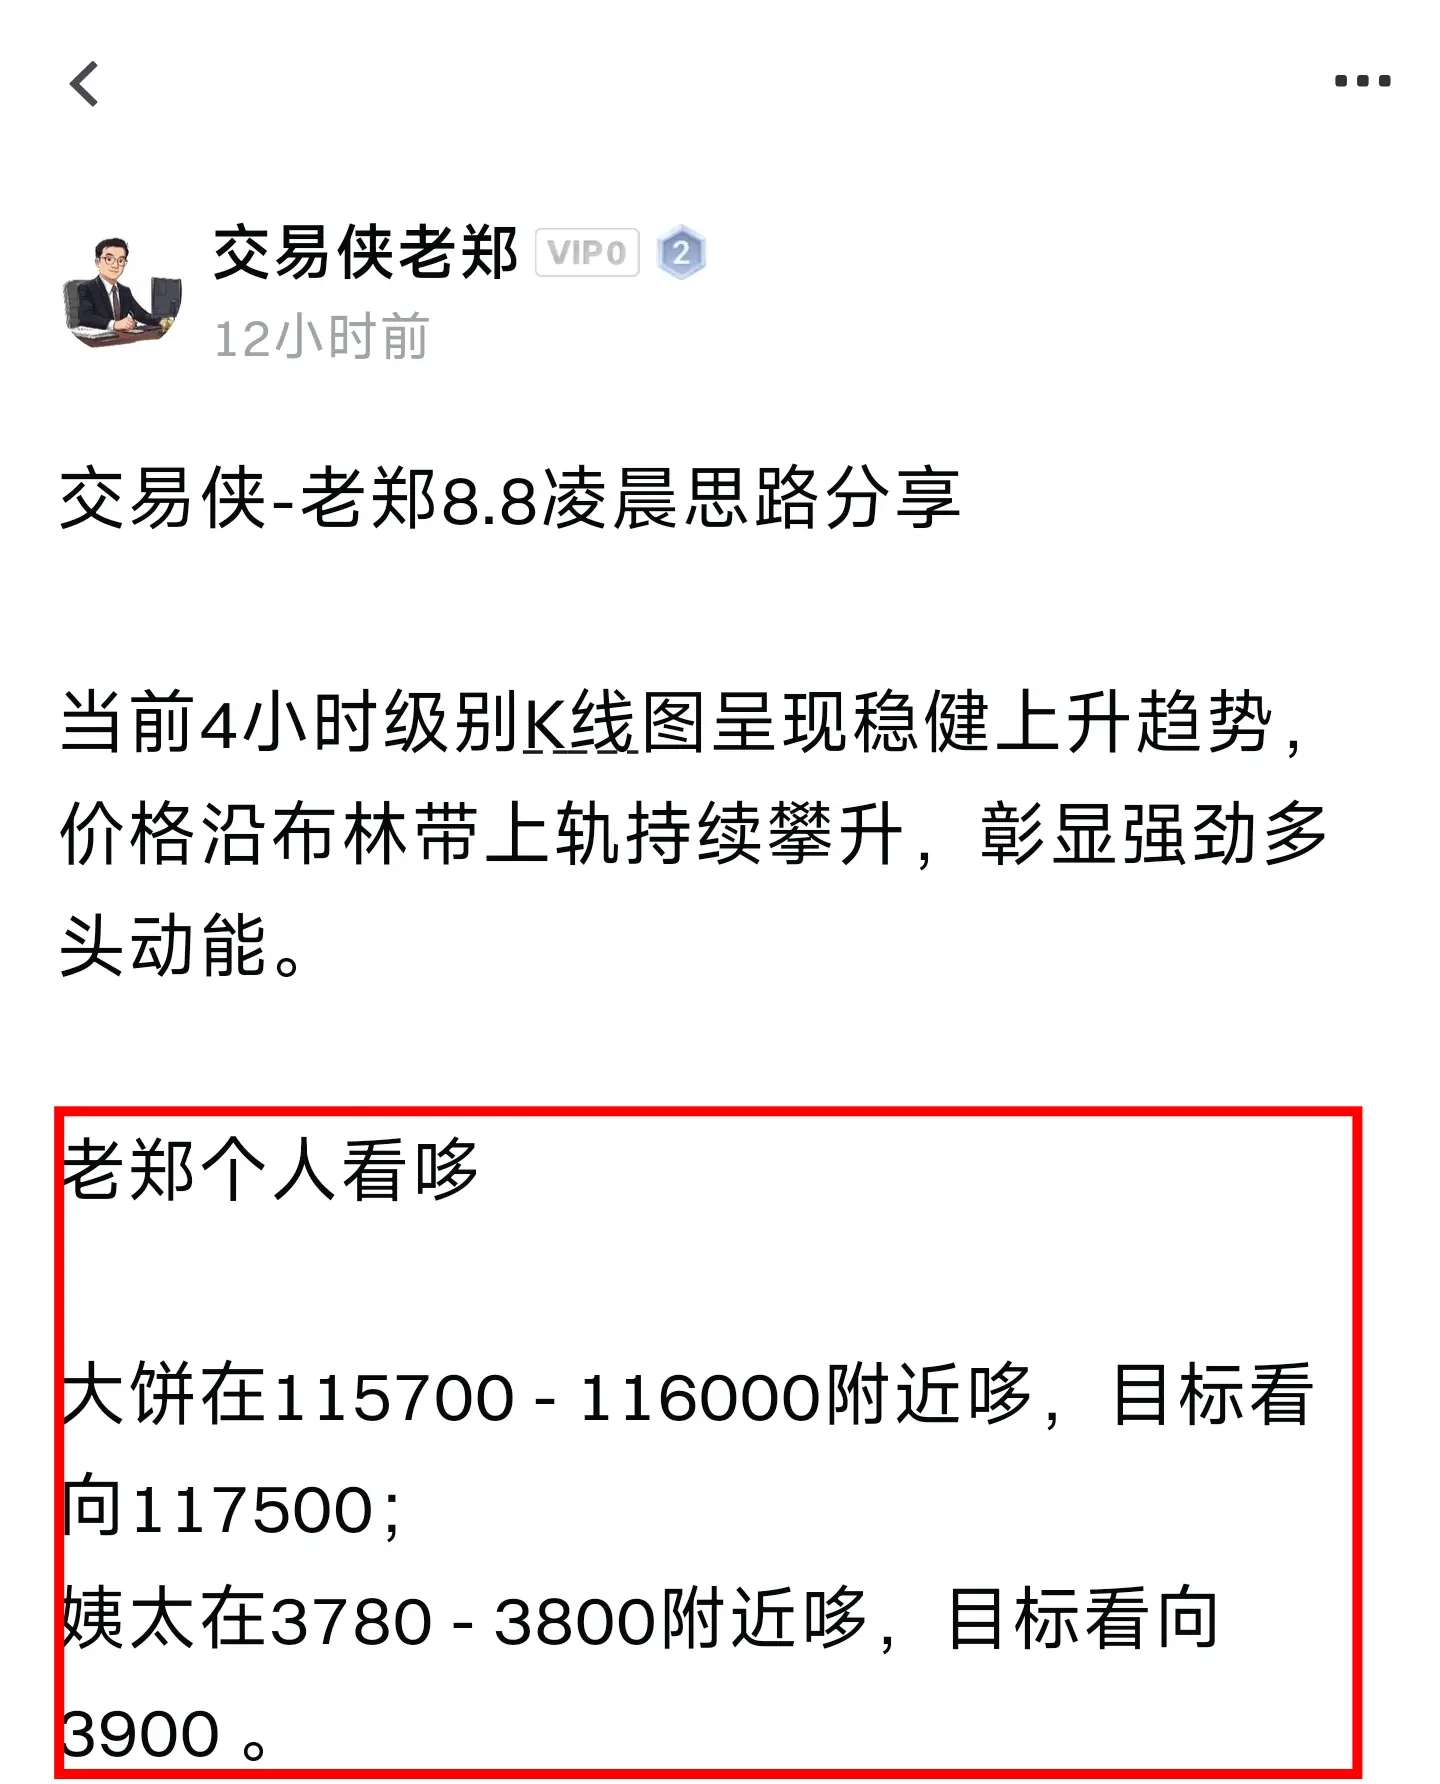
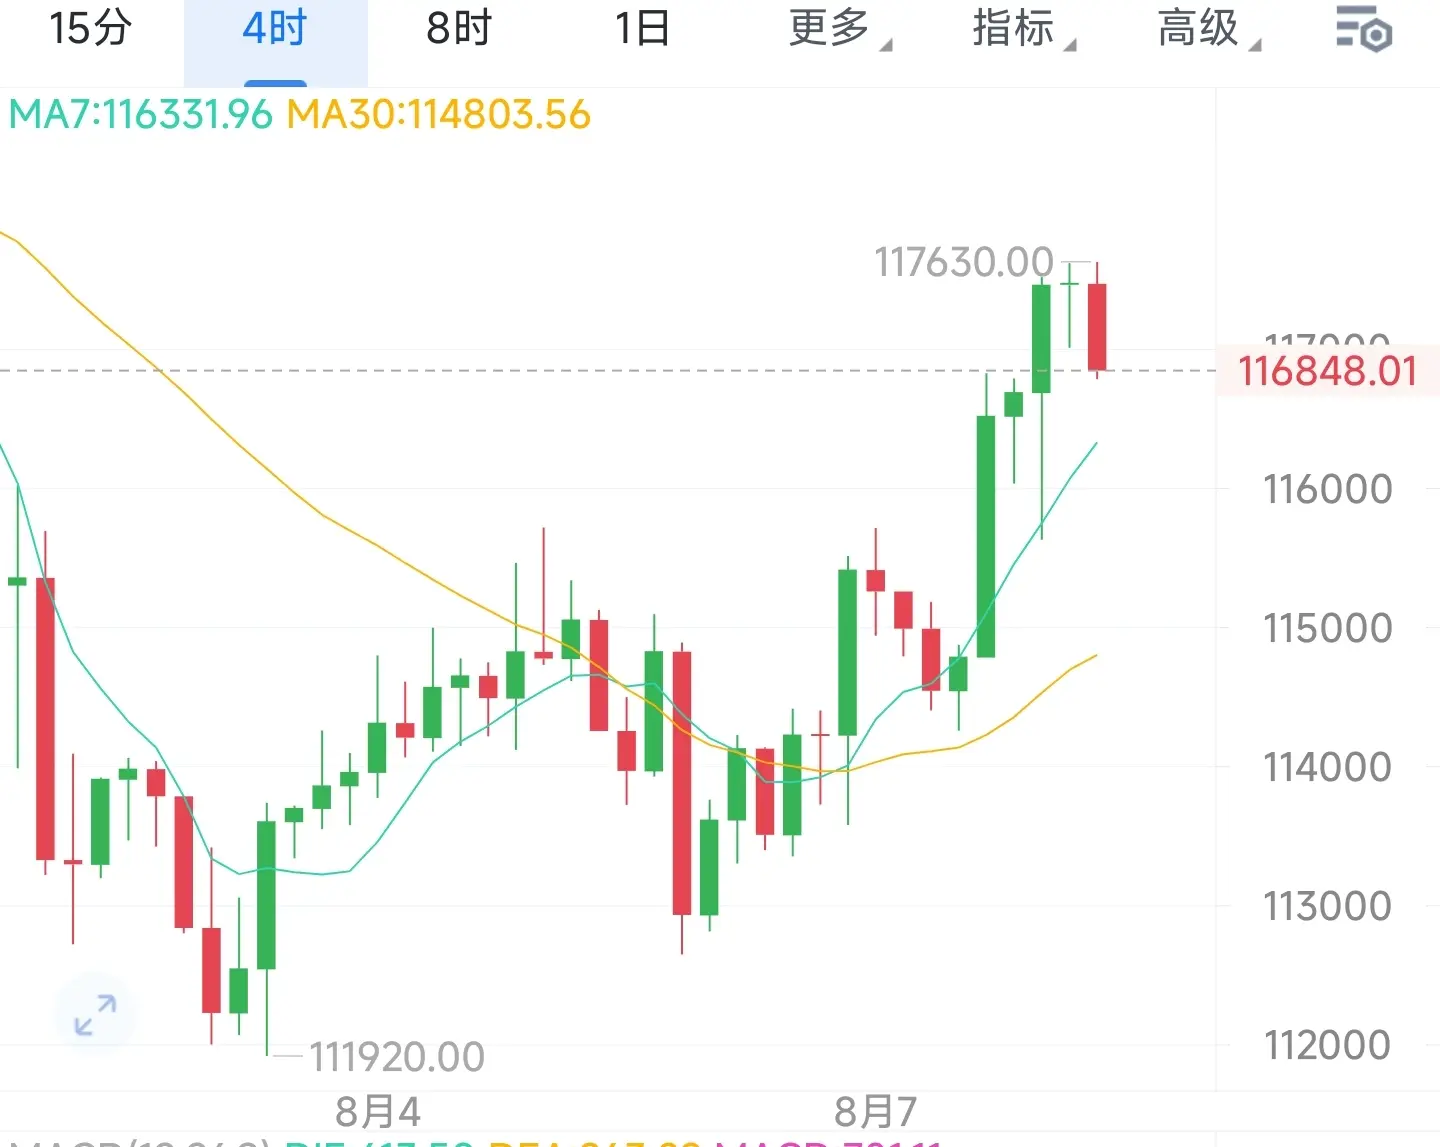
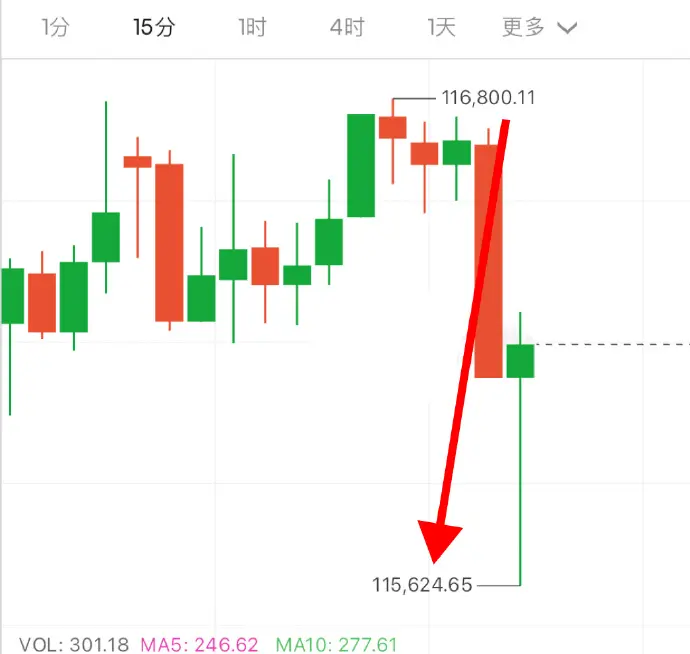
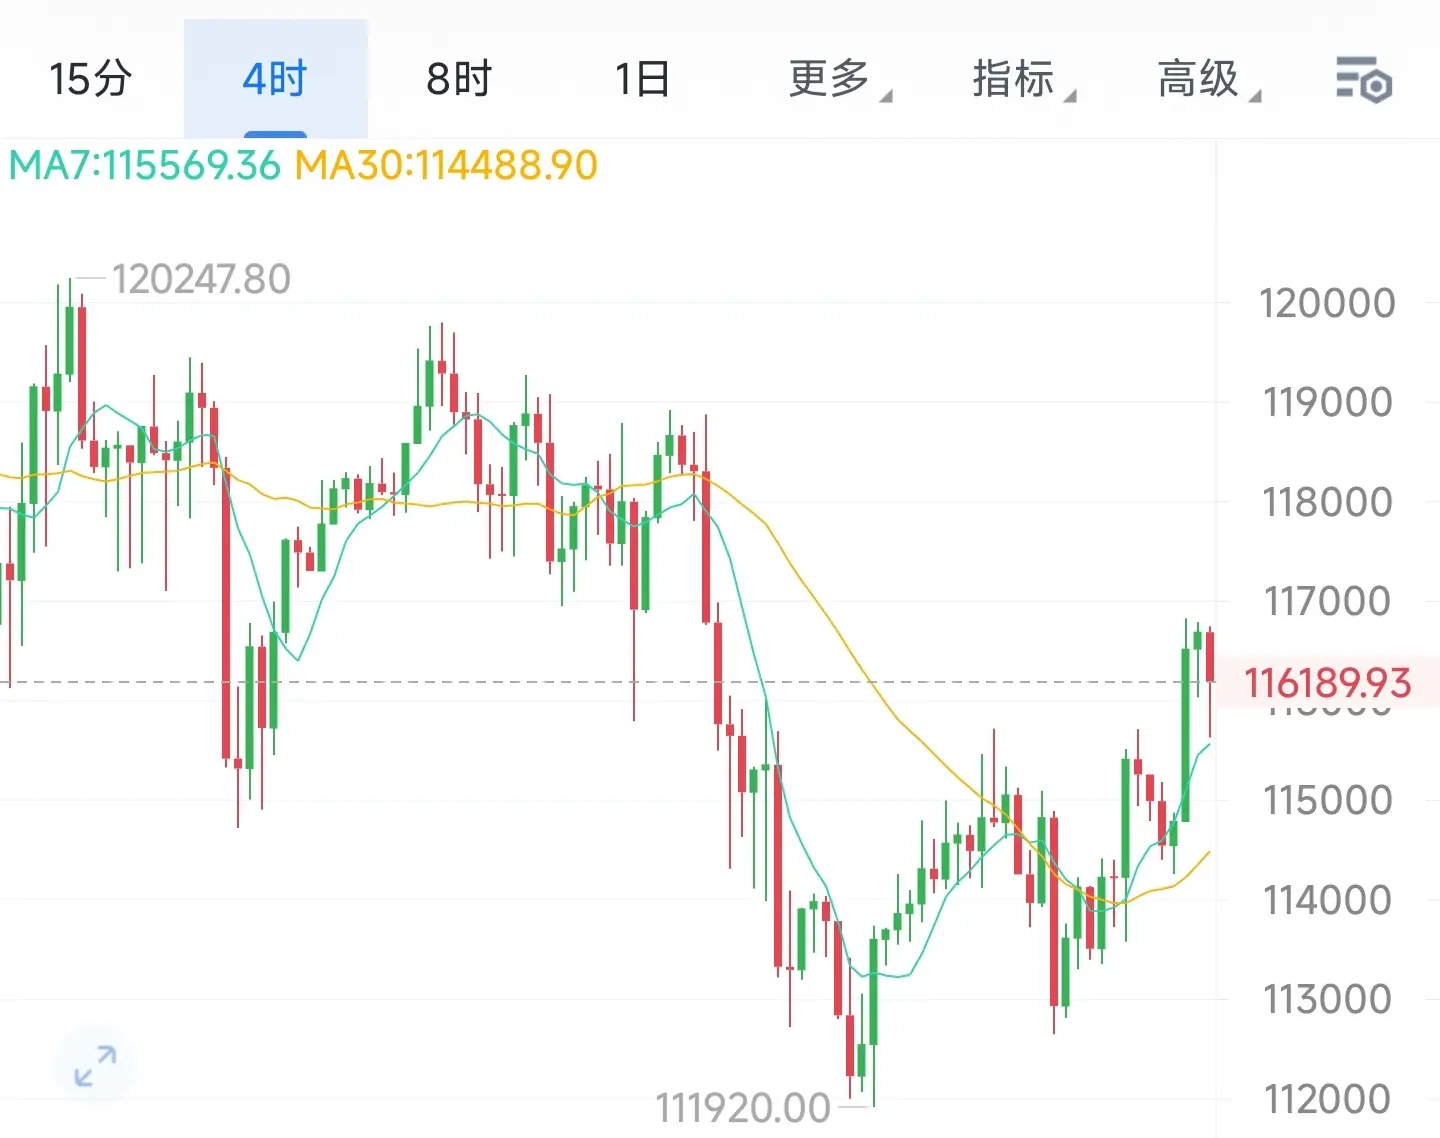
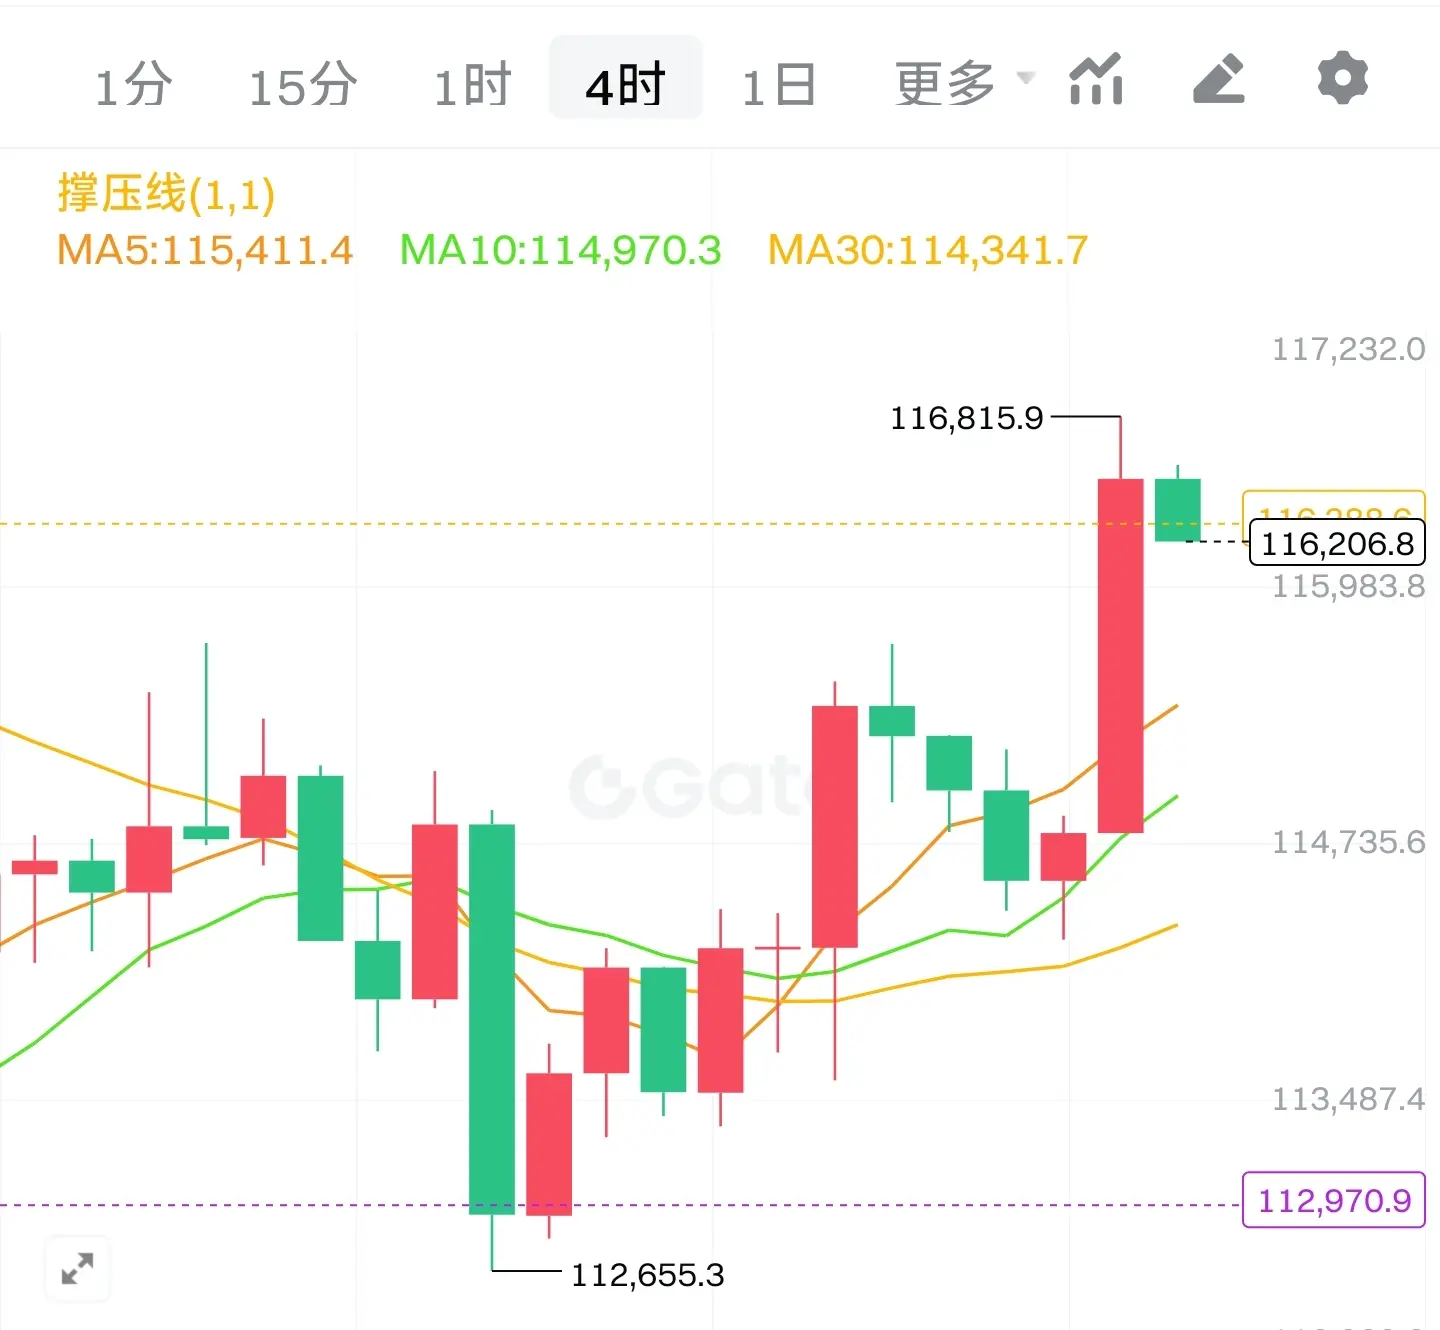
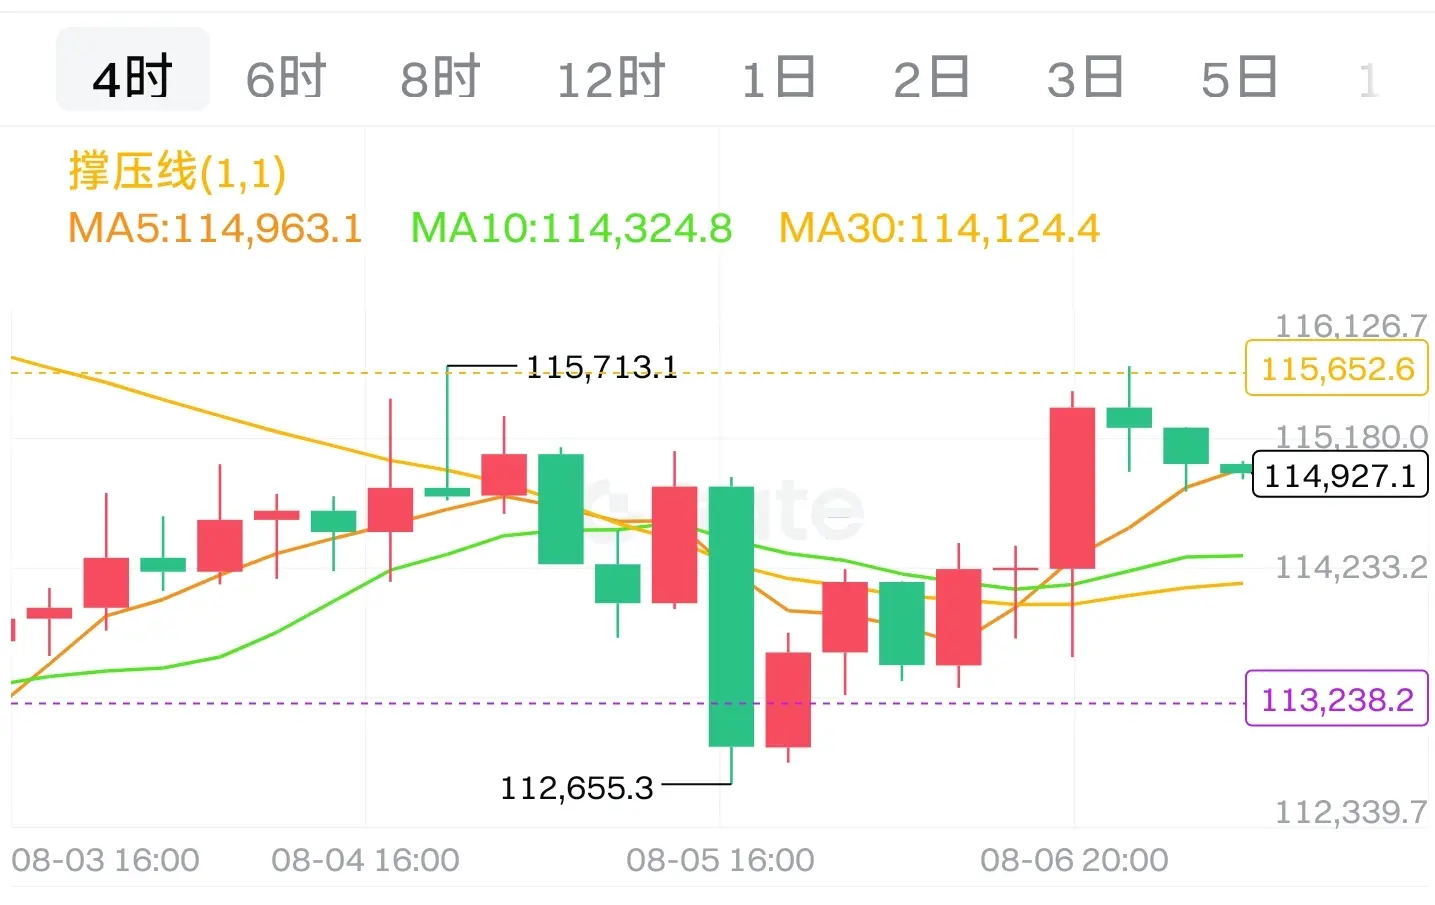
Analyzing the 4-hour chart of Bitcoin, the Bollinger Bands show a converging pattern followed by a weakening trend. It is highly likely that the price will rebound and then fall back from the high.
Currently, although the K-line is running close to the upper track, the existence of the upper track as a short-term resistance level has a certain impact on the continuity of the K-line. If a long upper shadow or a decrease in volume occurs when close to the upper track, it may indicate that the upper track's resistance i
View OriginalAnalyzing the 4-hour chart of Bitcoin, the Bollinger Bands show a converging pattern followed by a weakening trend. It is highly likely that the price will rebound and then fall back from the high.
Currently, although the K-line is running close to the upper track, the existence of the upper track as a short-term resistance level has a certain impact on the continuity of the K-line. If a long upper shadow or a decrease in volume occurs when close to the upper track, it may indicate that the upper track's resistance i