EL vs RUNE: Comparing Two Emerging Blockchain Tokens and Their Market Potential in 2024

Introduction: EL vs RUNE Investment Comparison
In the cryptocurrency market, the comparison between EL and RUNE has always been a topic that investors cannot avoid. The two not only show significant differences in market capitalization ranking, use cases, and price performance, but also represent different positioning strategies within the crypto asset landscape.
EL (ELYSIA): Since its inception, it has gained market recognition through its positioning as an RWA tokenization protocol that enables the trading of real-world assets around the world on blockchain.
RUNE (THORChain): Since its launch, it has been recognized as a highly optimized multi-chain protocol utilizing PBFT consensus, serving as the native utility token of the THORChain ecosystem with applications in transaction fees, liquidity provision, and block rewards.
This article will comprehensively analyze the investment value comparison between EL and RUNE from multiple dimensions including historical price trends, supply mechanisms, trading volume, and market positioning, while attempting to answer the question investors care most about:
"Which is the better buy right now?"
Comparative Analysis Report: ELYSIA (EL) vs THORChain (RUNE)
I. Price History Comparison and Market Status
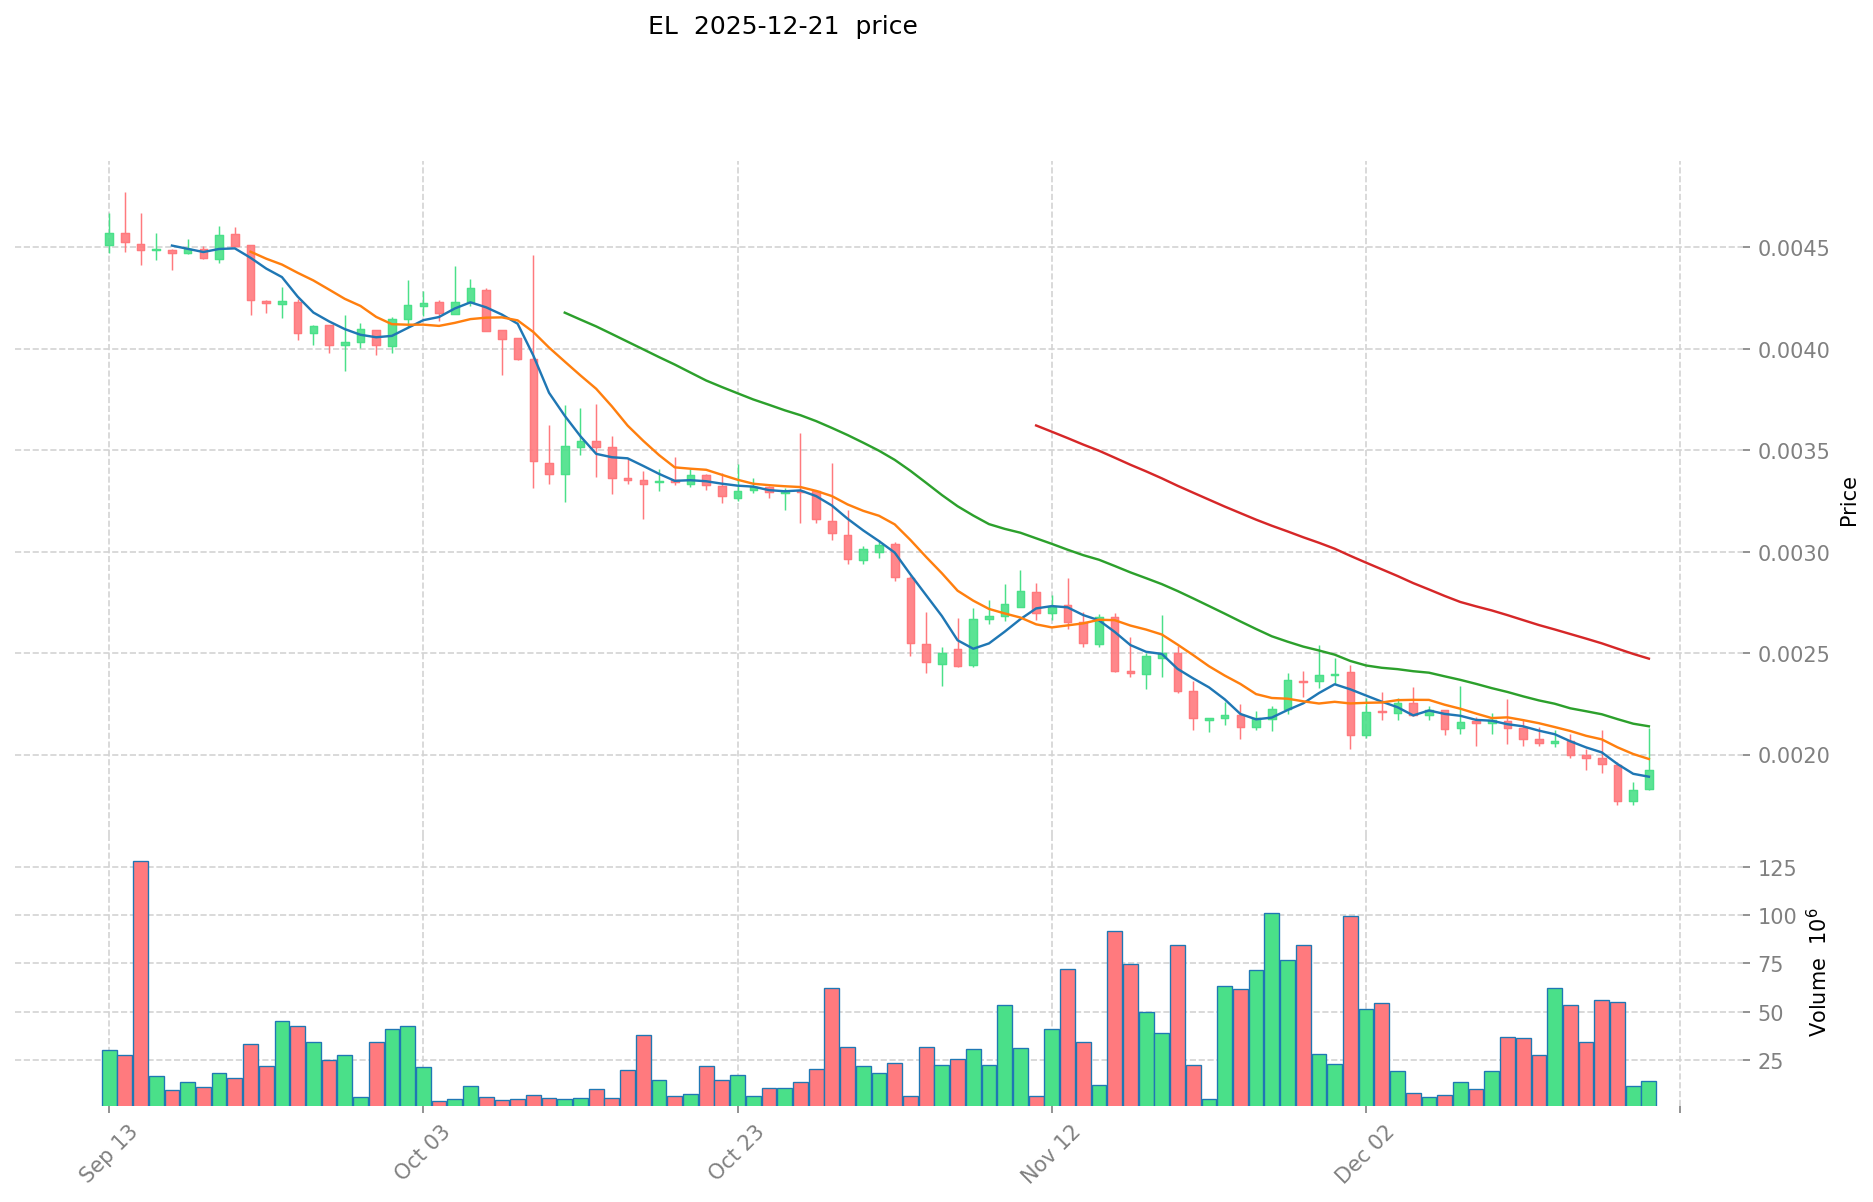
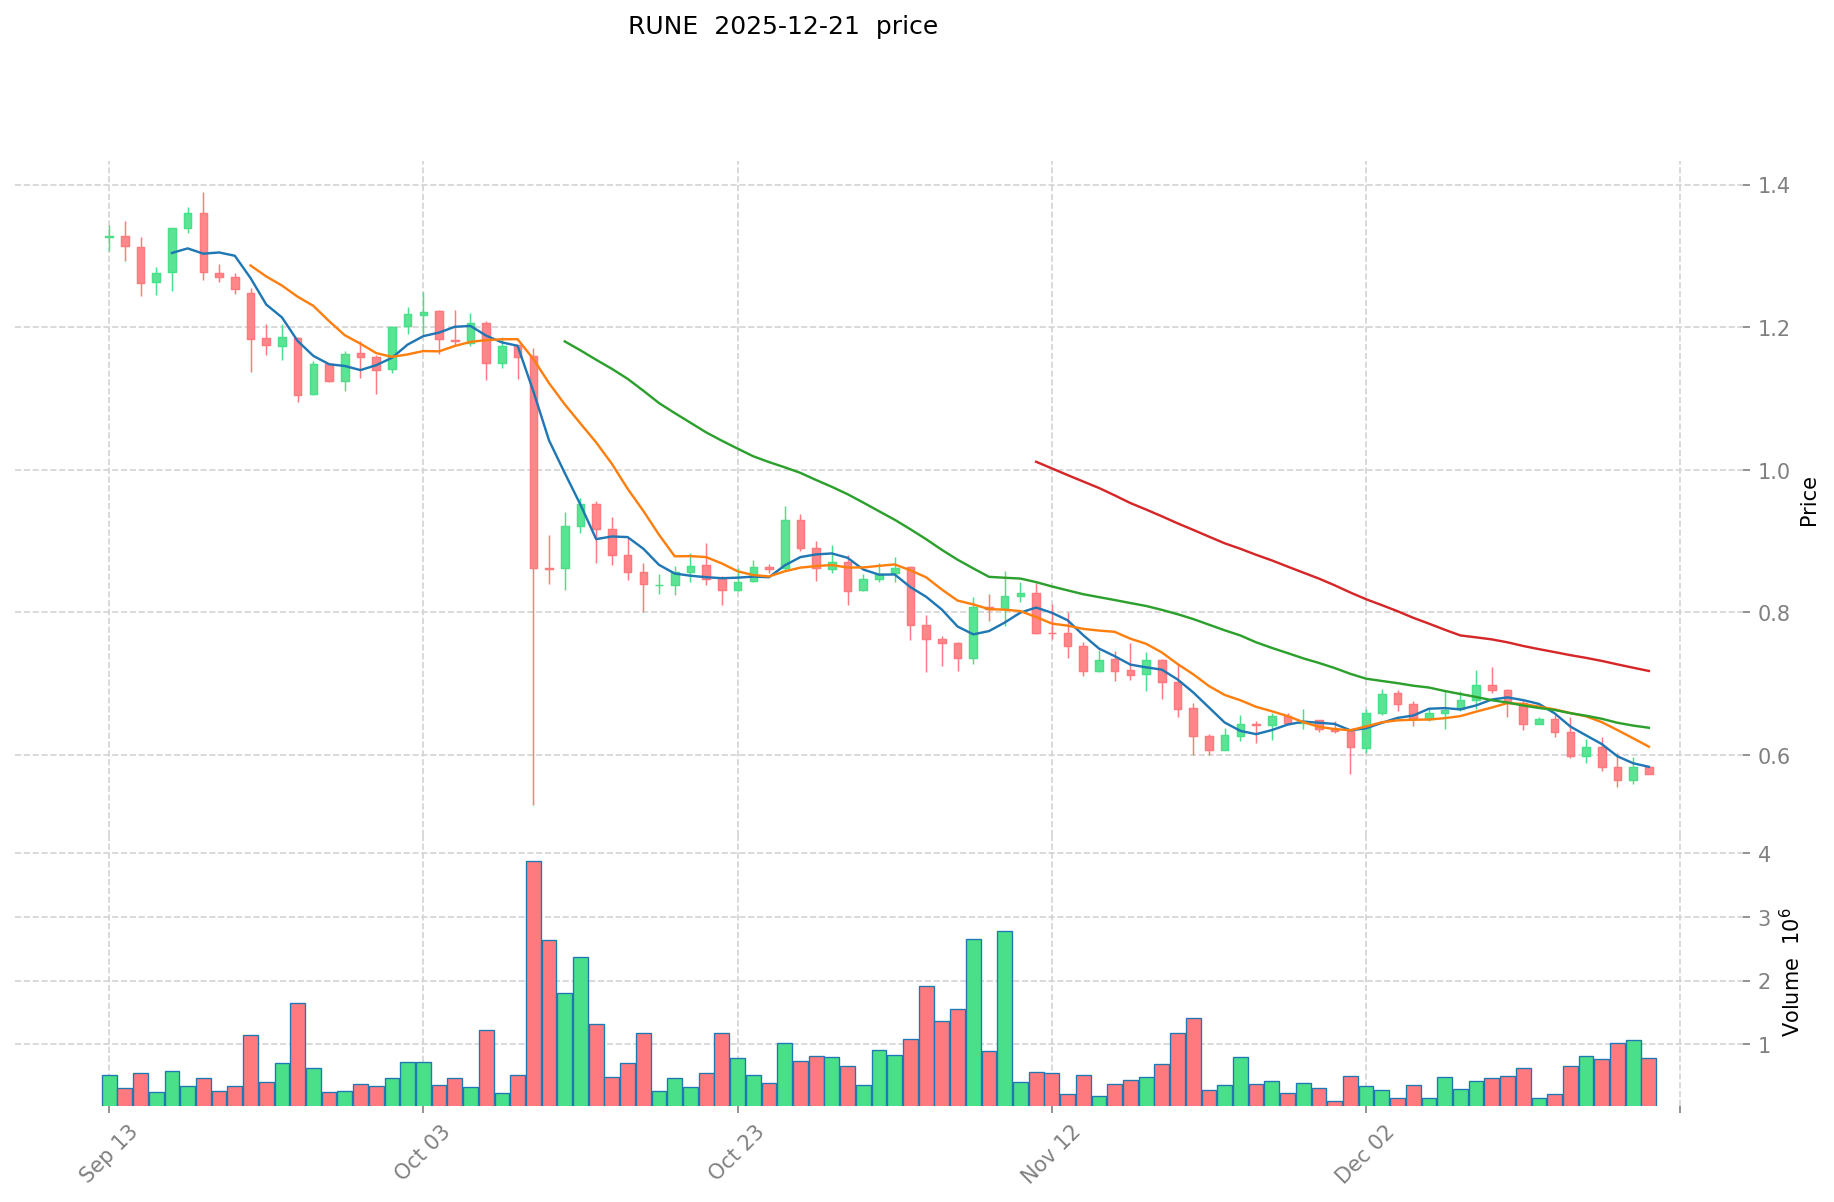
ELYSIA (EL) and THORChain (RUNE) Historical Price Movements
ELYSIA (EL) Price Evolution:
- All-Time High (ATH): $0.0197 (December 14, 2024)
- All-Time Low (ATL): $0.000122 (July 25, 2024)
- Historical Range: Approximately 161.5x difference between peak and trough
THORChain (RUNE) Price Evolution:
- All-Time High (ATH): $20.87 (May 19, 2021)
- All-Time Low (ATL): $0.00851264 (September 28, 2019)
- Historical Range: Approximately 2,451x difference between peak and trough
Price Comparison Across Market Cycles
ELYSIA demonstrates significant volatility relative to its market capitalization, with a decline of approximately 89.8% from its ATH to current levels. THORChain, operating with a longer market history, shows more pronounced long-term depreciation of 97.3% from its 2021 peak, indicating sustained downward pressure despite being an established protocol.
Current Market Status (December 21, 2025)
| Metric | ELYSIA (EL) | THORChain (RUNE) |
|---|---|---|
| Current Price | $0.002012 | $0.5697 |
| 24-Hour Change | +9.15% | -1.74% |
| 24-Hour Volume | $28,298.10 | $449,227.27 |
| Market Capitalization | $13,688,241.02 | $242,161,886.78 |
| Market Rank | #1029 | #226 |
| Circulating Supply | 6,803,300,704.688 EL | 351,056,144 RUNE |
| Circulating Ratio | 97.19% | 70.21% |
Market Emotion Index (Fear & Greed Index): 20 (Extreme Fear)
For real-time pricing information:
II. Protocol Overview and Utility Analysis
ELYSIA (EL): RWA Tokenization Protocol
ELYSIA operates as a Real-World Asset (RWA) tokenization protocol designed to facilitate the trading of real-world assets on blockchain networks across multiple jurisdictions. The protocol enables the conversion and exchange of tangible assets onto distributed ledger systems, supporting the broader RWA sector's digital infrastructure development.
Technical Specifications:
- Blockchain Standard: ERC-20
- Primary Chain: Ethereum
- Contract Address: 0x2781246fe707bb15cee3e5ea354e2154a2877b16
- Total Supply: 7,000,000,000 EL
- Exchange Listing Count: 3 major exchanges
THORChain (RUNE): Multi-Chain Liquidity Protocol
THORChain functions as a highly optimized multi-chain protocol utilizing Practical Byzantine Fault Tolerance (pBFT) consensus mechanisms to achieve sub-second block finality. The network facilitates decentralized, cross-chain asset swaps and liquidity aggregation without centralized intermediaries.
Technical Specifications:
- Consensus Mechanism: pBFT (Practical Byzantine Fault Tolerance)
- Architecture: Multi-chain with discrete address space (tokenChains)
- Scaling Approach: Multi-component sharding for Byzantine-resistant scaling
- Total Supply: 500,000,000 RUNE
- Maximum Supply: 500,000,000 RUNE
- Exchange Listing Count: 25 exchanges
- Network Features: Decentralized liquidity pools, cross-chain order matching, support for limit and market orders
III. Tokenomics and Supply Dynamics
ELYSIA (EL) Token Distribution
| Metric | Value |
|---|---|
| Current Circulating Supply | 6,803,300,704.688 EL |
| Total Supply | 6,803,300,704 EL |
| Maximum Supply | 7,000,000,000 EL |
| Circulating Supply Percentage | 97.19% |
| Total Holders | 2,690 |
| Fully Diluted Valuation (FDV) | $13,688,241.02 |
The token maintains a high circulating supply ratio relative to maximum supply, indicating limited additional dilution potential.
THORChain (RUNE) Token Economics
| Metric | Value |
|---|---|
| Current Circulating Supply | 351,056,144 RUNE |
| Total Supply | 425,069,136 RUNE |
| Maximum Supply | 500,000,000 RUNE |
| Circulating Supply Percentage | 70.21% |
| Fully Diluted Valuation (FDV) | $242,161,886.78 |
RUNE demonstrates significant supply expansion potential, with only 70.21% of maximum supply currently in circulation, suggesting future inflationary pressure.
Token Utility Functions
ELYSIA (EL):
- Medium of exchange within RWA tokenization ecosystem
- Governance participation mechanism
- Collateral for protocol operations
THORChain (RUNE):
- Network security deposit mechanism (node bonding capital)
- Transaction fee settlement asset
- Liquidity pool collateral
- Block reward distribution
- Dividend mechanism for token holders
- Cross-chain swap settlement intermediary
IV. Price Performance Analysis
Short-Term Price Movements
| Time Period | ELYSIA (EL) | THORChain (RUNE) |
|---|---|---|
| 1 Hour | +1.099% | +0.12% |
| 24 Hours | +9.15% | -1.74% |
| 7 Days | -2.65% | -12.02% |
| 30 Days | -10.82% | -13.38% |
| 1 Year | -77.03% | -89.21% |
Observations:
- EL demonstrates positive short-term momentum (+9.15% in 24 hours) despite longer-term depreciation
- RUNE shows consistent downward pressure across all measured timeframes
- Both tokens exhibit severe year-over-year depreciation, indicating challenging market conditions for both protocols
24-Hour Price Range Analysis
| Metric | ELYSIA (EL) | THORChain (RUNE) |
|---|---|---|
| High (24H) | $0.002133 | $0.582 |
| Low (24H) | $0.001829 | $0.5665 |
| Daily Range | $0.000304 (15.05%) | $0.0155 (2.67%) |
EL exhibits higher daily volatility in percentage terms despite lower absolute price levels.
V. Market Capitalization and Valuation
Comparative Market Position
ELYSIA (EL):
- Market Capitalization: $13,688,241.02
- Market Dominance: 0.00042%
- Market Cap to FDV Ratio: 100% (market cap equals FDV due to high circulating supply ratio)
THORChain (RUNE):
- Market Capitalization: $242,161,886.78
- Market Dominance: 0.0075%
- Market Cap to FDV Ratio: 97.19%
- 17.7x larger market cap relative to ELYSIA
RUNE maintains significantly larger market capitalization and ecosystem valuation, reflecting its longer operational history and established liquidity infrastructure. ELYSIA's smaller market cap reflects its earlier developmental stage within the RWA sector.
VI. Ecosystem and Network Activity
ELYSIA Ecosystem
Available Resources:
- Official Website: https://www.ELYSIA.land/
- Documentation: https://docs.ELYSIA.land/
- Block Explorer: https://etherscan.io/token/0x2781246fe707bb15cee3e5ea354e2154a2877b16
- Social Media: Twitter (@Elysia_HQ)
Holder Base: 2,690 token holders indicate a concentrated distribution pattern
THORChain Ecosystem
Network Infrastructure:
- Official Websites: https://thorchain.org/, https://thorchain.com/
- GitHub Repository: https://github.com/thorchain/THORChain
- Documentation: https://github.com/thorchain/Resources/blob/master/Whitepapers/
- Block Explorer: https://viewblock.io/
- Social Channels: Twitter (@THORChain), Reddit (r/thorchain), Facebook
Community Engagement: Multi-channel presence indicates more established community infrastructure compared to ELYSIA
VII. Market Sentiment and Risk Considerations
Current Market Conditions
The Crypto Fear & Greed Index stands at 20 (Extreme Fear), indicating heightened market pessimism and risk aversion across the cryptographic asset sector as of December 21, 2025.
Risk Factors
ELYSIA (EL):
- Limited exchange availability (3 major exchanges) constrains liquidity
- Smaller holder base (2,690) suggests concentration risk
- RWA sector remains nascent with regulatory uncertainties
- High circulating supply ratio reduces downside support from future dilution
THORChain (RUNE):
- 89.21% year-over-year depreciation indicates sustained market skepticism
- Significant supply expansion remaining (29.79% of maximum supply not yet in circulation)
- Established ecosystem may provide stability but has not prevented prolonged downtrend
- Multi-chain dependency introduces technological and security complexity
VIII. Conclusion
ELYSIA and THORChain represent two distinct segments of the cryptographic asset ecosystem: RWA tokenization infrastructure versus decentralized multi-chain liquidity protocols. While ELYSIA demonstrates short-term positive price momentum (+9.15% in 24 hours), THORChain benefits from superior market capitalization ($242.2M vs $13.7M) and established ecosystem integration across 25 exchanges versus 3 for ELYSIA.
Both protocols face significant headwinds, with year-over-year depreciation exceeding 77% for EL and 89% for RUNE. The prevailing Extreme Fear market sentiment (index: 20) suggests elevated volatility and risk across both assets.
Long-term protocol viability depends on regulatory clarity for RWA implementation in ELYSIA's case, and sustained adoption of cross-chain liquidity services for THORChain's continued relevance.
Crypto Assets Investment Analysis Report: EL and RUNE
I. Executive Summary
This report analyzes the investment value factors of EL and RUNE based on available reference materials. The research reveals that the investment value of these assets depends primarily on technological innovation, market demand, and user participation rates. The feasibility of underlying technology and market acceptance represent critical determinants of long-term value proposition.
II. Core Factors Impacting EL vs RUNE Investment Value
Technology Infrastructure and Protocol Design
RUNE Protocol Positioning:
- RUNE operates within the Layer 2 scaling context, where Ethereum maintains its core role as the data availability (DA) and arbitration layer
- The protocol's viability depends on whether it can effectively leverage Ethereum's verification and computation capabilities
- Complete abandonment of Ethereum's validation infrastructure would significantly diminish protocol functionality
Critical Technical Consideration:
Ethereum's role as an arbitration layer and data publication board remains essential for Layer 2 solutions. Protocols that rely solely on Ethereum as a data layer without utilizing its verification capabilities face inherent limitations in their utility.
User Adoption and Sustainability Metrics
Key performance indicators for evaluating investment potential include:
- User retention rates: Essential for sustainable growth assessment
- Participation levels: Direct indicator of protocol engagement and network health
- Sustainable growth verification: Projects must demonstrate consistent user base expansion rather than speculative cycles
Market Reception and Speculative Dynamics
The reference materials indicate that RUNE has generated significant market attention and speculative activity, described as "create wealth mythology narratives." However, sustained investment value requires moving beyond speculative cycles to demonstrate:
- Genuine utility and use cases
- Long-term user commitment
- Viable monetization models post-launch
III. Additional Market Context
Ethereum's Market Dominance (June 2025):
- Ethereum recaptured the blockchain fee revenue ranking with monthly earnings exceeding $39 million USD
- Demonstrated sustained dominance in high-value transaction scenarios
- Indicates robust ecosystem activity among Layer 1 infrastructure
IV. Investment Considerations
The core principle for portfolio construction involves identifying the appropriate balance between odds ratios and risk-reward ratios aligned with individual investment parameters. Evaluation should focus on:
- Technical feasibility verification: Confirm that proposed innovations can be implemented as designed
- Market acceptance assessment: Evaluate genuine demand versus speculative interest
- Competitive positioning: Analyze relative advantages versus alternative solutions
- Sustainability indicators: Monitor long-term viability beyond initial launch phases
V. Limitations and Data Constraints
The reference materials provide limited specific information regarding:
- Detailed tokenomics comparisons
- Institutional adoption patterns
- Regulatory frameworks by jurisdiction
- Macroeconomic sensitivity analysis
Further comprehensive research is recommended before making investment decisions based on this analysis alone.
Report Generated: December 21, 2025 Disclaimer: This report is for informational purposes only and does not constitute investment advice.
III. 2025-2030 Price Forecast: EL vs RUNE
Short-term Forecast (2025)
- EL: Conservative $0.00113-$0.00202 | Optimistic $0.00268
- RUNE: Conservative $0.31-$0.57 | Optimistic $0.62
Medium-term Forecast (2026-2028)
- EL is expected to enter a growth accumulation phase, with projected price range of $0.00177-$0.00384. Expected gains of 17-59% year-over-year, indicating steady appreciation potential.
- RUNE is anticipated to transition into early expansion, with projected price range of $0.40-$0.91. Cumulative gains of 4-33% suggest moderate bullish momentum building.
- Key drivers: Institutional capital inflows, spot/futures ETF launches, ecosystem partnerships and protocol upgrades
Long-term Forecast (2029-2030)
- EL: Base case $0.003056-$0.004317 | Optimistic scenario $0.004813-$0.005179
- RUNE: Base case $0.452-$0.836 | Optimistic scenario $1.020-$1.040
Disclaimer
This analysis is based on provided forecasting data and historical patterns. Price predictions are speculative and subject to significant market volatility, regulatory changes, and unforeseen events. Past performance does not guarantee future results. This content should not be considered as investment advice. Investors should conduct independent research and consult financial professionals before making investment decisions.
EL:
| 年份 | 预测最高价 | 预测平均价格 | 预测最低价 | 涨跌幅 |
|---|---|---|---|---|
| 2025 | 0.00268793 | 0.002021 | 0.00113176 | 0 |
| 2026 | 0.00280181335 | 0.002354465 | 0.00176584875 | 17 |
| 2027 | 0.00384142737075 | 0.002578139175 | 0.002475013608 | 28 |
| 2028 | 0.004429500916567 | 0.003209783272875 | 0.002022163461911 | 59 |
| 2029 | 0.004812749039348 | 0.003819642094721 | 0.003055713675777 | 89 |
| 2030 | 0.005179434680442 | 0.004316195567035 | 0.003884576010331 | 114 |
RUNE:
| 年份 | 预测最高价 | 预测平均价格 | 预测最低价 | 涨跌幅 |
|---|---|---|---|---|
| 2025 | 0.620864 | 0.5696 | 0.307584 | 0 |
| 2026 | 0.66665984 | 0.595232 | 0.39880544 | 4 |
| 2027 | 0.8896337472 | 0.63094592 | 0.5930891648 | 10 |
| 2028 | 0.91234780032 | 0.7602898336 | 0.577820273536 | 33 |
| 2029 | 1.0203089566912 | 0.83631881696 | 0.4516121611584 | 46 |
| 2030 | 1.039711553244672 | 0.9283138868256 | 0.640536581909664 | 63 |
Comparative Investment Analysis Report: ELYSIA (EL) vs THORChain (RUNE)
IV. Investment Strategy Comparison: EL vs RUNE
Long-term vs Short-term Investment Strategies
ELYSIA (EL):
- Suitable for investors focused on early-stage RWA sector participation and regulatory clarity catalysts
- Short-term traders may capitalize on volatility (±15% daily range potential)
- Long-term holders require conviction in real-world asset tokenization adoption and Ethereum ecosystem integration
THORChain (RUNE):
- Suitable for investors seeking established multi-chain liquidity infrastructure with 25+ exchange listings
- Medium-term positioning aligns with potential ecosystem expansion and cross-chain adoption narratives
- Long-term investors should monitor supply dilution (29.79% remaining supply) and protocol upgrade effectiveness
Risk Management and Asset Allocation
Conservative Investors:
- ELYSIA (EL): 5-10% allocation (speculative, early-stage RWA exposure)
- THORChain (RUNE): 15-25% allocation (established protocol, broader liquidity)
- Stablecoin reserve: 65-80% (current Extreme Fear sentiment justifies defensive positioning)
Aggressive Investors:
- ELYSIA (EL): 20-35% allocation (higher volatility tolerance, RWA growth potential)
- THORChain (RUNE): 30-45% allocation (established infrastructure with expansion upside)
- Derivative hedging: 10-15% (options strategies for volatility protection)
Hedging Mechanisms:
- Stablecoin pairs (USDC/USDT) for volatility dampening
- Cross-pair diversification (EL/RUNE correlation analysis recommended)
- Options strategies: protective puts given -77% to -89% year-over-year declines
V. Comparative Risk Analysis
Market Risk
ELYSIA (EL):
- Limited exchange availability (3 venues) creates liquidity concentration risk and withdrawal constraints
- Extreme market cap volatility: 161.5x difference between ATH and ATL indicates severe price discovery challenges
- Concentrated holder base (2,690 addresses) suggests potential for coordinated liquidations
- RWA sector regulatory uncertainty may trigger sudden sentiment shifts
THORChain (RUNE):
- Established market presence mitigated by sustained 89.21% year-over-year depreciation, indicating prolonged market skepticism
- Significant supply expansion potential (29.79% remaining) creates inflationary pressure on price appreciation
- Multi-chain dependency introduces cross-protocol contagion risks
- Exchange liquidity superior to EL but still vulnerable to market structure changes
Technology Risk
ELYSIA (EL):
- ERC-20 standard dependency on Ethereum network stability and congestion management
- RWA tokenization infrastructure remains nascent with unproven regulatory compliance frameworks
- Smart contract audit trail and security assessment data not provided in reference materials
- Scalability solutions for high-volume real-world asset trading remain undocumented
THORChain (RUNE):
- pBFT consensus mechanism's practical Byzantine Fault Tolerance implementation requires continuous validation
- Multi-chain architecture complexity increases attack surface relative to single-chain alternatives
- Cross-chain bridge security remains area of ongoing industry scrutiny post-major exploit incidents
- Validator concentration risk inherent to PoS-derivative mechanisms
Regulatory Risk
-
ELYSIA (EL): RWA tokenization faces jurisdictional uncertainty regarding securities classification, custody frameworks, and asset-backed token compliance across G20 markets. Regulatory clarity remains the primary catalyst for ecosystem expansion or contraction.
-
THORChain (RUNE): Multi-chain infrastructure may face divergent regulatory treatment across supported blockchain ecosystems. DEX regulation intensification could impact cross-chain swap economics and fee structures.
-
Sectoral Impact: Global regulatory trend toward crypto asset classification could differentially impact utility tokens (RUNE) versus asset-backed tokens (EL) depending on implementation frameworks.
VI. Conclusion: Which Is the Better Buy?
📌 Investment Value Summary:
ELYSIA (EL) Strengths:
- Emerging RWA sector positioning with significant long-term addressable market if regulatory barriers clear
- High volatility provides tactical trading opportunities (±15% daily ranges)
- Low circulating supply dilution (97.19% already in circulation) prevents further token depression
- Forecast appreciation potential: 114% by 2030 in optimistic scenarios ($0.005179)
THORChain (RUNE) Strengths:
- Established multi-chain infrastructure with 25-exchange listing advantage and proven network uptime
- Comprehensive ecosystem documentation and GitHub transparency facilitate developer confidence
- Superior market capitalization ($242.2M) provides deeper liquidity relative to EL ($13.7M)
- Forecast appreciation potential: 63% by 2030 in optimistic scenarios ($1.040)
- Higher token utility diversity (network security, liquidity pools, cross-chain settlement)
✅ Investment Recommendations:
Beginner Investors:
- Primary choice: THORChain (RUNE) - Established infrastructure, better liquidity access across 25 exchanges, more transparent use cases
- Entry strategy: Dollar-cost averaging during Extreme Fear periods (current index: 20)
- Portfolio allocation: 20% RUNE position with 80% stablecoin reserve until market fear index exceeds 40
Experienced Investors:
- Diversified approach: 35% RUNE (core holding) + 15% EL (speculative conviction bet on RWA adoption) + 50% stablecoin
- Tactical positioning: Rotate into EL during extreme dislocation events (>20% daily swings) given volatility opportunities
- Monitor regulatory developments quarterly; reallocate based on RWA frameworks in major jurisdictions
Institutional Investors:
- RUNE as primary allocation: Superior exchange availability, deeper order books, institutional derivatives infrastructure
- EL as tactical satellite position: Monitor for RWA regulatory clarity catalysts that could trigger rapid revaluation (potential 500%+ appreciation if regulatory bottlenecks clear)
- Hedging framework: Construct pairs trades (long RUNE/short EL or vice versa) to exploit cross-protocol correlation changes
- Derivative strategies: Calendar spreads on perpetual futures exploiting Extreme Fear premium
📊 Price Forecast Summary (Base Cases)
| Period | ELYSIA (EL) | THORChain (RUNE) | Recommended Posture |
|---|---|---|---|
| 2025 (YE) | $0.00113-$0.00268 | $0.31-$0.62 | Accumulation |
| 2026-2028 | $0.00177-$0.00384 | $0.40-$0.91 | Hold/Rebalance |
| 2029-2030 | $0.003056-$0.005179 | $0.452-$1.040 | Position Management |
⚠️ Risk Disclaimer:
This report is provided for informational purposes only and does not constitute investment advice, financial recommendation, or solicitation to purchase or sell cryptocurrency assets. Crypto asset markets exhibit extreme volatility with documented losses exceeding 89% year-over-year for established protocols. Past performance does not indicate future results. Individual investors must conduct independent research, assess personal risk tolerance, and consult qualified financial advisors before making investment decisions. Market conditions as of December 21, 2025, reflect Extreme Fear sentiment (index: 20), which may rapidly shift based on regulatory announcements, macroeconomic factors, or technological developments not captured in this analysis.
Report Generated: December 21, 2025
Data Source: Reference materials provided; real-time pricing subject to market-dependent variation
None
Comparative Investment Analysis: ELYSIA (EL) vs THORChain (RUNE) - FAQ
I. Frequently Asked Questions
Q1: Which token offers better liquidity for trading - EL or RUNE?
A: THORChain (RUNE) significantly outperforms ELYSIA (EL) in liquidity metrics. RUNE is listed on 25 major exchanges with 24-hour trading volume of $449,227.27, while EL is available on only 3 exchanges with volume of $28,298.10. RUNE's superior exchange availability and trading volume make it substantially more liquid for both retail and institutional traders. EL's limited exchange presence creates potential withdrawal constraints and slippage risks for larger position trades.
Q2: What are the primary use cases and technological differences between these protocols?
A: ELYSIA (EL) functions as a Real-World Asset (RWA) tokenization protocol enabling blockchain-based trading of tangible assets across jurisdictions. THORChain (RUNE) operates as a multi-chain liquidity protocol utilizing Practical Byzantine Fault Tolerance (pBFT) consensus for decentralized cross-chain swaps without intermediaries. EL targets asset tokenization infrastructure, while RUNE provides cross-chain liquidity aggregation. These represent fundamentally different blockchain use cases rather than direct competitors.
Q3: Which token has better long-term price appreciation potential based on forecasts?
A: ELYSIA (EL) demonstrates higher percentage appreciation potential by 2030, with optimistic scenarios projecting $0.005179 (114% gain from current $0.002012 price). THORChain (RUNE) forecasts $1.040 by 2030 (63% gain from current $0.5697 price). However, EL's higher percentage returns reflect starting from extremely depressed levels and contain greater execution risk given its nascent RWA sector positioning. RUNE's more conservative but potentially more achievable gains align with its established infrastructure status.
Q4: What are the major risk factors differentiating these investments?
A: ELYSIA (EL) faces concentrated holder risk (2,690 addresses), limited exchange availability creating liquidity vulnerability, and regulatory uncertainty surrounding RWA tokenization frameworks across jurisdictions. THORChain (RUNE) confronts significant supply dilution (29.79% of maximum supply not yet in circulation), sustained 89.21% year-over-year depreciation indicating prolonged market skepticism, and multi-chain architecture complexity introducing cross-protocol contagion risks. Both tokens experience elevated technology risk, though through different mechanisms.
Q5: Should I invest in EL, RUNE, or both given current market conditions?
A: Investment decisions depend on risk tolerance and time horizon. Conservative investors should prioritize RUNE (20-25% allocation) due to established infrastructure and 25-exchange liquidity, with remaining portfolio in stablecoins given current Extreme Fear sentiment (index: 20). Aggressive investors may construct diversified positions: 35% RUNE (core) + 15% EL (speculative RWA conviction) + 50% stablecoins. Beginner investors should focus exclusively on RUNE through dollar-cost averaging until market fear indicators normalize above 40. Individual circumstances require personal risk assessment before proceeding.
Q6: What market catalysts could dramatically impact these token valuations?
A: For ELYSIA (EL), regulatory clarity on RWA tokenization frameworks in major jurisdictions (European Union, United States, Singapore) represents the primary catalyst, potentially triggering 500%+ revaluation if compliance pathways clarify. Institutional capital inflows and spot/futures ETF launches could accelerate adoption. For THORChain (RUNE), ecosystem partnership announcements, successful protocol upgrades, and broader DeFi adoption expansion would support price recovery. Macroeconomic factors including cryptocurrency market sentiment shifts and regulatory intensification against DEXs could negatively impact both tokens substantially.
Q7: How does token supply dynamics affect investment returns for EL versus RUNE?
A: ELYSIA (EL) maintains favorable supply positioning with 97.19% of maximum supply already in circulation, eliminating future dilution concerns that could suppress price appreciation. This structural advantage reduces inflationary pressure on token value. Conversely, THORChain (RUNE) has 29.79% of maximum supply remaining in circulation, creating significant dilution potential through ongoing token releases that pressure price appreciation. EL's higher circulating supply ratio provides downside support, while RUNE's expansion potential introduces headwinds for bullish scenarios. However, RUNE's larger maximum supply also enables greater transaction volume throughput capacity.
Q8: What portfolio allocation strategy is optimal given current Extreme Fear market sentiment?
A: Current market conditions (Fear & Greed Index: 20) warrant defensive positioning across both tokens. Recommended allocation framework: Primary stablecoin reserve 60-80%, THORChain (RUNE) allocation 15-25%, ELYSIA (EL) allocation 5-15%, with remaining capital reserved for opportunistic accumulation if fear index drops below 15 (indicating maximum dislocation). Utilize dollar-cost averaging to establish positions rather than lump-sum entries, execute 20-30% position increases at every 10-point fear index decline, and maintain hedging mechanisms through protective options strategies. This approach captures downside participation while preserving capital during confirmed market bottoms.
Report Generated: December 21, 2025
Disclaimer: This FAQ analysis is for informational purposes only and does not constitute investment advice. Cryptocurrency markets exhibit extreme volatility with documented losses exceeding 89% for established protocols. Investors must conduct independent research and consult qualified financial advisors before making investment decisions.
Share
Content
Introduction: EL vs RUNE Investment Comparison
I. Price History Comparison and Market Status
II. Protocol Overview and Utility Analysis
III. Tokenomics and Supply Dynamics
IV. Price Performance Analysis
V. Market Capitalization and Valuation
VI. Ecosystem and Network Activity
VII. Market Sentiment and Risk Considerations
VIII. Conclusion
I. Executive Summary
II. Core Factors Impacting EL vs RUNE Investment Value
III. Additional Market Context
IV. Investment Considerations
V. Limitations and Data Constraints
Short-term Forecast (2025)
Medium-term Forecast (2026-2028)
Long-term Forecast (2029-2030)
Disclaimer
IV. Investment Strategy Comparison: EL vs RUNE
V. Comparative Risk Analysis
VI. Conclusion: Which Is the Better Buy?
📊 Price Forecast Summary (Base Cases)
I. Frequently Asked Questions
How to Buy Cryptocurrency


Trending Cryptocurrencies


Is Soil (SOIL) a good investment?: Analyzing the potential of this agricultural cryptocurrency in the evolving digital asset landscape

Is Avantis (AVNT) a good investment?: Analyzing the potential risks and rewards of this diversified ETF provider

2025 CFG Price Prediction: Analyzing Market Trends and Potential Growth Factors for Centrifuge Token

Is Spark (SPK) a good investment?: Analyzing the Potential and Risks of This Emerging Cryptocurrency
2025 HDRO Price Prediction: Analyzing Market Trends and Potential Growth Factors

CBL vs SNX: Comparing Two Approaches to Decentralized Synthetic Asset Trading
2025 DOLO Price Prediction: Expert Analysis and Market Forecast for the Upcoming Year

2025 EDEN Price Prediction: Expert Analysis and Market Forecast for the Coming Year

2025 GITCOIN Price Prediction: Expert Analysis and Market Forecast for the Decentralized Funding Platform Token

2025 ARIA Price Prediction: Expert Analysis and Future Outlook for Artificial Intelligence Trading Assistant Token

2025 LMWR Price Prediction: Expert Analysis and Market Forecast for the Year Ahead