Trade
Trading Type
Spot
Trade crypto freely
Alpha
Points
Get promising tokens in streamlined on-chain trading
Pre-Market
Trade new tokens before they are officially listed
Margin
Magnify your profit with leverage
Convert & Block Trading
0 Fees
Trade any size with no fees and no slippage
Leveraged Tokens
Get exposure to leveraged positions simply
Futures
Futures
Hundreds of contracts settled in USDT or BTC
Options
HOT
Trade European-style vanilla options
Unified Account
Maximize your capital efficiency
Demo Trading
Futures Kickoff
Get prepared for your futures trading
Futures Events
Participate in events to win generous rewards
Demo Trading
Use virtual funds to experience risk-free trading
Earn
Launch
CandyDrop
Collect candies to earn airdrops
Launchpool
Quick staking, earn potential new tokens
HODLer Airdrop
Hold GT and get massive airdrops for free
Launchpad
Be early to the next big token project
Alpha Points
NEW
Trade on-chain assets and enjoy airdrop rewards!
Futures Points
NEW
Earn futures points and claim airdrop rewards
Investment
Simple Earn
Earn interests with idle tokens
Auto-Invest
Auto-invest on a regular basis
Dual Investment
Buy low and sell high to take profits from price fluctuations
Soft Staking
Earn rewards with flexible staking
Crypto Loan
0 Fees
Pledge one crypto to borrow another
Lending Center
One-stop lending hub
VIP Wealth Hub
Customized wealth management empowers your assets growth
Private Wealth Management
Customized asset management to grow your digital assets
Quant Fund
Top asset management team helps you profit without hassle
Staking
Stake cryptos to earn in PoS products
BTC Staking
HOT
Stake BTC and earn 10% APR
GUSD Minting
Use USDT/USDC to mint GUSD for treasury-level yields
More
大牛加密论
No content yet
大牛加密论
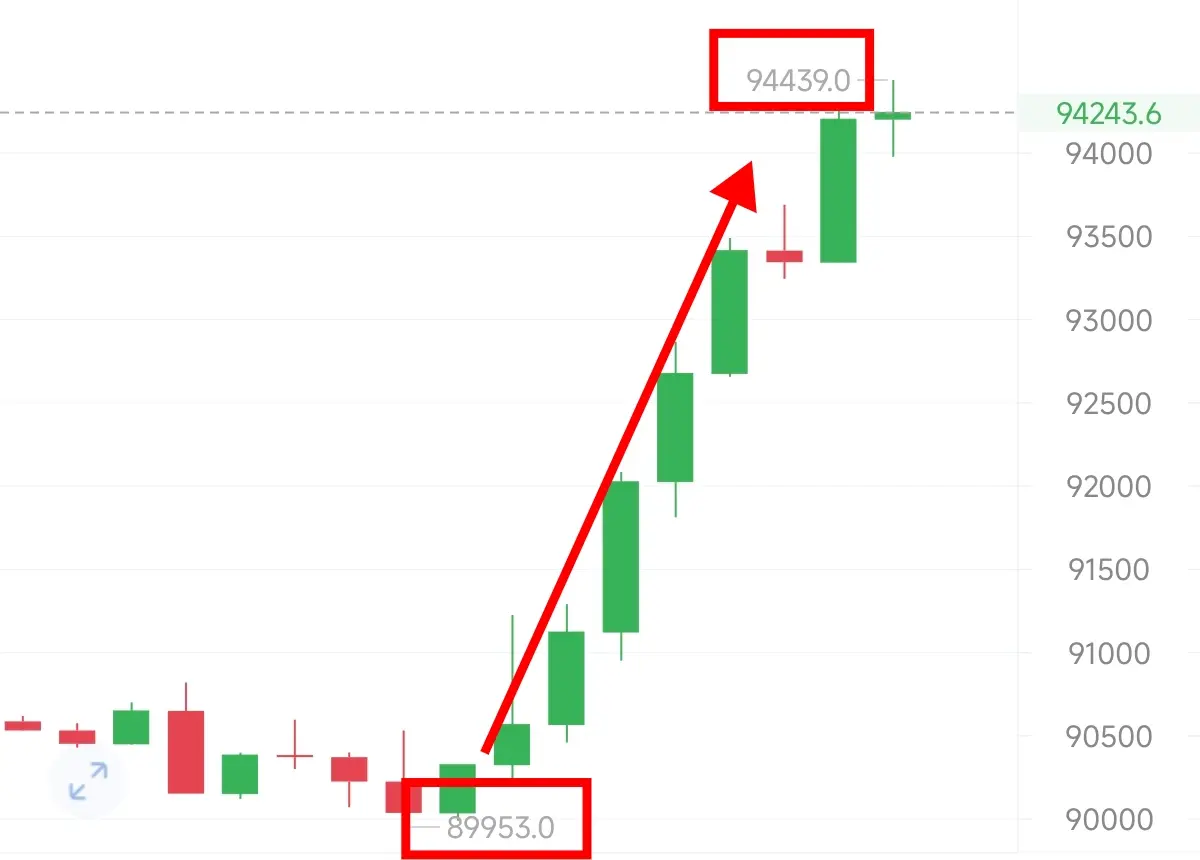
What is the gap? This is the gap.
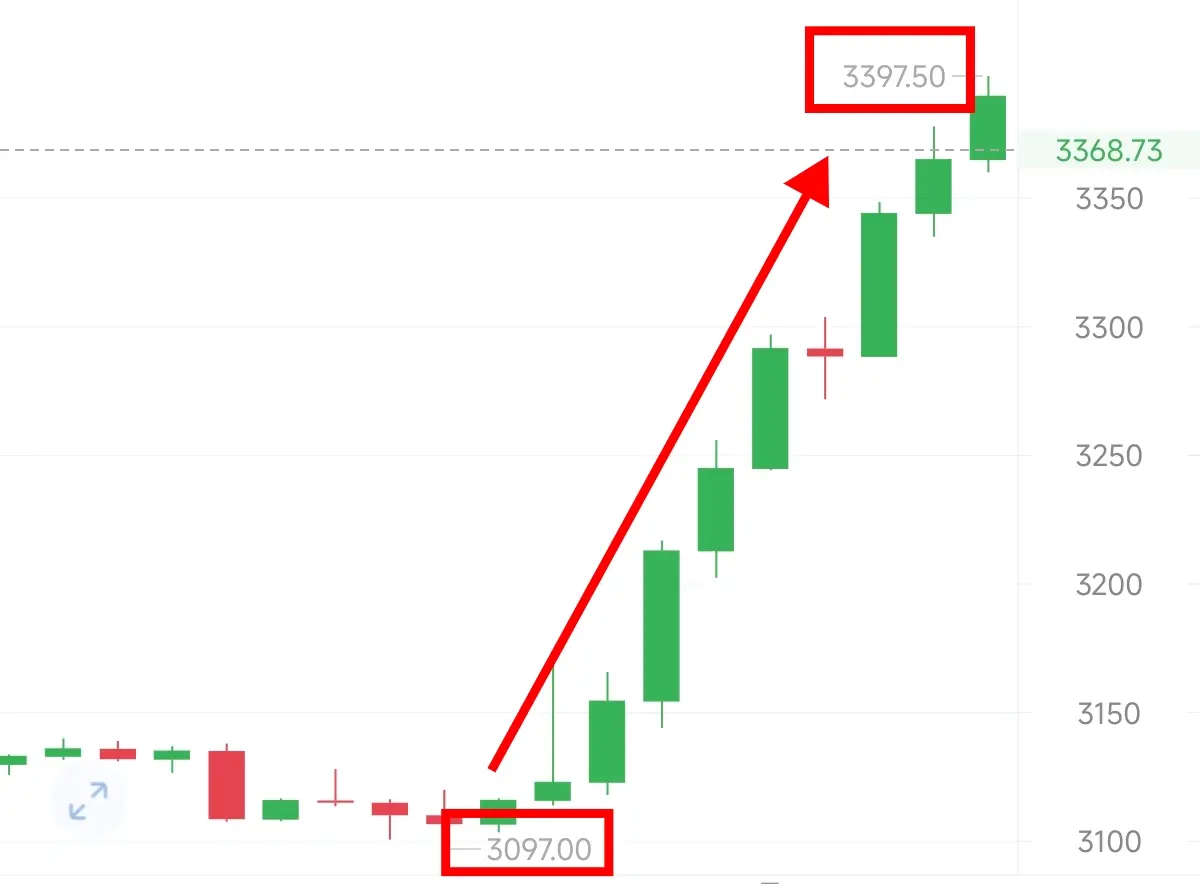
The Ethereum trade given in the morning moved a full 300 points.
If you don’t even have confidence in the strategies you share, how can you help friends in live trading achieve substantial results?
#晒出我的Alpha积分 $BTC $ETH
View OriginalThe Ethereum trade given in the morning moved a full 300 points.
If you don’t even have confidence in the strategies you share, how can you help friends in live trading achieve substantial results?
#晒出我的Alpha积分 $BTC $ETH
- Reward
- like
- Comment
- Repost
- Share
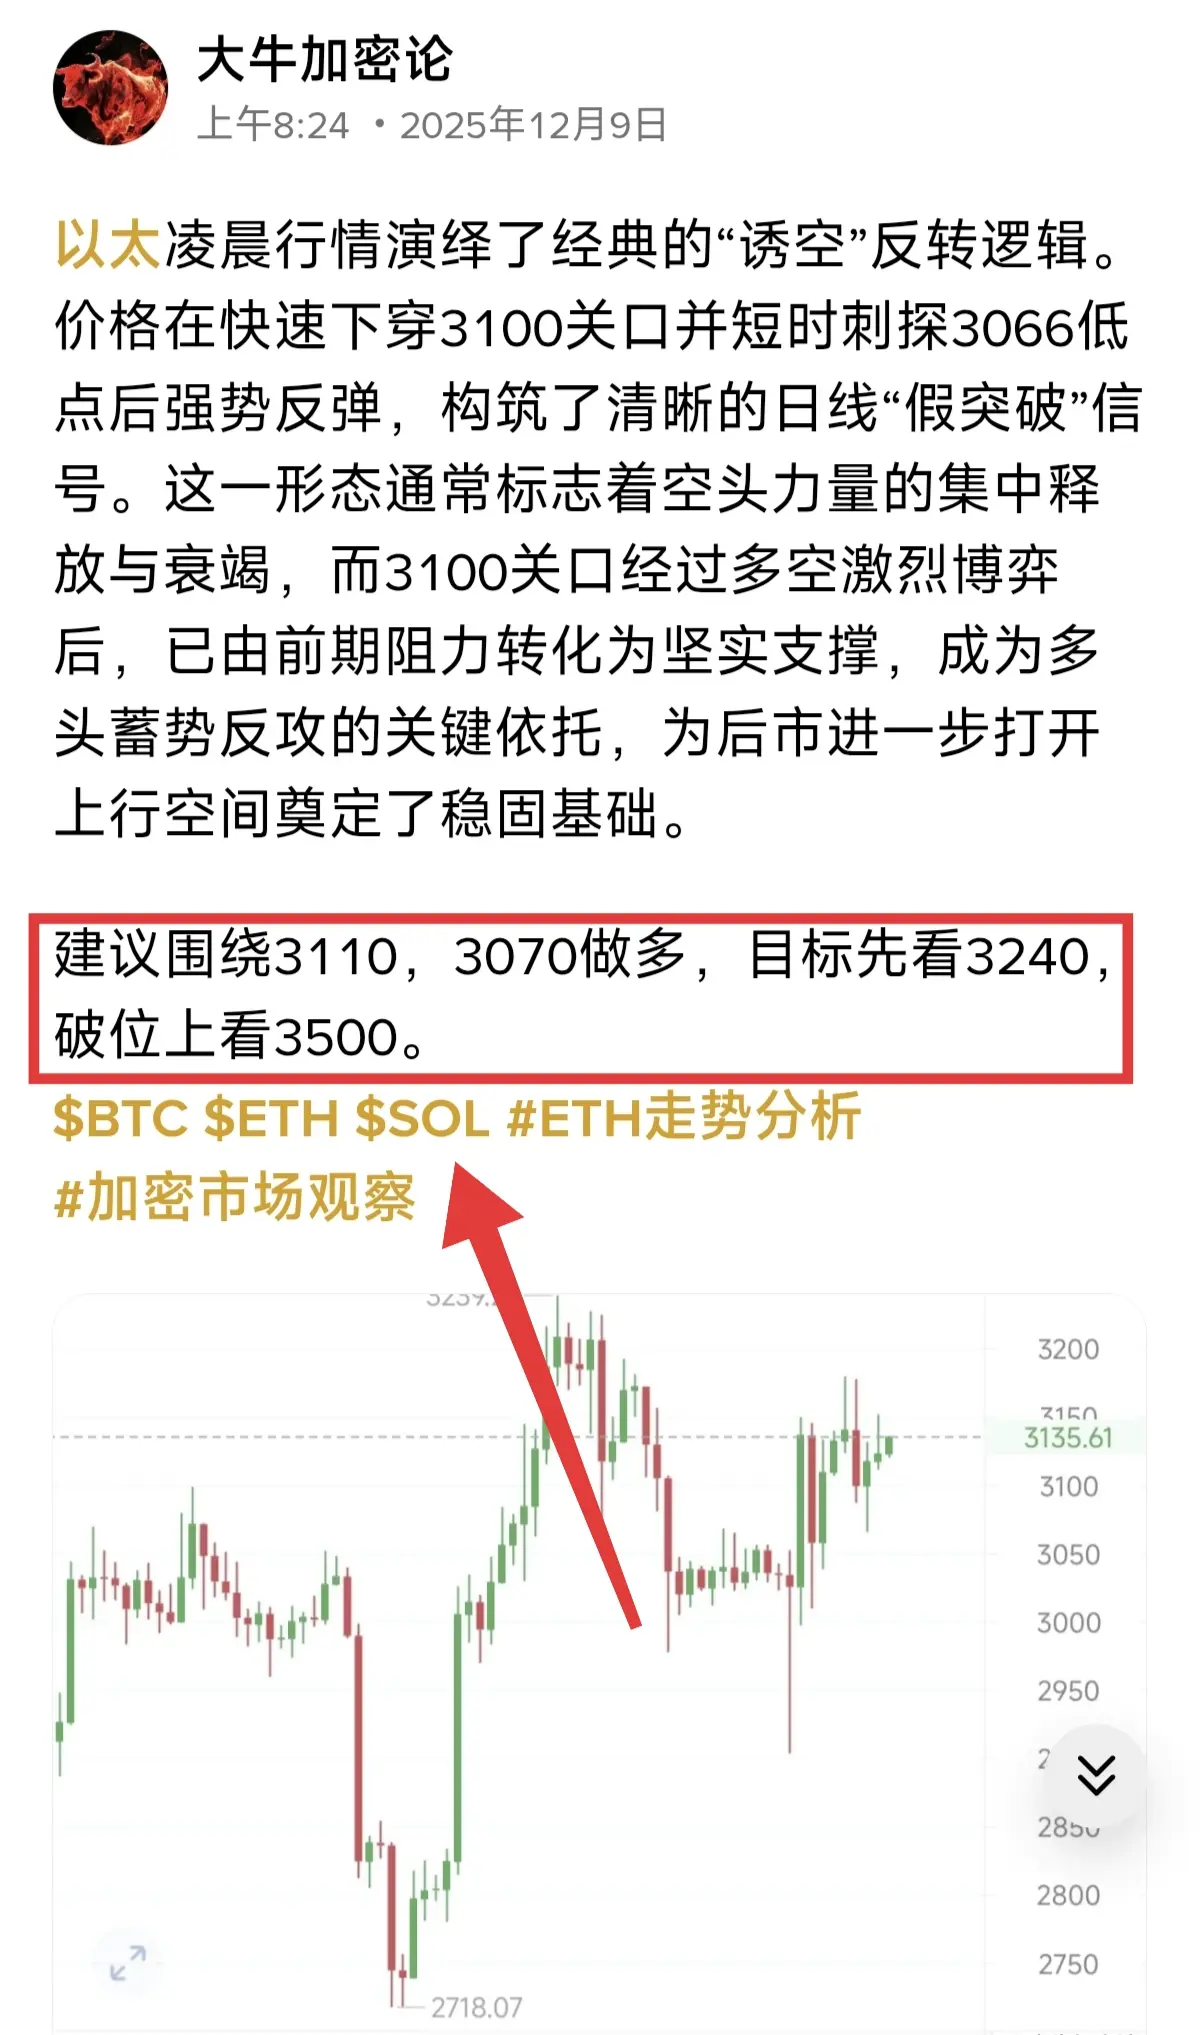
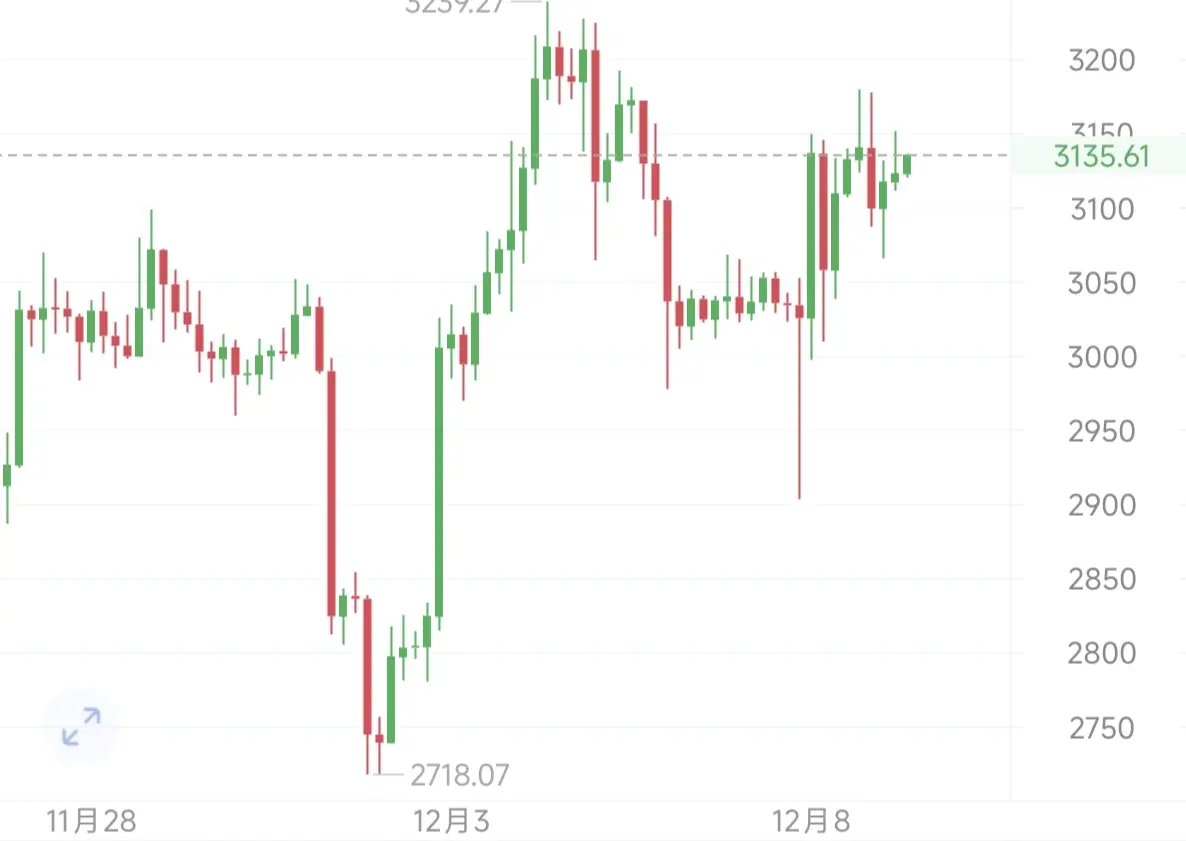
Ethereum’s early morning market movement showcased a classic “bear trap” reversal pattern. After a rapid drop below the 3100 level and briefly testing the 3066 low, the price rebounded strongly, forming a clear daily “false breakout” signal. This pattern typically indicates a concentrated release and exhaustion of bearish momentum. Following intense battles between bulls and bears, the 3100 level has shifted from previous resistance to solid support, serving as a key base for the bulls to regroup and stage a counterattack, thus laying a solid foundation for further upside potential in the mark
ETH8.47%
- Reward
- 3
- Comment
- Repost
- Share
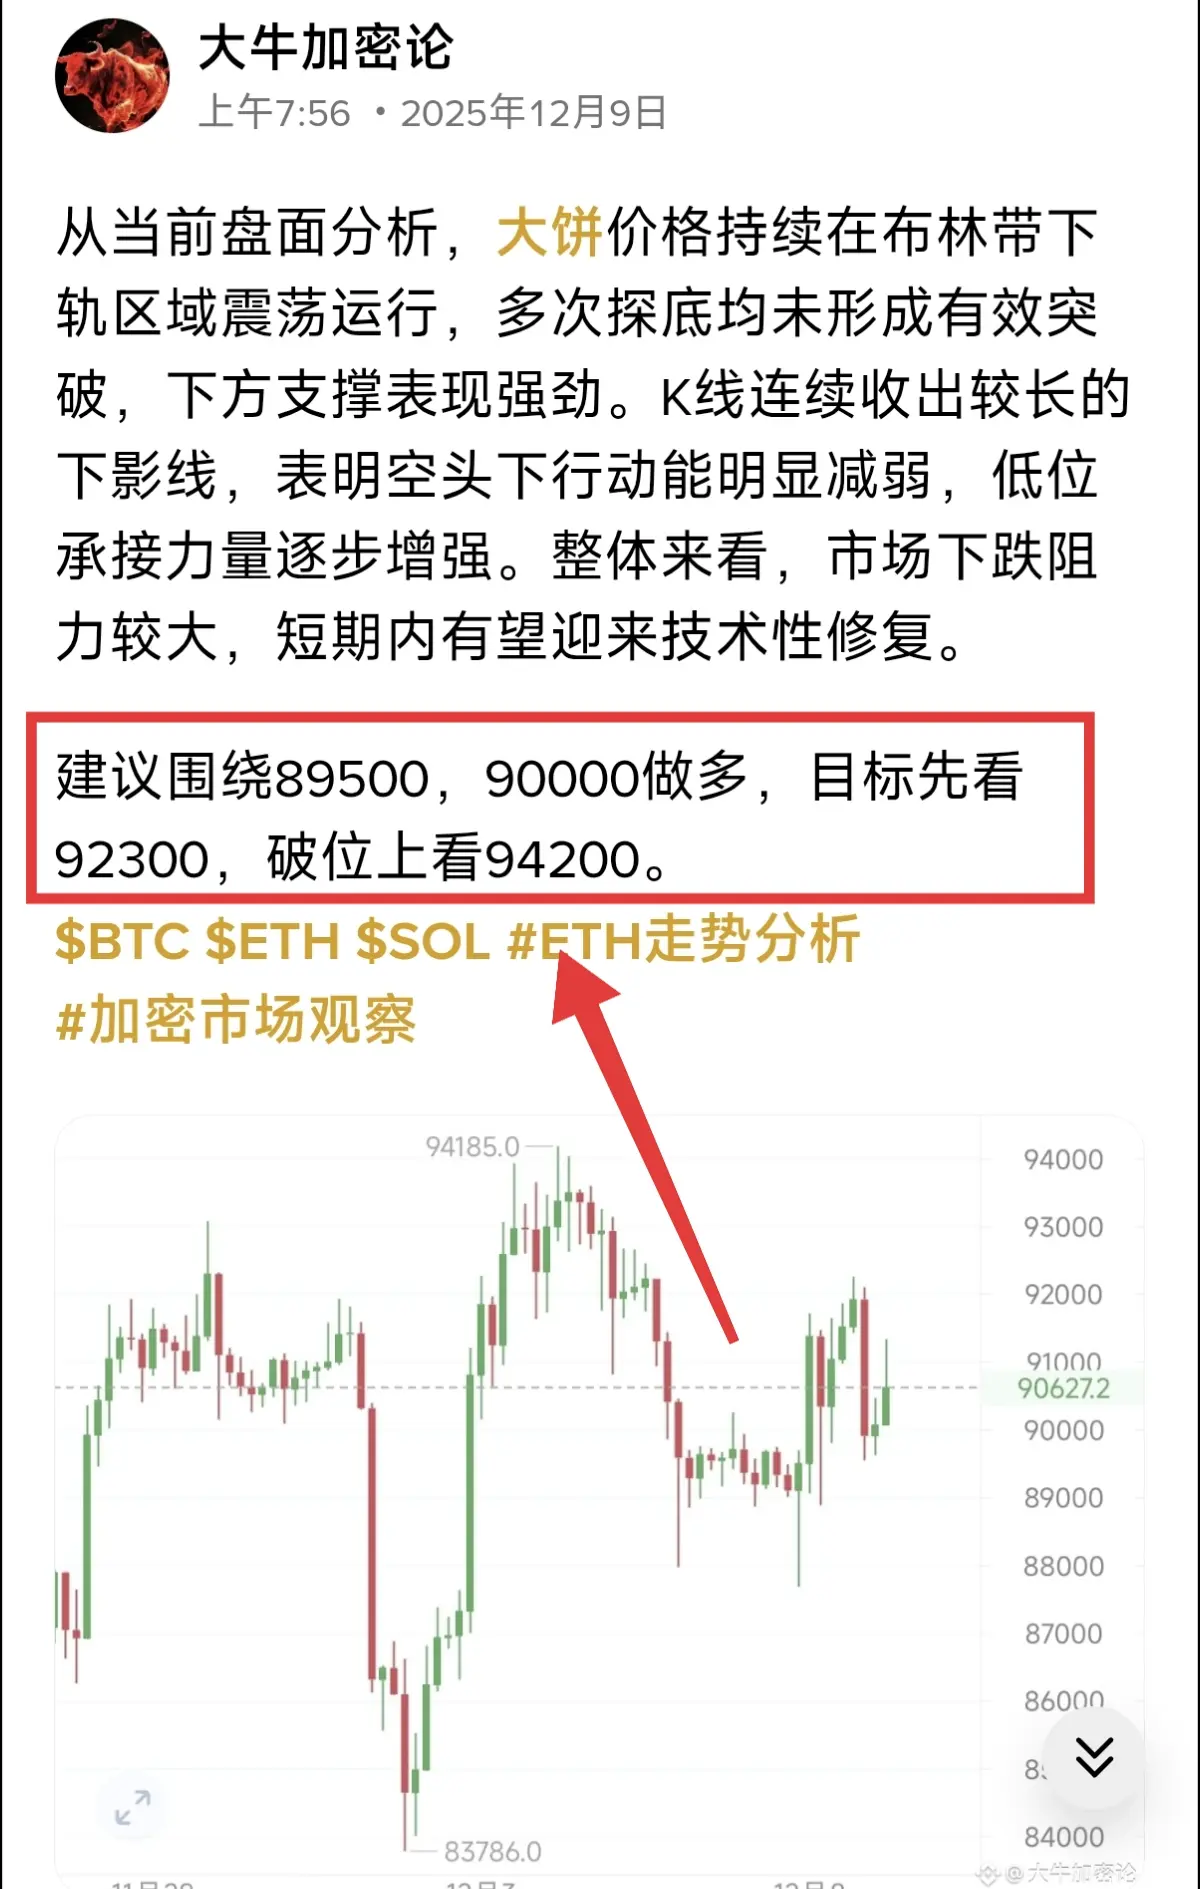
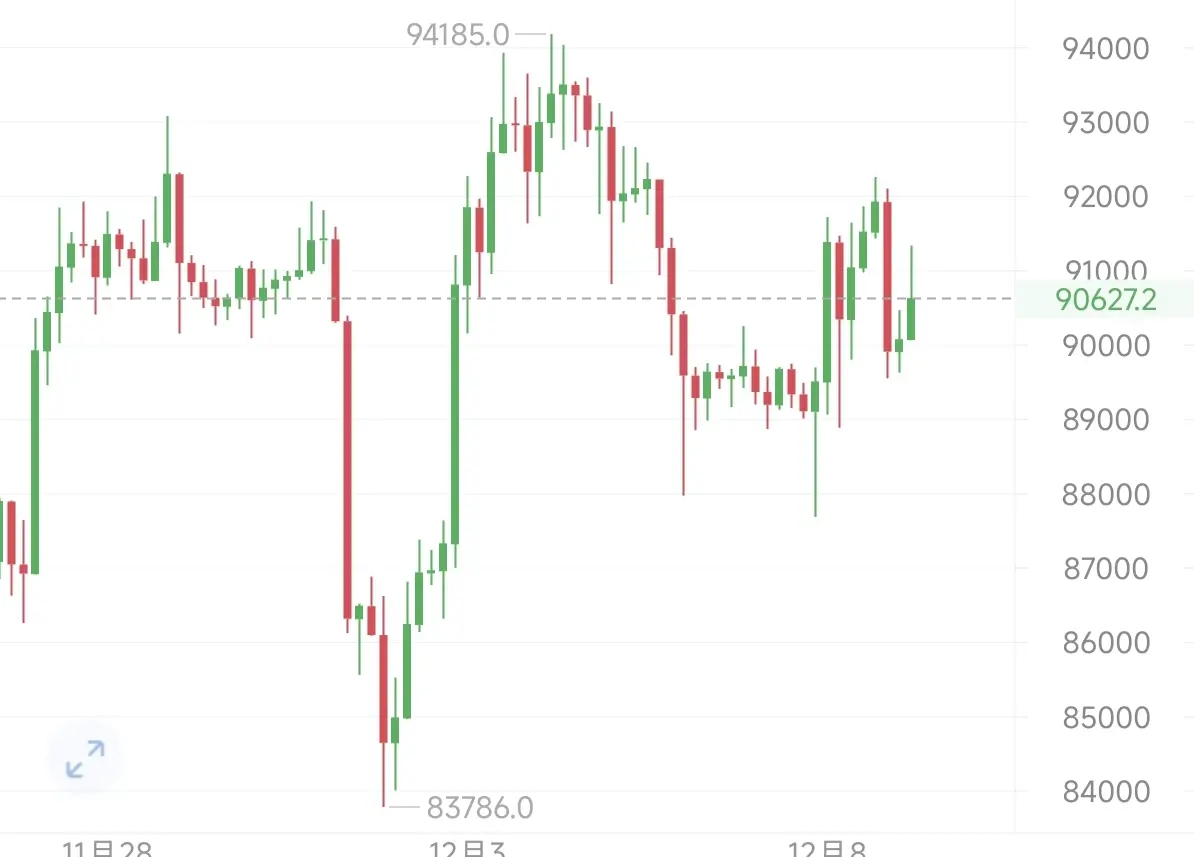
Based on the current market analysis, BTC prices continue to fluctuate near the lower Bollinger Band, repeatedly testing the bottom without a significant breakout, indicating strong support below. The candlestick chart shows several long lower wicks, suggesting that bearish momentum is clearly weakening and buying strength at lower levels is gradually increasing. Overall, the market faces significant resistance to further declines, and a technical rebound is likely in the short term.
It is recommended to go long around 89,500–90,000, with initial targets at 92,300 and, if broken, looking up to
It is recommended to go long around 89,500–90,000, with initial targets at 92,300 and, if broken, looking up to
BTC4.2%
- Reward
- like
- Comment
- Repost
- Share
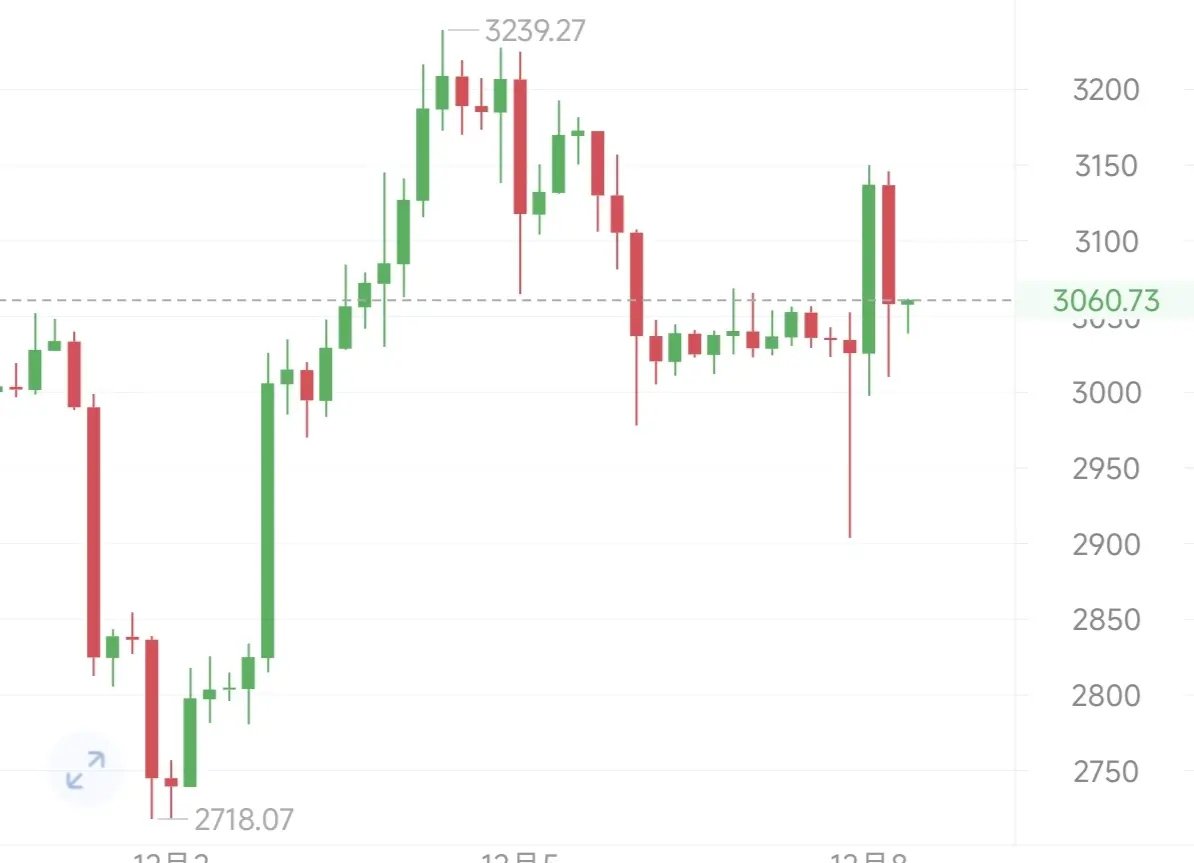
The game on Ethereum’s 4-hour chart is quite interesting. The Bollinger Bands are opening downward, with the price tightly pressed near the lower band, looking precarious. However, what's intriguing is that the MACD's fast and slow lines are quietly turning upward, and the histogram is gradually increasing bar by bar—while the bears are exerting obvious pressure, the bulls are quietly accumulating strength, with neither side willing to give in easily.
It’s recommended to go long around 3000 and 3030, with an initial target of 3150. If it breaks through, look for 3240.
$BTC $ETH #成长值抽奖赢iPhone17
View OriginalIt’s recommended to go long around 3000 and 3030, with an initial target of 3150. If it breaks through, look for 3240.
$BTC $ETH #成长值抽奖赢iPhone17
- Reward
- like
- 1
- Repost
- Share
游刃有余a :
:
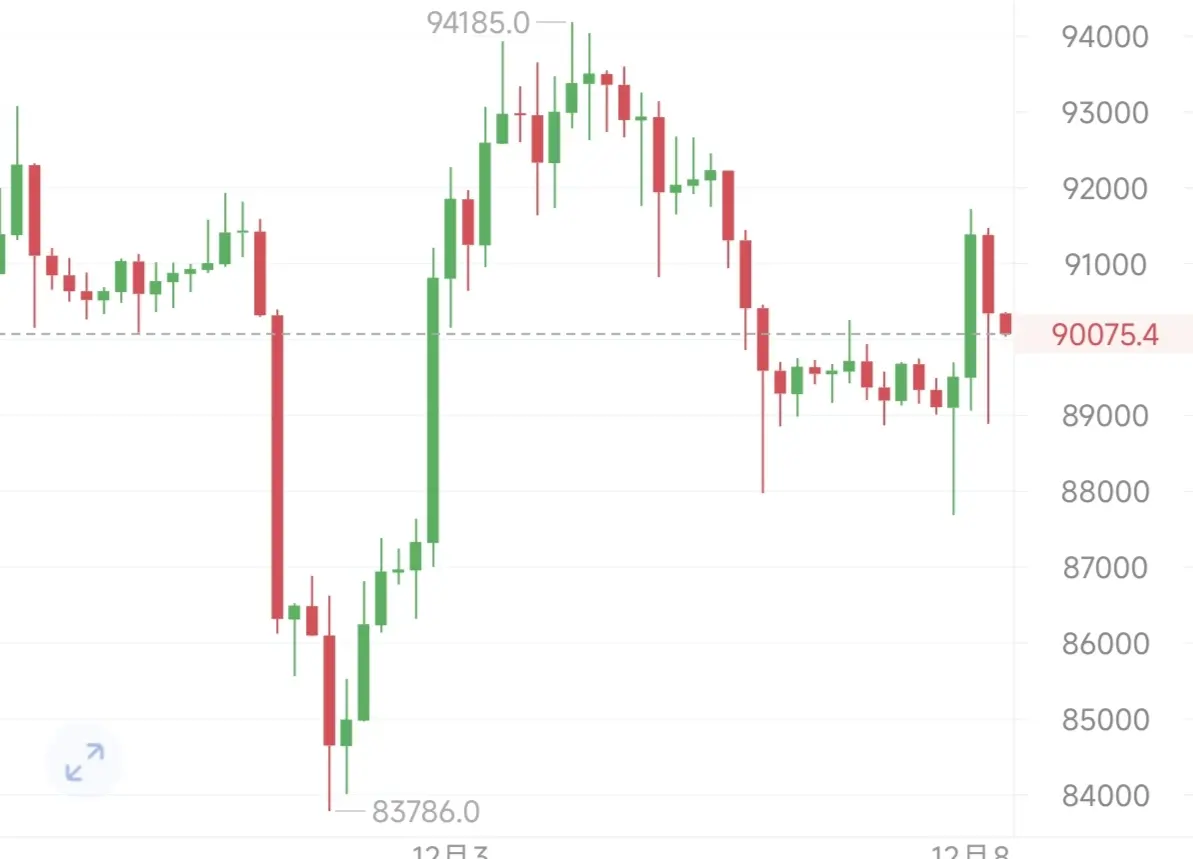
Experienced driver, guide me 📈Bitcoin has strongly broken through the key resistance at 91,500! The bulls have fully taken control, officially entering a new phase of price discovery. This breakout is structurally solid, with the potential to open up further upside, and a new round of momentum is building.
It is recommended to go long around 88,800 and 89,300, with an initial target of 91,700. If that level is broken, look for 94,200.
$BTC $ETH #成长值抽奖赢iPhone17和周边
View OriginalIt is recommended to go long around 88,800 and 89,300, with an initial target of 91,700. If that level is broken, look for 94,200.
$BTC $ETH #成长值抽奖赢iPhone17和周边
- Reward
- like
- Comment
- Repost
- Share
Ethereum’s technicals are moving in tandem with Bitcoin for reference. The overall trend is the same as Bitcoin, with the daily chart finding support at the middle band. After a period of consolidation and adjustment over the weekend, it has stabilized, so we can expect a rebound and upward movement. The 4-hour Bollinger Bands are starting to contract, and the candlesticks are above the 7-period moving average, so strategies should reference Bitcoin accordingly.
It’s recommended to go long around 3000 and 2970, with an initial target of 3110. If it breaks through, look for 3240.
$BTC $ETH #成长值
View OriginalIt’s recommended to go long around 3000 and 2970, with an initial target of 3110. If it breaks through, look for 3240.
$BTC $ETH #成长值
- Reward
- like
- Comment
- Repost
- Share
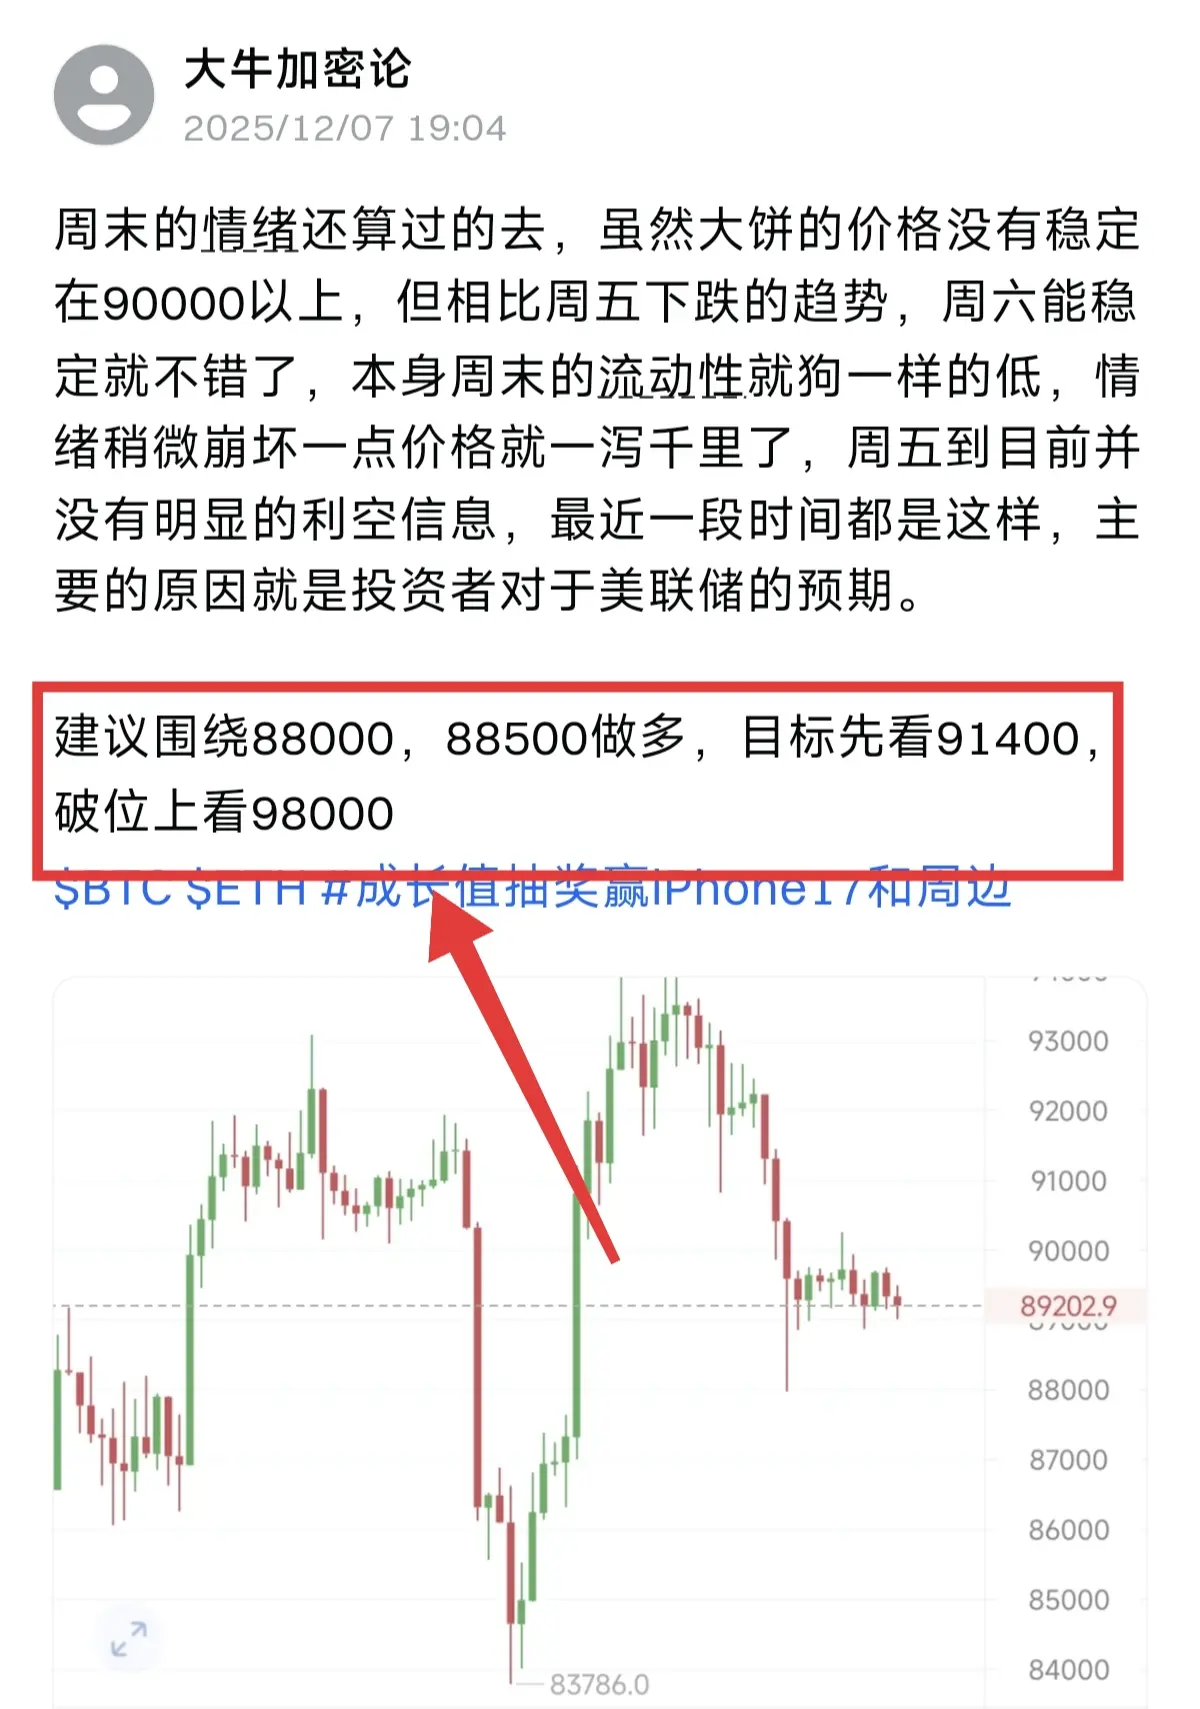
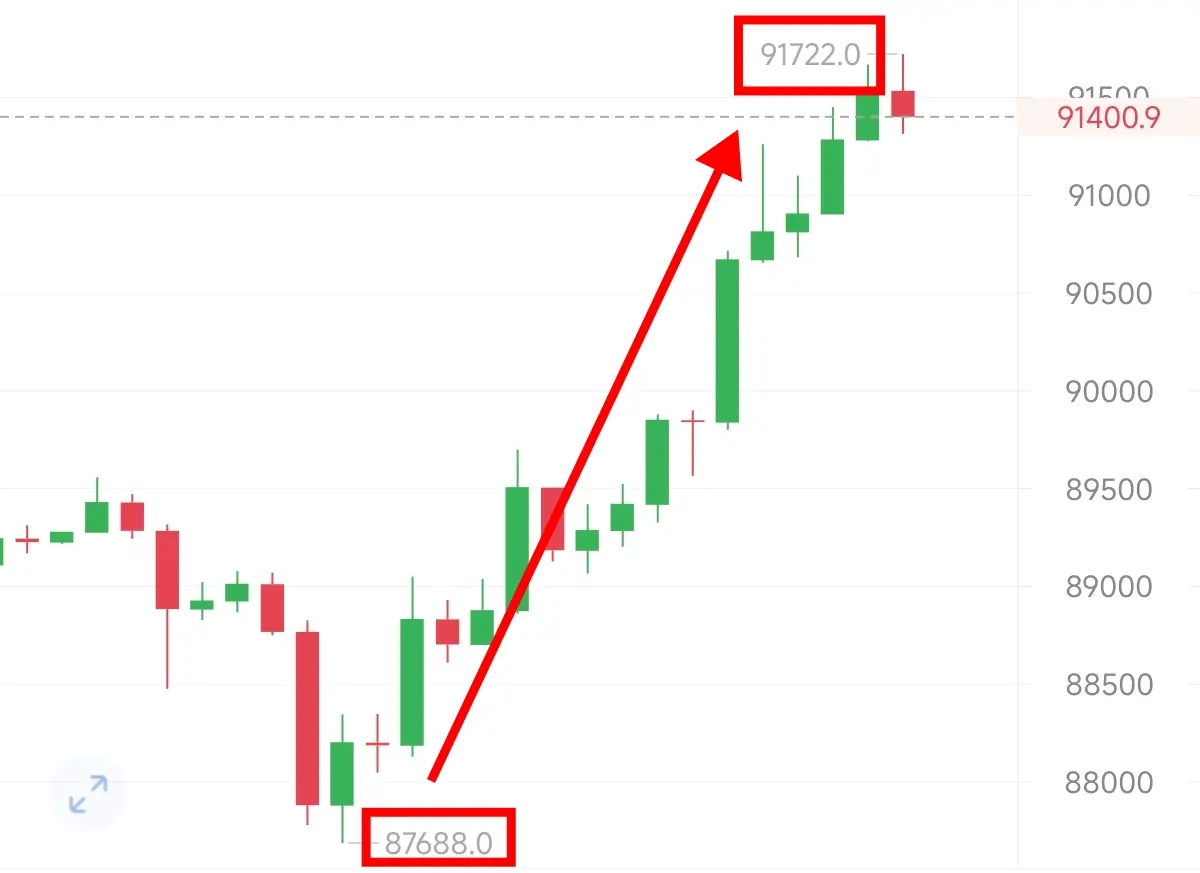
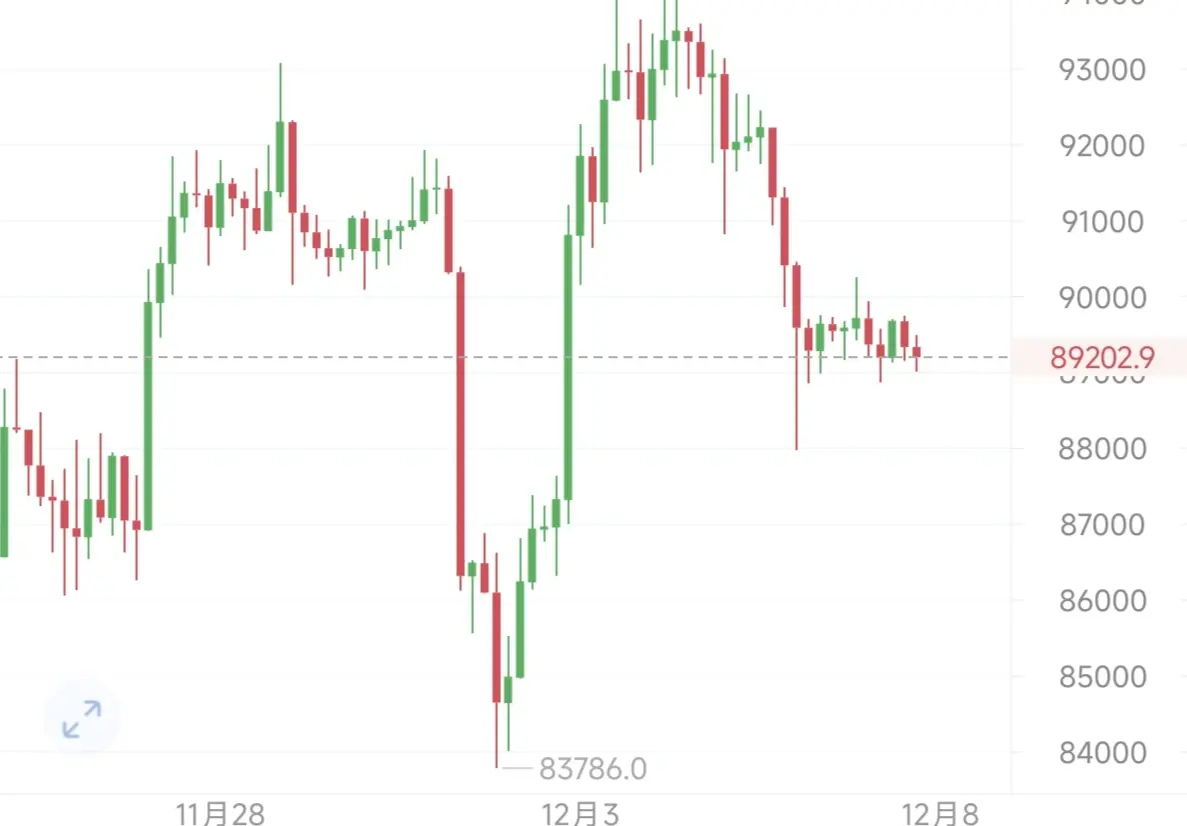
The weekend sentiment was fairly decent. Although Bitcoin's price hasn't stabilized above 90,000, it's still better than Friday's downward trend. Being able to stay stable on Saturday is already good, considering the weekend liquidity is extremely low—if sentiment collapses even a little, the price can plummet rapidly. From Friday until now, there hasn't been any significant negative news. It's been like this recently, mainly because investors' expectations of the Federal Reserve are the key factor.
It is recommended to go long around 88,000–88,500, with an initial target of 91,400. If it brea
View OriginalIt is recommended to go long around 88,000–88,500, with an initial target of 91,400. If it brea
- Reward
- 2
- 1
- Repost
- Share
Walker998:
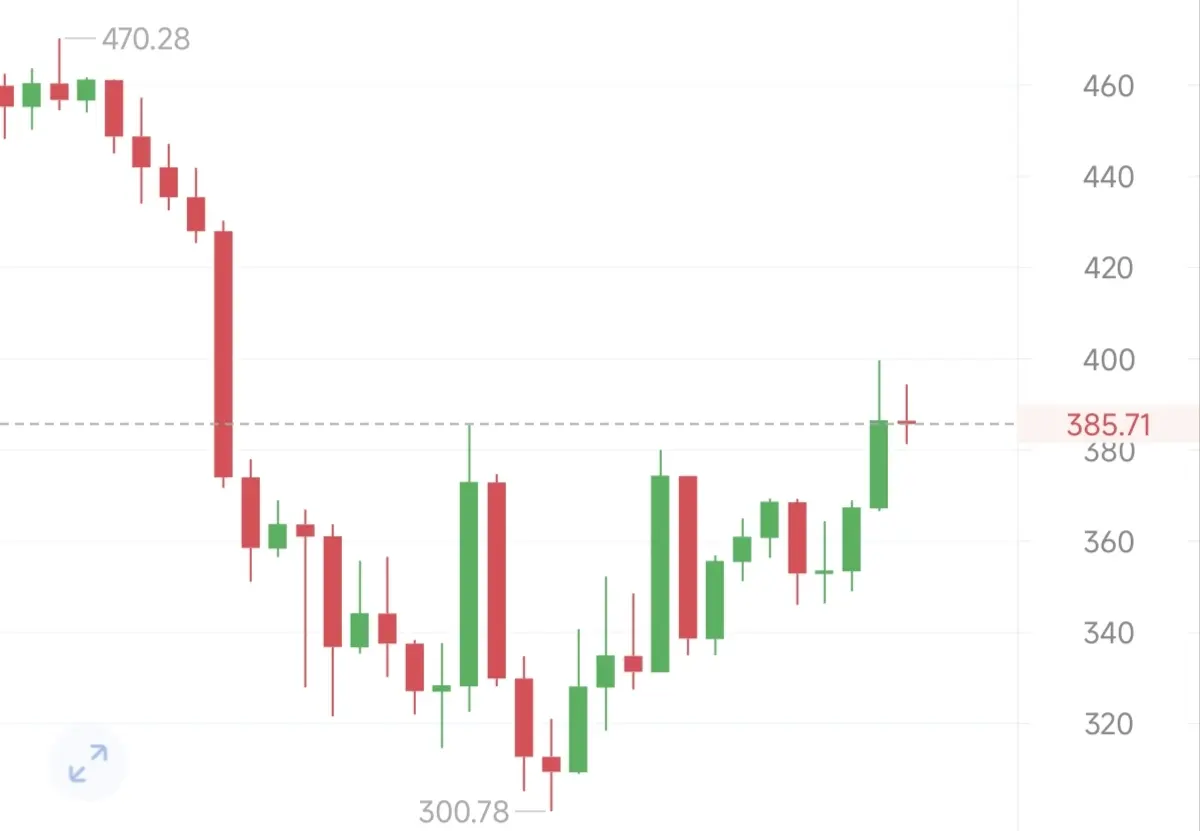
Get rich, get rich, get rich, get rich, get rich, get rich, get rich, get rich, get rich, get rich, get rich, get rich, get rich, get rich, get rich, get rich, get rich, get rich, get rich, get rich, get rich, get rich.From the four-hour chart, it has been in a downtrend since the middle of last month, but there are signs of a recent reversal. The daily chart also shows three consecutive bullish candles, which presents a good opportunity to go long.
It is recommended to go long around 370 and 330, with an initial target of 430; if it breaks through, look for 500.
$ZEC $BTC #晒出我的Alpha积分
View OriginalIt is recommended to go long around 370 and 330, with an initial target of 430; if it breaks through, look for 500.
$ZEC $BTC #晒出我的Alpha积分
- Reward
- like
- Comment
- Repost
- Share
Ethereum's current market is not exhibiting a sharp V-shaped rebound, but rather a "slow bottom-building" recovery. This type of trend may involve repeated fluctuations and back-and-forth movement, and the pace of progress appears hesitant. However, it precisely retains the potential for a strong upward move in the future. It reflects that the market is gradually calming down from the panic of a one-sided decline, and bullish forces are starting to gather at lower levels. As long as the key support areas are maintained, the longer and more thorough this consolidation lasts, the more solid and
View Original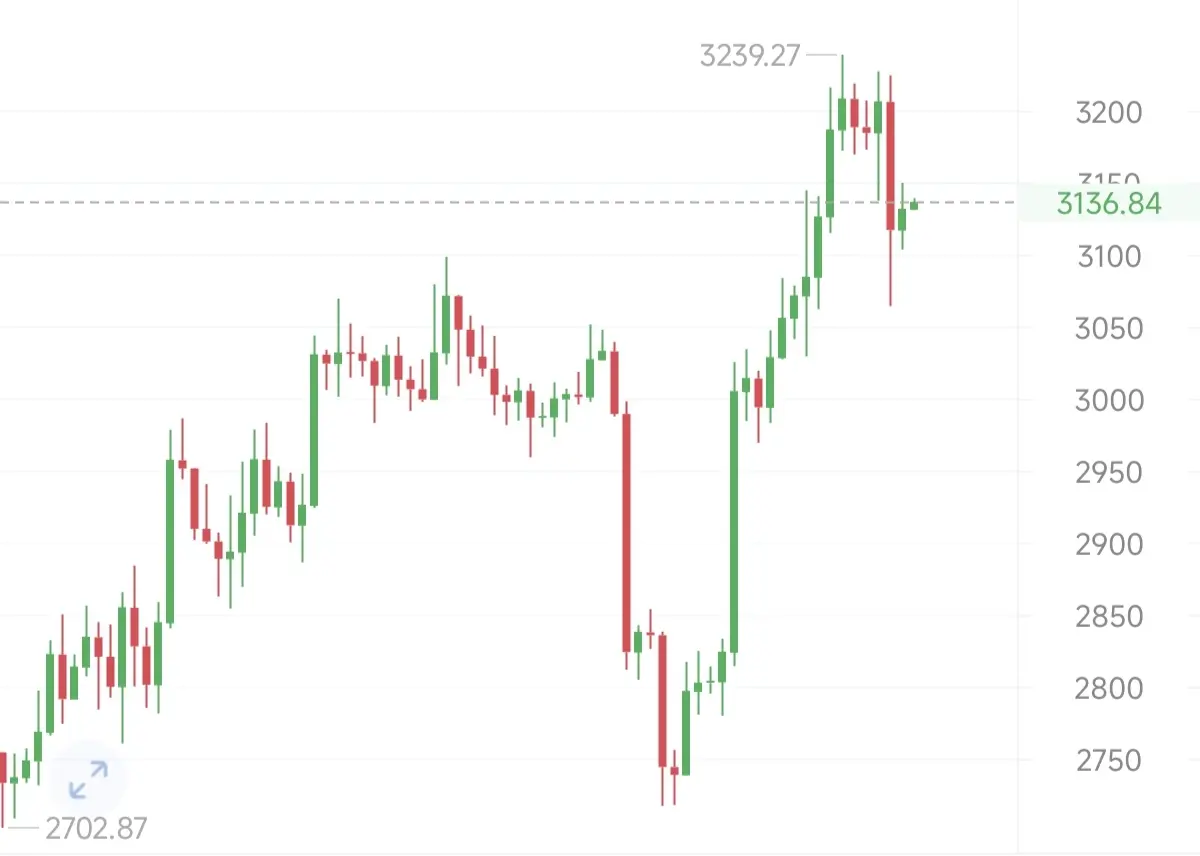
- Reward
- like
- Comment
- Repost
- Share
Currently, under the appearance of weakness, Bitcoin is demonstrating remarkable resilience at a key technical area. On the four-hour chart, the candlestick with a pronounced lower shadow is more than just a pattern—it serves as a clear record of defense. Bears have tested the downside multiple times but have been met with strong and sustained support. Especially on the one-hour chart, after the price precisely dipped to 90822, it was quickly recovered. This clearly indicates that the support below is not just nominal, but a well-defended “defensive stronghold” by the bulls.
It is recommended
View OriginalIt is recommended
- Reward
- like
- Comment
- Repost
- Share
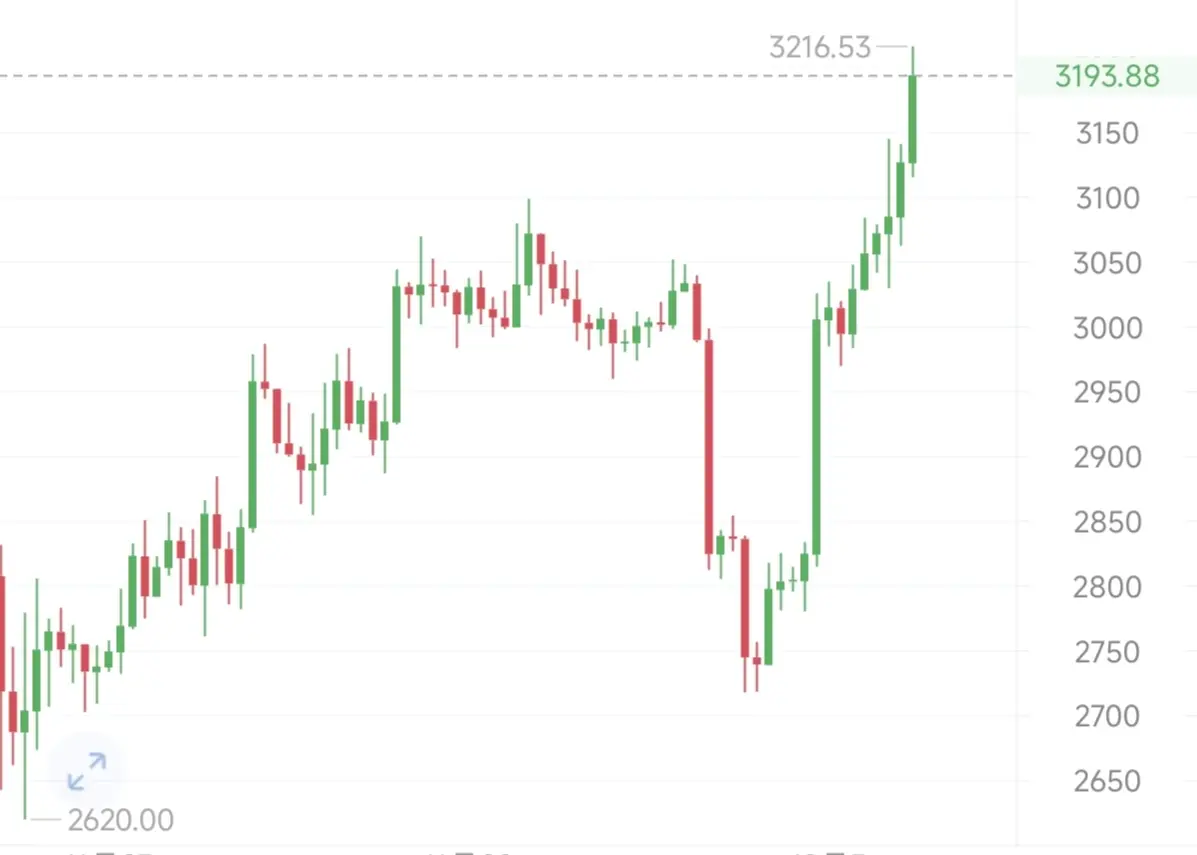
Ethereum price faced resistance and pulled back near the intraday high of 3216. Although it has regained the middle band in a string of consecutive bullish candles, forming a technical breakout on a smaller time frame, the short-term structure is relatively strong. However, overall momentum remains moderate, with no clear signs of a strong one-sided trend, and the price action is still within a consolidation phase.
From the current market perspective, although price has returned above the middle band, the upward momentum is limited, and multiple tests of the highs have failed to produce a vali
View OriginalFrom the current market perspective, although price has returned above the middle band, the upward momentum is limited, and multiple tests of the highs have failed to produce a vali
- Reward
- like
- Comment
- Repost
- Share
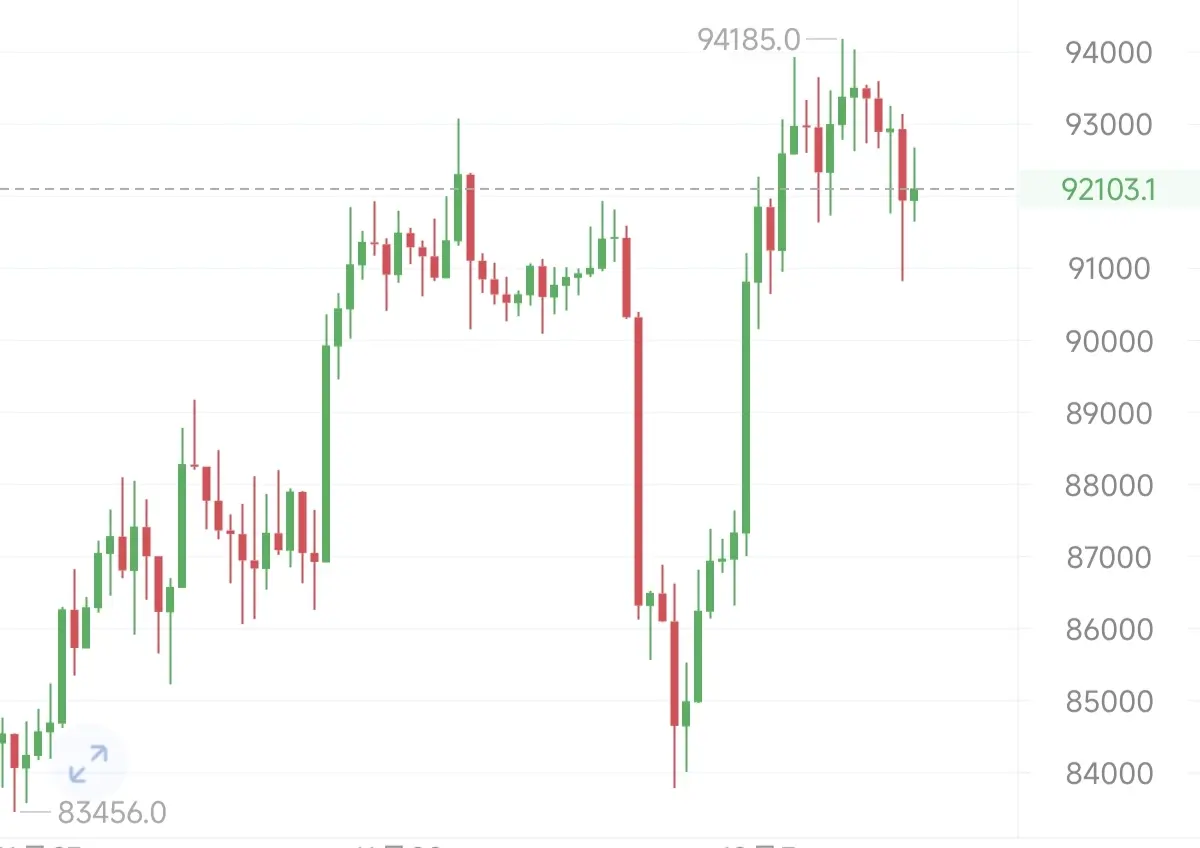
On the four-hour chart for Bitcoin, a V-shaped reversal has started from the recent low, accompanied by relatively active trading volume. If it can effectively break through the previous high and key resistance at 95,000 within the day, the bulls will open up a new round of upward movement, entering a strong continuation phase. Otherwise, the market will likely maintain a choppy upward trend, testing higher levels in a two-steps-forward, one-step-back manner.
It is recommended to go long around 92,500 and 93,000, with an initial target of 94,500. If it breaks through, look for 96,800.
$BTC #晒出
View OriginalIt is recommended to go long around 92,500 and 93,000, with an initial target of 94,500. If it breaks through, look for 96,800.
$BTC #晒出
- Reward
- like
- Comment
- Repost
- Share
- Reward
- like
- 1
- Repost
- Share
YaoQianshuA:
Awesome, awesome
From the perspective of dual-period linkage, the short-term rebound trend of Ether still shows sustainability. Currently, the price is running well, and the buying momentum is gradually strengthening. If it can effectively break through and hold above the resistance level of 3035, it is expected to further open up the upper space and push the market towards higher regions. Even if a technical pullback occurs in the short term, as long as the price can stabilize above the middle band support on the 4-hour level, the overall rebound structure will remain intact.
It is recommended to go long arou
View OriginalIt is recommended to go long arou
- Reward
- like
- Comment
- Repost
- Share
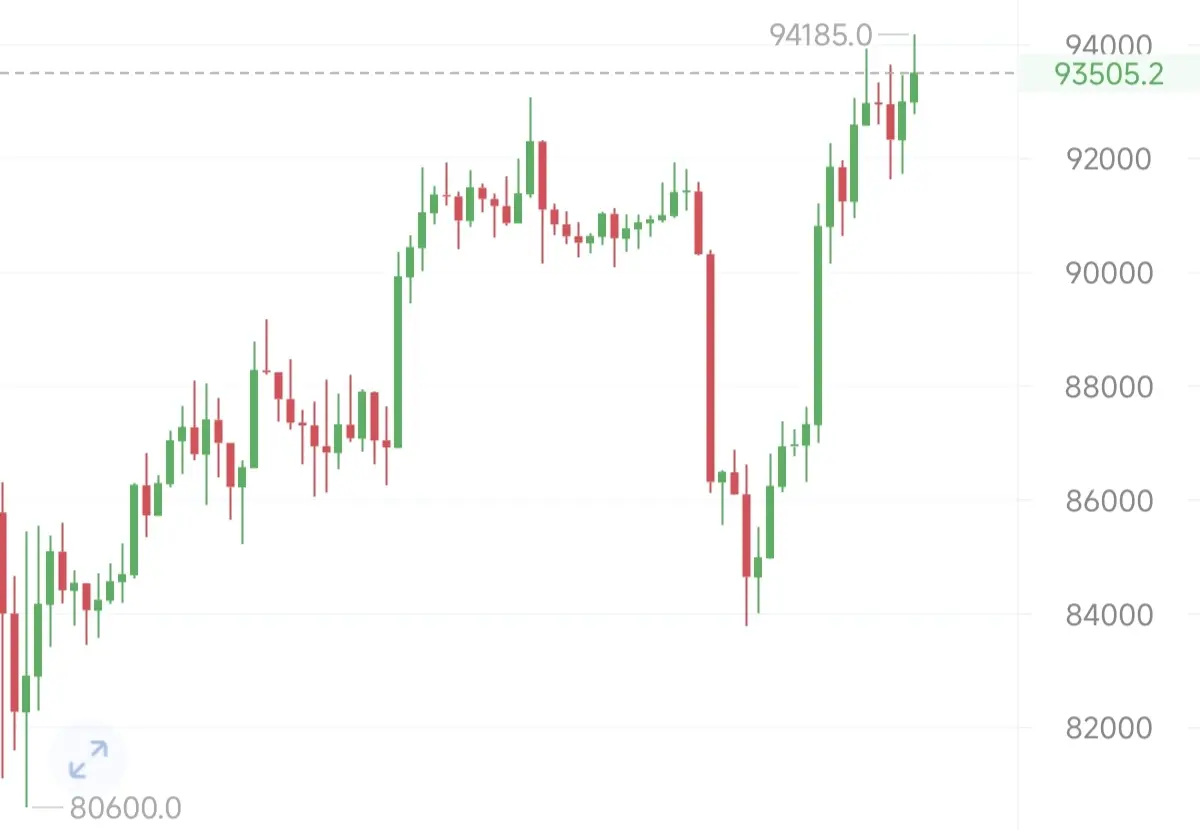
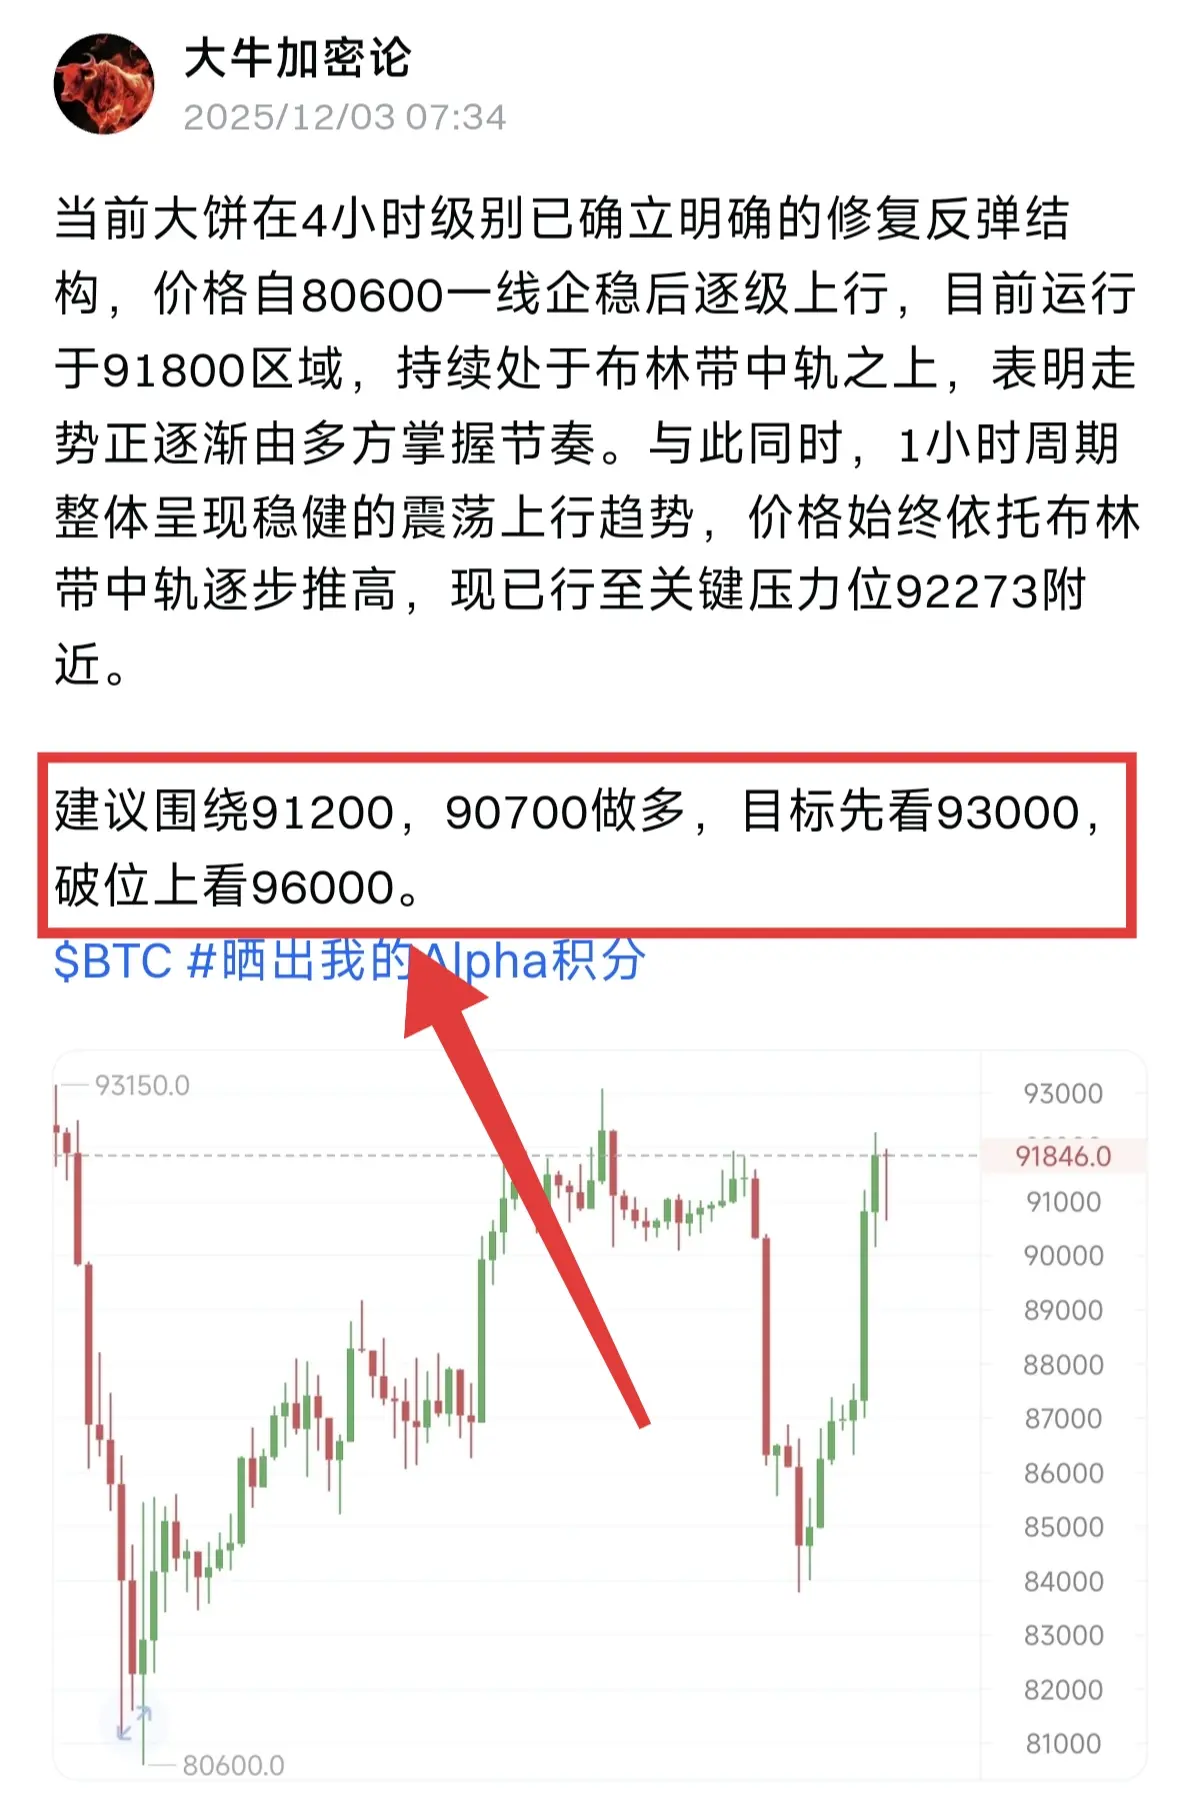
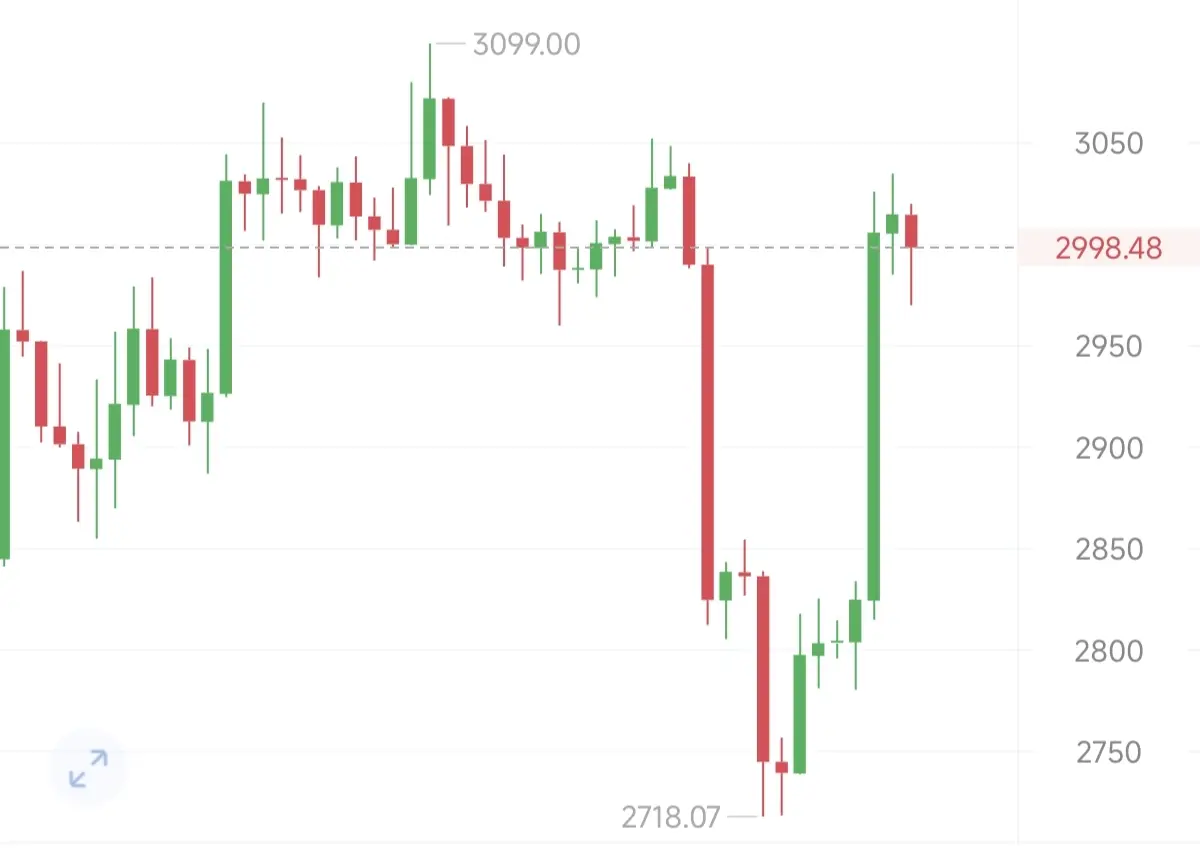
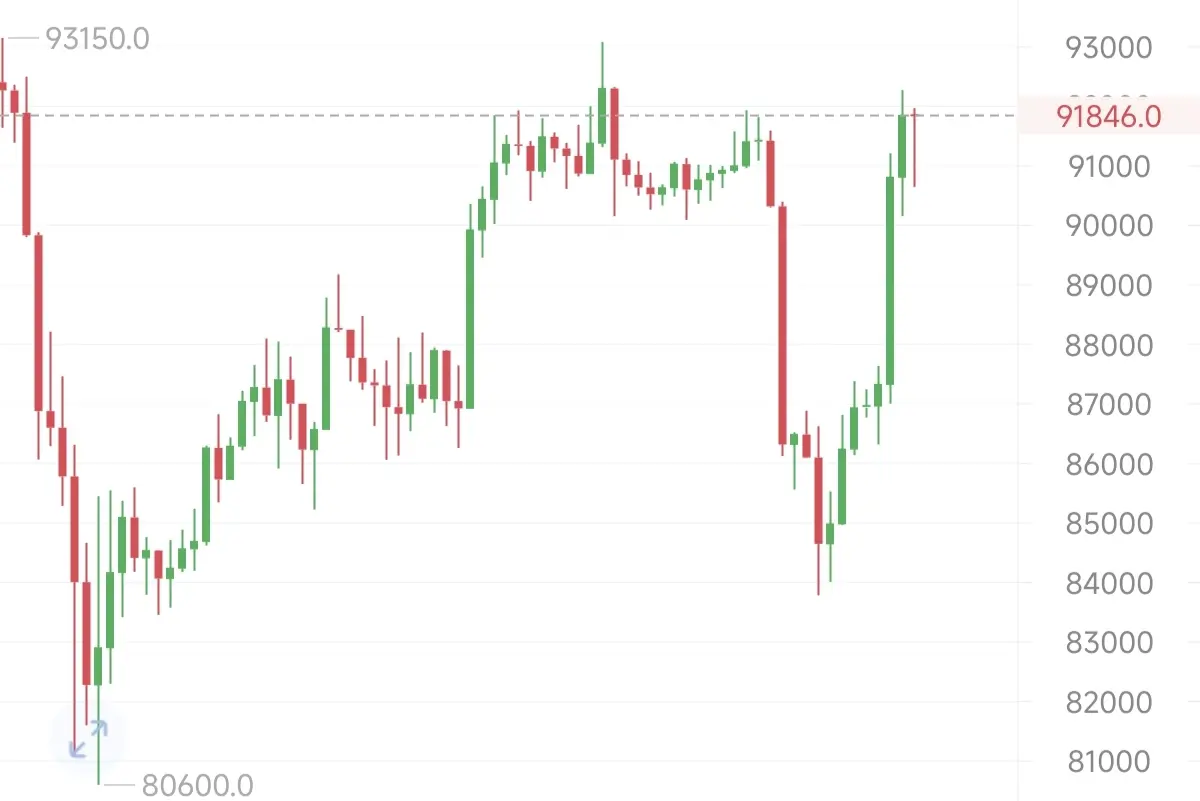
Currently, BTC has established a clear repair rebound structure on the 4-hour level. After stabilizing around the 80600 line, the price has gradually risen and is currently operating in the 91800 area, continuously staying above the middle band of the Bollinger Bands, indicating that the trend is gradually being controlled by the longer. Meanwhile, the overall trend on the 1-hour cycle shows a steady upward fluctuation, with the price consistently relying on the middle band of the Bollinger Bands to push higher, now reaching the key resistance level near 92273.
It is recommended to go longer a
It is recommended to go longer a
BTC4.2%
- Reward
- like
- Comment
- Repost
- Share
On the 4-hour level of Ether short-term trading, the market shows a fluctuating characteristic with frequent alternation of bullish and bearish Candlesticks. During the rebound process, it has repeatedly encountered selling pressure and retraced, while the downward trend is also accompanied by resistant rebounds, indicating a fierce battle between the bulls and bears in the current area. Although the overall fluctuation range is temporarily limited, the short positions still hold a relative advantage in the competition, and the market data shows a slow downward trend.
It is recommended to shor
View OriginalIt is recommended to shor

- Reward
- like
- Comment
- Repost
- Share
Observing the overall market data structure of BTC, the daily chart has shown a clear weakening of upward momentum after experiencing a series of small bullish lines rebound. Recently, it has turned into a pattern of consecutive bearish lines. Today's candlestick formed a longer upper wick, closing in a bearish line shape, and the trend continued the weakness from the previous trading day. Currently, the price is operating below the middle band of the daily chart, indicating that the main market trend is still leaning towards short positions.
It is recommended to short around 86900 and 874
View OriginalIt is recommended to short around 86900 and 874

- Reward
- like
- Comment
- Repost
- Share