Mir.Z
专注指标策略研究,有图有真相,更直观的判断行情趋势。让新手小白快速上手,能独立做单。
置顶
Mir.Z
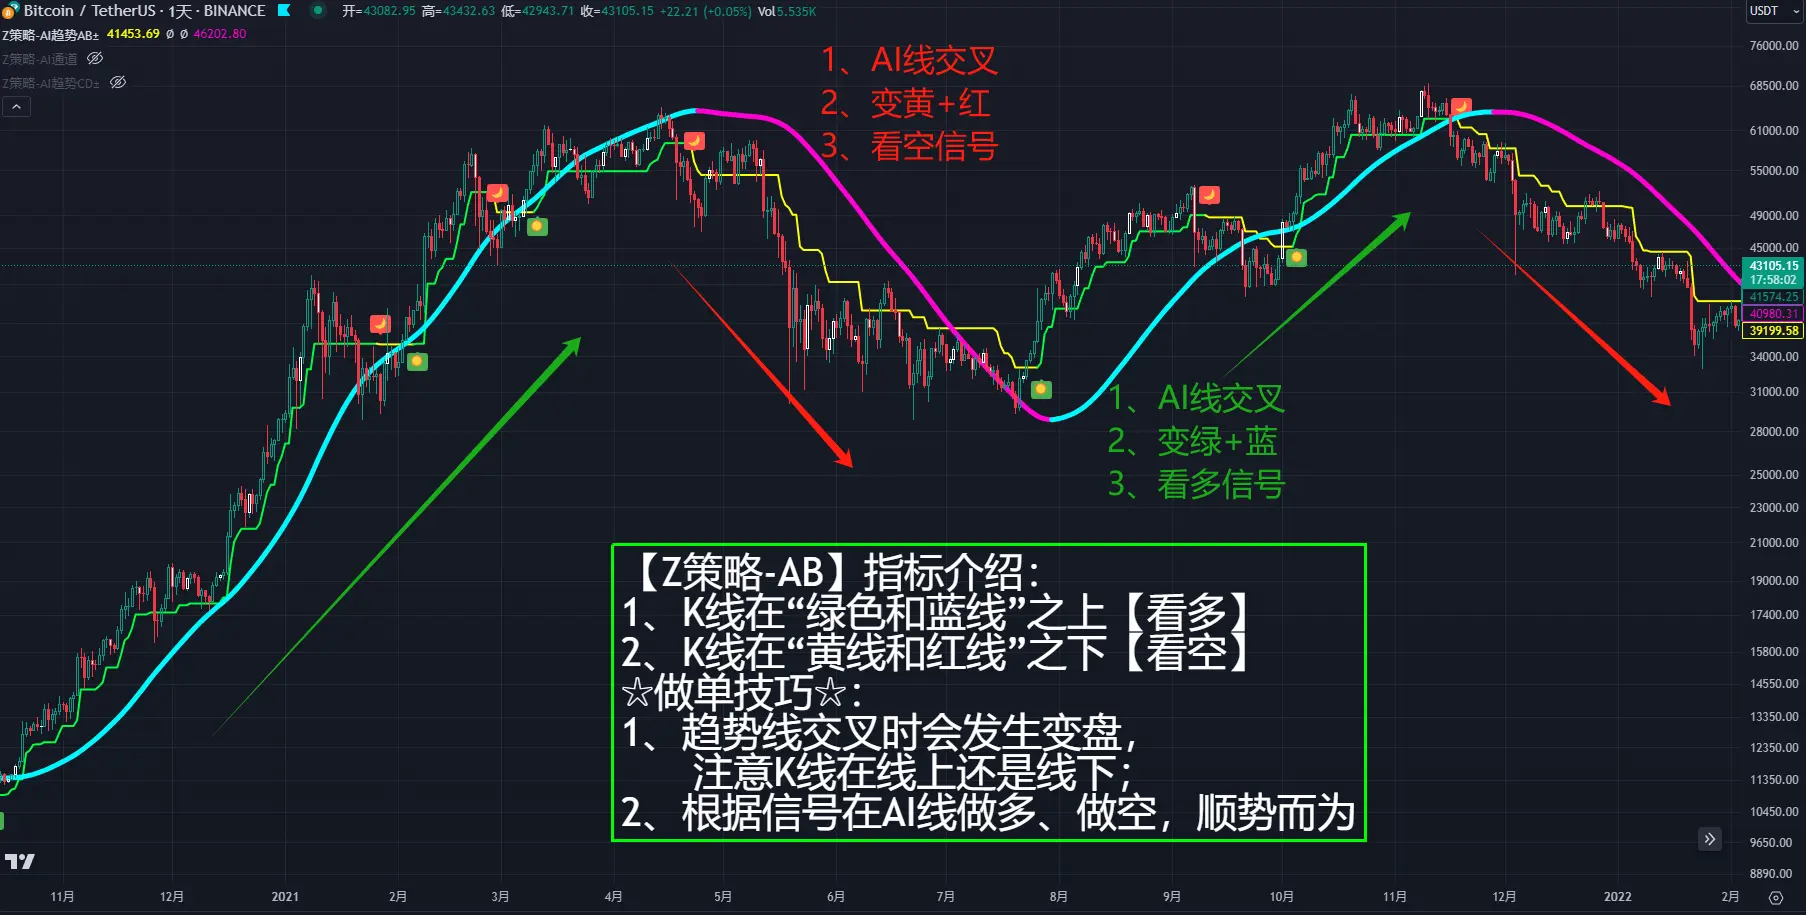
【Z策略】AI指标图文介绍

- 赞赏
- 17
- 5
- 转发
- 分享
吉星高照好运来 :
:
👍查看更多


晚上数据公布,天地针挂单策略

- 赞赏
- 点赞
- 评论
- 转发
- 分享
今晚白宫加密参会币种日线【策略信号】一览图

- 赞赏
- 点赞
- 评论
- 转发
- 分享
今晚是个丰富多彩的夜晚,有人欢喜有人愁!
- 赞赏
- 点赞
- 评论
- 转发
- 分享


- 赞赏
- 2
- 1
- 转发
- 分享
GateUser-a11a194d :
:
到大月亮 🌕到大月亮 🌕到大🌕月亮 🌕到大月亮 🌕到大月亮 到大月亮 到大月亮 🌕🌕