Zhou Yanling: Latest trend prediction analysis and trading strategy for 11.2 Bitcoin BTC and Ether ETH today.
Due to most people being stuck at high positions earlier, they are now eager for the coin price to rise quickly. Unfortunately, the explanation for the cycle of fluctuations is that it won't return immediately. Even if it won't drop further, those who bought at high positions will find it very difficult for a long time, and whether they can hold on is a big question. Once you can't hold on and lose patience, you will gradually lose your subjective judgment on the coin price. This is what Yanling has always said: to truly understand the essence of trading, the first is to disperse your attention, rather than staring at the coins in your hands all day asking others if they will rise. The second is that you can feel the recent volatility and trends of the coin price, which will also allow you to more intuitively judge whether to continue holding the coins you have. There is no harm in doing so.
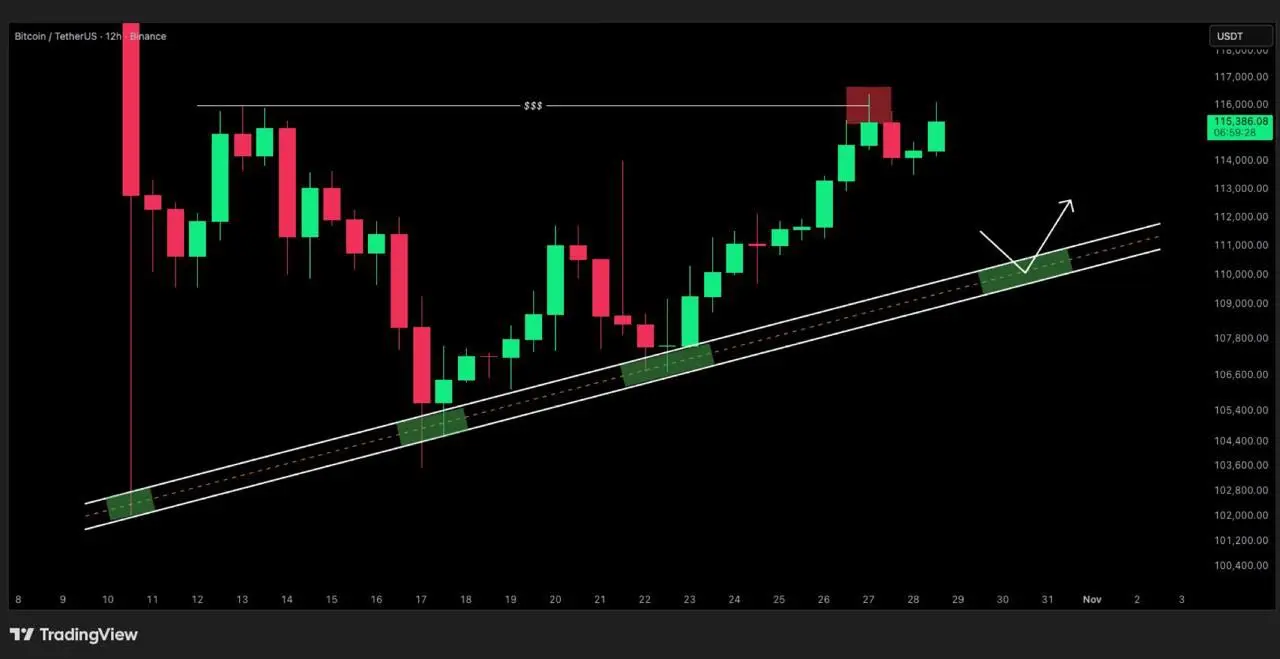
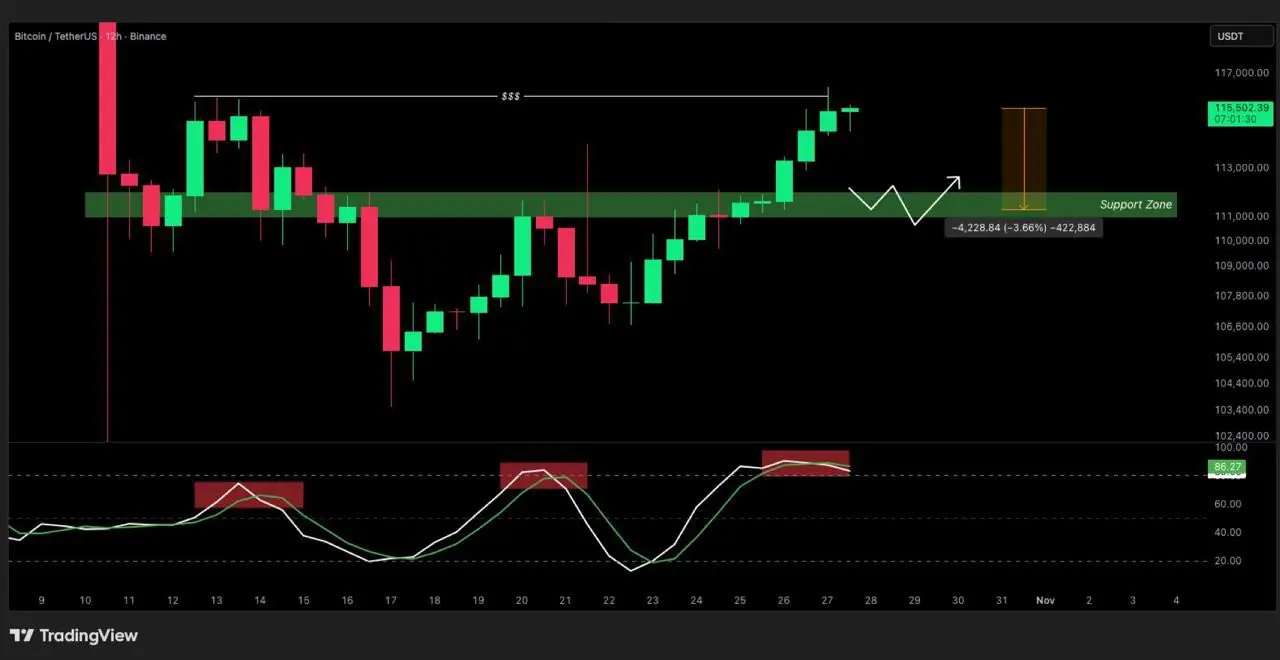
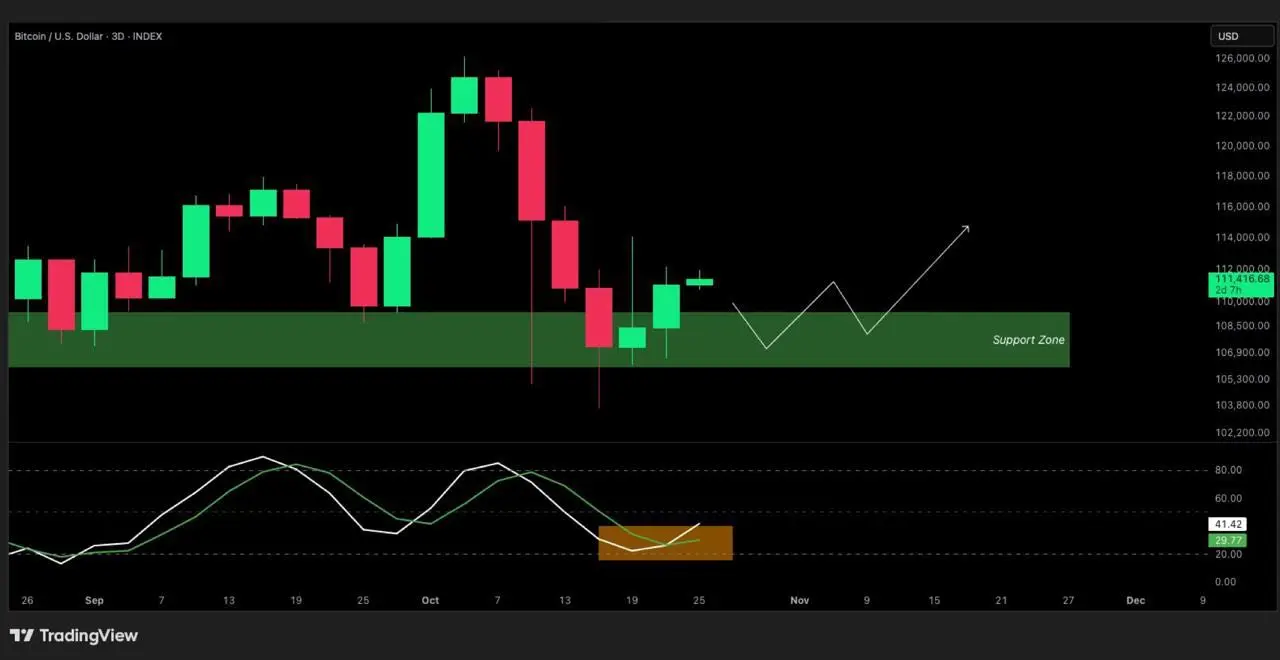
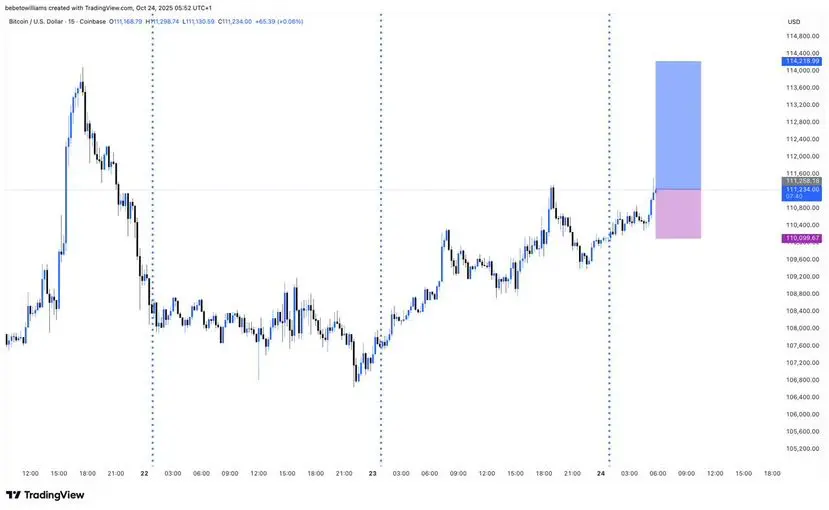
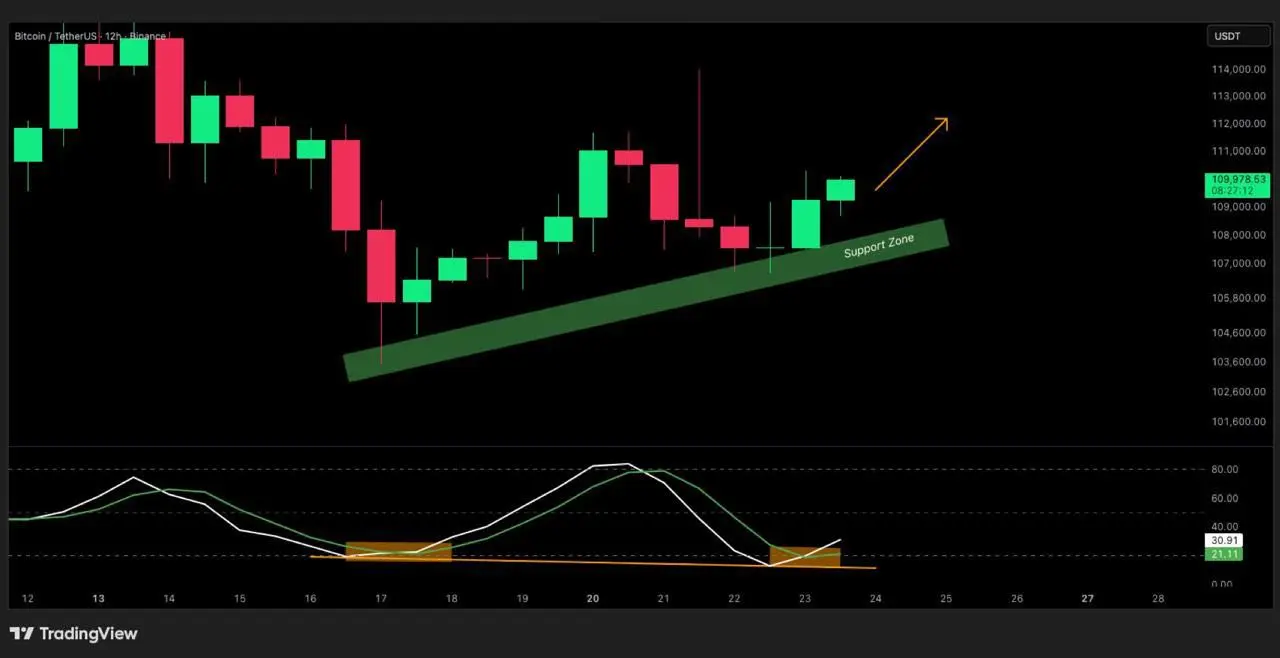
Without further ado, let's take a look at the technical aspects as usual. On the daily chart, the coin price formed a long bullish candle yesterday, indicating that the bullish momentum is gradually rising. On the hourly chart, the recent candlesticks show a fluctuating upward trend, with the lows gradually rising and the highs continuously hitting new highs. The technical indicator MACD on the hourly chart shows a sustained increase in red bars, but there are signs of shortening. The fast and slow lines are above the zero axis, indicating weakened momentum but still leaning towards bullish. The RSI on the hourly chart is at 57.6, not in the overbought range, with market sentiment being neutral to bullish. The current price is above the EMA7 and EMA30, and EMA7 > EMA30 > EMA120, showing a clear bullish trend. In the short-term operations, pay close attention to the support level at 108500 and the resistance level at 112000. For intraday operations, the main strategy is to go long in line with the trend, with short positions in high range as a supplement.
Zhou Yanling 11.2 Bitcoin trading strategy:
1. More than 109200-110000, stop loss below 108200, target 111200-112000
2. 112000-111200 short, stop loss below 113000, target 110500-109500
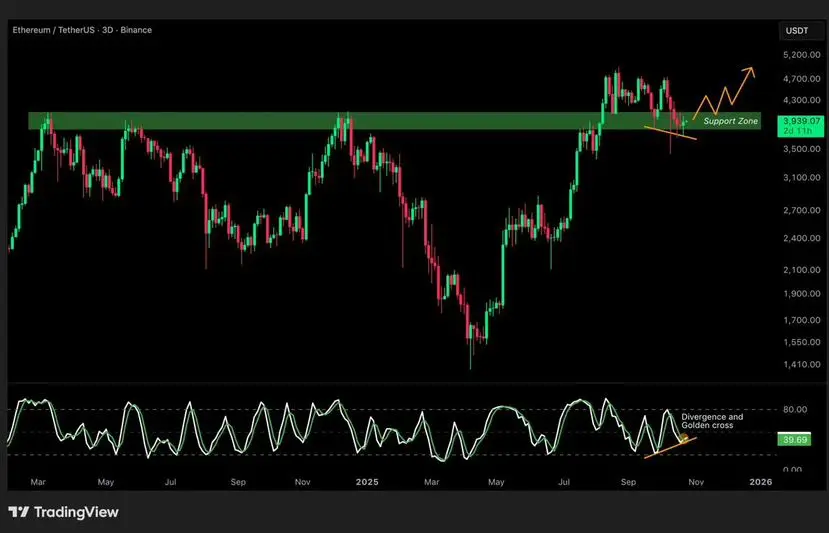
Zhou Yanling 11.2 Ether trading strategy:
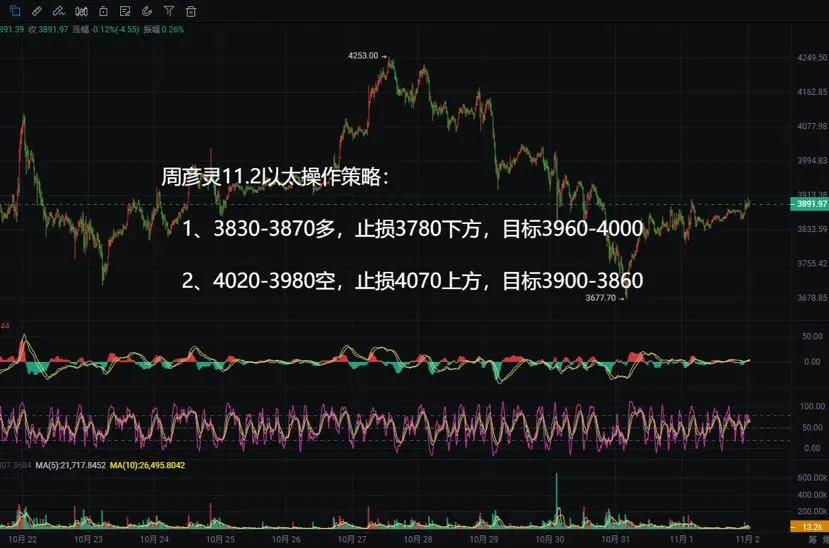
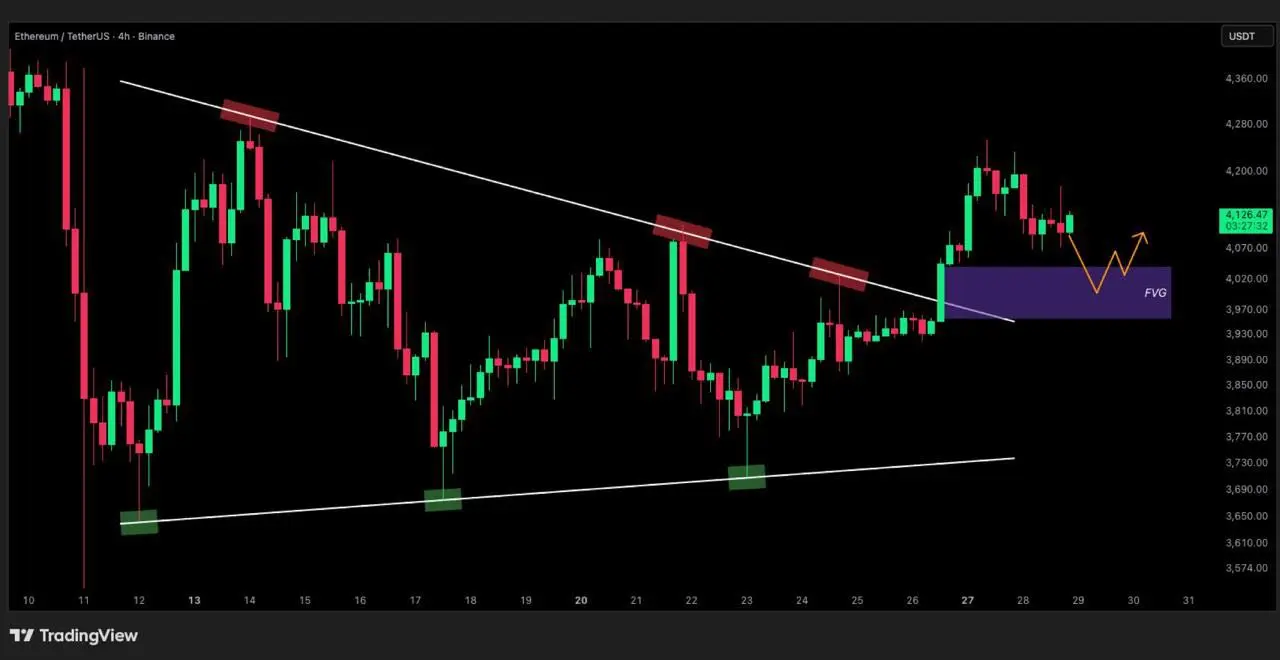
1. Buy between 3830-3870, stop loss below 3780, target 3960-4000.
2. Short at 4020-3980, stop loss above 4070, target 3900-3860
【The above analysis and strategies are for reference only. Please bear the risks yourself. The article review and publication may have delays, and the strategies may not be timely. Specific operations should be based on Yanling's real-time strategies.】
The content of this article is exclusively shared by senior analyst Zhou Yanling. The author has been engaged in financial market investment research for over ten years and currently mainly analyzes and guides BTC, ETH, DOT, DOGE, LTC, FIL, EOS, XRP, BCH, ETC, BSV, and other cryptocurrency contract/spot operations. The author has a solid theoretical foundation and practical experience, excels in combining technical and news-based operations, emphasizes capital management and risk control, and has a stable and decisive trading style. The author is recognized by many investment friends for a personable and responsible character coupled with sharp and decisive operations. #抄底币种推荐 $BTC $ETH
