Trade
Basic
Futures
Futures
Hundreds of contracts settled in USDT or BTC
Options
HOT
Trade European-style vanilla options
Unified Account
Maximize your capital efficiency
Demo Trading
Futures Kickoff
Get prepared for your futures trading
Futures Events
Participate in events to win generous rewards
Demo Trading
Use virtual funds to experience risk-free trading
Earn
Launch
CandyDrop
Collect candies to earn airdrops
Launchpool
Quick staking, earn potential new tokens
HODLer Airdrop
Hold GT and get massive airdrops for free
Launchpad
Be early to the next big token project
Alpha Points
NEW
Trade on-chain assets and enjoy airdrop rewards!
Futures Points
NEW
Earn futures points and claim airdrop rewards
Investment
Simple Earn
Earn interests with idle tokens
Auto-Invest
Auto-invest on a regular basis
Dual Investment
Buy low and sell high to take profits from price fluctuations
Soft Staking
Earn rewards with flexible staking
Crypto Loan
0 Fees
Pledge one crypto to borrow another
Lending Center
One-stop lending hub
VIP Wealth Hub
Customized wealth management empowers your assets growth
Private Wealth Management
Customized asset management to grow your digital assets
Quant Fund
Top asset management team helps you profit without hassle
Staking
Stake cryptos to earn in PoS products
Smart Leverage
NEW
No forced liquidation before maturity, worry-free leveraged gains
GUSD Minting
Use USDT/USDC to mint GUSD for treasury-level yields
More
Trending Topics
View More28.21K Popularity
29.01K Popularity
26.35K Popularity
17.99K Popularity
106.2K Popularity
Pin
Gate Square New & Returning Creator Rewards are ongoing!
Your ideas may be more valuable than you think!
Make your first post or come back post to share a $20,000 monthly prize pool!
Post with #MyFirstPostOnSquare to receive a $50 Position Voucher each
Monthly Top Posters and Top Engagers will each earn an extra $50 reward
Your crypto insights could inspire many—start creating today!
👉 https://www.gate.com/postGate Square “Creator Certification Incentive Program” — Recruiting Outstanding Creators!
Join now, share quality content, and compete for over $10,000 in monthly rewards.
How to Apply:
1️⃣ Open the App → Tap [Square] at the bottom → Click your [avatar] in the top right.
2️⃣ Tap [Get Certified], submit your application, and wait for approval.
Apply Now: https://www.gate.com/questionnaire/7159
Token rewards, exclusive Gate merch, and traffic exposure await you!
Details: https://www.gate.com/announcements/article/47889Your First Words Matter!
Share your first post on and split $10,000 in New Year rewards.
Post with #My2026FirstPost to share your New Year wish
2026U Position Voucher, Gate New Year boxes, F1 Red Bull merch await you!
Ends on Jan 15, 2026, 16:00 UTC
2026 starts with this post!Gate 2025 Year-End Gala Square TOP50 List Announced!
The final ranking phase is now live.
Earn Votes by watching live streams and posting.
30 Votes = 1 chance — support your favorite creators now!
👉 https://www.gate.com/activities/community-vote-2025
iPhone 17 Pro Max, JD gift cards, Mi Band, Gate merch await you!
Creators are welcome to rally fans to climb the rankings and win rewards!
Voting ends: Jan 20, 02:00 UTC
Details: https://www.gate.com/announcements/article/48693
2100NEWS WEEKLY CRYPTO REPORT Jan-9
The crypto index NWST1100 increased 0.53% last week. Ether has posted a 2.61% loss, which is less severe than the losses seen across all other segments over the previous thirty days.
*Below, we present a standardized weekly report and next week’s outlook, prepared based on the Theory Swingtum of intelligent finance. We gauge the crypto market’s breadth and direction by showing the 2100NEWS Digital Assets Total Index (NWST1100), which measures the performance of 1100 (by market capitalization) significant crypto assets. The information-laden chart is complex to read initially, but it effectively displays essential price information, key decision-making levels, momentum, trading volumes, and crypto market breadth. Monitoring Market Sentiment and Breadth is necessary to detect early signs of trend reversals or continued strength.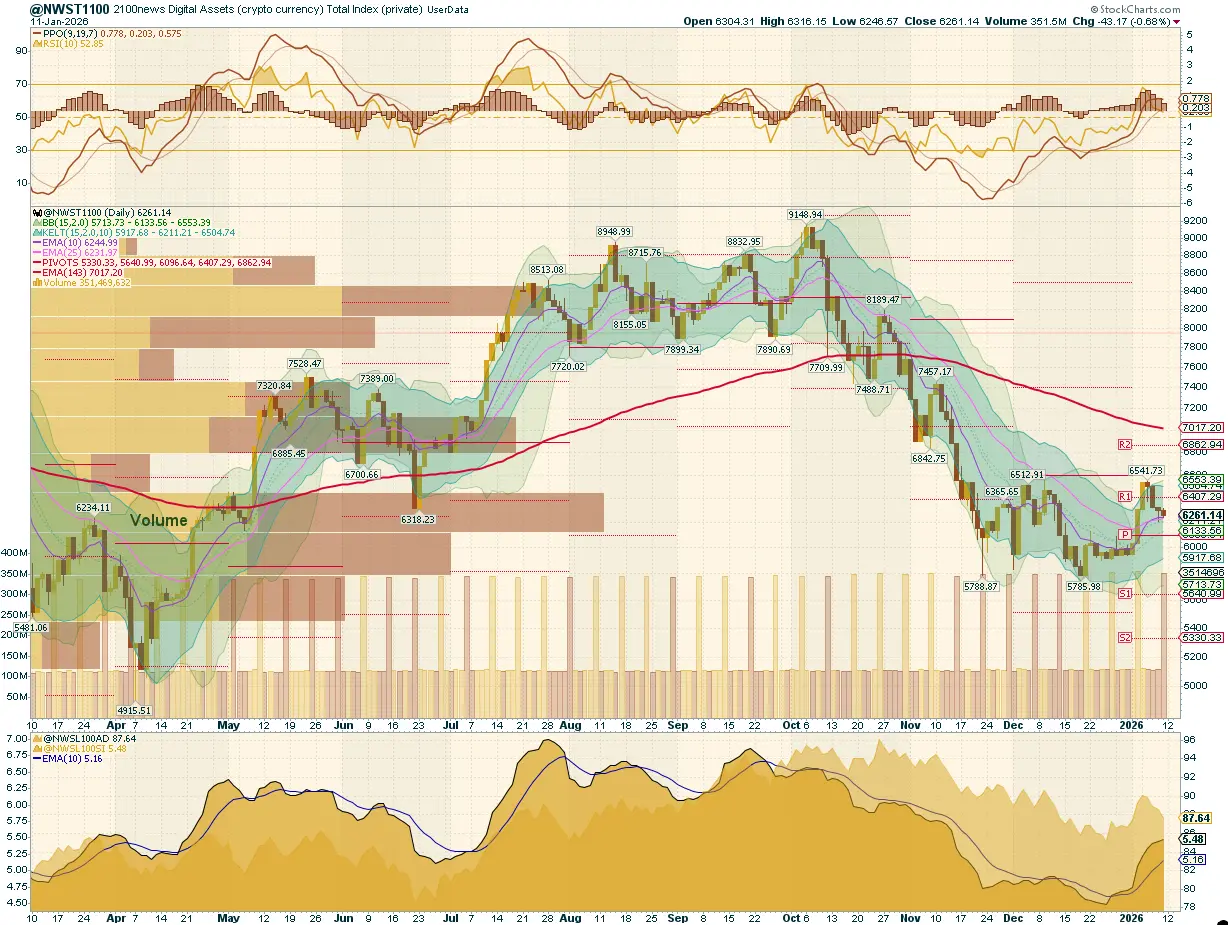
After conducting a detailed examination of the NWST1100 chart, a vital metric for the cryptocurrency market, several essential market dynamics and changes in market sentiment are revealed:
The NWST1100 index rose 0.53% over the past week, a technically revealing period that unfolded in three phases and ultimately confirmed that the market remains in corrective consolidation, despite an attempted upside resolution. After a brief dip on January 3, the market rebounded sharply and, by January 5, broke above R1 resistance with expanding momentum and improving participation, marking one of the strongest short-term rallies in recent weeks. This was followed on January 6 by a constructive consolidation, as volatility stayed elevated but pullbacks held above former resistance, signaling temporary acceptance rather than rejection. However, the breakout failed to sustain: from January 7 onward, upside momentum faded, prices slipped back below the breakout zone, and by week’s end the index had re-entered a range-bound structure. Importantly, the timing raises a broader question: to what extent have the past two weeks been driven by seasonal effects rather than structural improvement? The post-Christmas and early-January periods often trigger reflexive rebounds as liquidity normalizes and short-term positioning resets. The price behavior observed — sharp rallies, rapid mean reversion, and fading follow-through — fits this seasonal template more closely than it does a regime shift.
Market Sentiment (PPO & RSI): Momentum indicators confirm stalling, not reversal. PPO lines crossed into positive territory during the breakout but have since flattened, while the PPO histogram has rolled over, signaling loss of acceleration rather than renewed downside impulse. The RSI peaked in the low 60s during the breakout phase and has since rolled over to the low 50s, remaining constructive but no longer accelerating. This reflects momentum cooling, not breakdown.
Crypto Market Breadth indicators: Remain weak despite early signs of stabilization. The Advance-Decline Volume Line (ADVL), adapted by 2100News for the crypto market as ADVPL, tracks the net money volume of advancing versus declining digital assets. It accelerated sharply during the early-week breakout, clearly confirming that broad capital inflows supported the initial upside move. However, as the week progressed, ADVPL transitioned into a sideways drift, indicating that inflows slowed and shifted into a holding pattern rather than continuing to expand. The McClellan Summation Index, a long-term version of the McClellan Oscillator that measures market breadth, rose, signaling a meaningful improvement in participation after the December washout but flattened near resistance, confirming improved involvement without evidence of self-reinforcing expansion.
According to the chart on the right, all A50R indicators across the major segments (NWST1100, NWSET100, NWSL100, NWSCo100) have produced a sharp, synchronized spike, closely resembling the breadth expansion observed in April. Importantly, this move reflects the speed of recovery, not the depth of participation. In both cases, the spike emerged from deeply compressed, oversold conditions, driven by a rapid price reversion above the 50-day EMA rather than by sustained accumulation — a mechanical effect of sharp price rebounds. A50R readings — the share of assets trading above their 50-day EMAs — ended in the 22% to 30% range. Coins (NWSCo100) cohort remains the weakest, with only 22% of its constituents above their 50-day averages. In summary, the synchronized A50R spike marks a transition from capitulation to stabilization, not the start of a broad expansion regime. For trend confirmation, A50R would need to hold elevated levels and rebuild through time, rather than peak abruptly.
This breadth indicator measures the percentage of digital assets trading above a 50-day moving average
* The percentage of digital assets trading above a specific moving average is a breadth indicator that measures internal strength or weakness in the underlying index. The chart on the right side compares the percentage of DA trading above the 50-day EMA for:
📉 Summary
The first whole trading week of 2026 delivered important information, even though it did not resolve directionally. The market proved it can rally but cannot sustain expansion. Momentum peaked and cooled, breadth improved but stalled, and price structure reverted into a range after a failed breakout. The market environment shifted from “sell rallies” in December to “trade ranges and rotations” in early January. Conditions remain seasonally influenced and technically fragile. This remains a corrective consolidation phase, where technical levels dominate, leadership rotates, and discipline matters more than conviction.
Outlook for this week
This report examines the cryptocurrency market’s short-term outlook, identifying patterns and signals that may offer insights into potential market direction. While predicting market behavior is inherently uncertain, discernible trends in momentum and market breadth indicators suggest possible developments.
📌 Target and Scenario Considerations:
Most likely scenario: The NWST1100 enters a consolidation pause. The PPO histogram drifts toward the zero line and either flattens or briefly dips below it, while price action compresses above short-term supports. As long as the 10-day and 25-day EMAs hold, this should be interpreted as digestion rather than rejection. In this case, momentum could reset without structural damage, allowing the market to rebuild energy for another attempt toward resistance R1 later in the month. If the EMA(10)–EMA(25) support zone fails, the PPO histogram is likely to slip below zero for several sessions. That outcome would pull PPO lines sideways down and trigger a test of Pivot P. Failure to hold there would keep the market locked in a mean-reversion regime and reopen the risk of a slide back toward the lower range, reinforcing the view that the recent rally was primarily seasonal rather than structural.📍 Key Levels to Watch:
Performance of different groups of Digital Assets (Coins and Tokens)
Investors and traders rely on historical performance data to contextualize short-term moves and assess the relative strength of different market segments. The latest table shows a modest upward drift across most categories, with the NWST1100 index increasing 0.53% over the past week.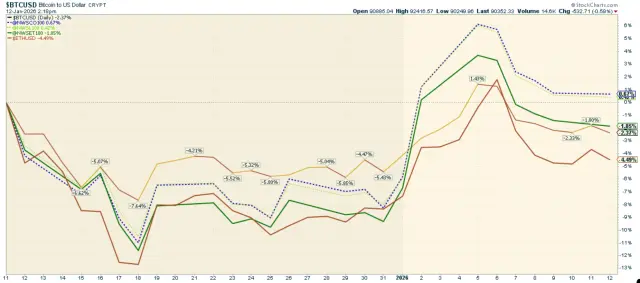 The chart above highlights the performance of various cryptocurrencies, including Bitcoin, Ether, and the 2100NEWS Indices, which represent Ethereum-based tokens (NWSET100), large caps (NWSL100), and Coins (NWSCo100). Over the past 30 days, Coins (NWSCo100) emerged as the strongest relative performer, posting a small gain of 0.67%, while Bitcoin and several other index groups recorded net declines. This places the Coins segment at the top of the relative-strength spectrum for the month, despite the absence of broad market acceleration.
While the broader market has staged a recovery, different segments and individual cryptocurrencies exhibit different performance dynamics.
Performance Trends by Market Segment:
✔ NWSCo100 (Coins) and NWSL100 (Large Caps)led the market,
✔ NWSET100 (Ethereum-based tokens) has been improving.
✔ NWS30 and Ether weakened.
✔ Bitcoin and NWSBE lagged.
Investors and traders might use this information to adjust their portfolios, possibly shifting focus toward assets with stronger relative momentum while being cautious about those in the Weakening quadrant.
*RRG® charts show the relative strength and momentum of groups of digital assets. Those with strong relative strength and momentum appear in the green Leading quadrant. As relative momentum fades, they typically move into the yellow Weakening quadrant. If relative strength then fades, they move into the red Lagging quadrant. Finally, when momentum picks up again, they shift into the blue Improving quadrant.
Crypto (Digital Assets) compared with global equity
This report offers a comprehensive analysis comparing the performance of digital assets, as measured by the NWST1100 index, to that of shares on global capital markets, as represented by the Dow Jones Global W1Dow index. The comparison spans multiple timeframes, providing insights into historical and recent performances and potential future trends.
Let’s break down the key observations and implications:
The recent pullback highlights a fundamental truth in crypto investing: market swings define opportunity. Historically, digital assets have significantly outperformed global equities, but their returns often come in concentrated bursts that follow periods of pessimism and capitulation. Prices have fallen below the 143-day EMA, positioning the market at a technically and psychologically critical juncture. Looking ahead, sentiment-driven capitulations often create conditions for stronger rebounds, especially when paired with structural oversold signals. While caution remains warranted in the short term, current price levels could present compelling opportunities for disciplined investors preparing for the next leg in crypto’s broader market cycle.
*The box in the middle of the chart shows the original NWST1100 price; at the bottom is W1Dow