Trade
Trading Type
Spot
Trade crypto freely
Alpha
Points
Get promising tokens in streamlined on-chain trading
Pre-Market
Trade new tokens before they are officially listed
Margin
Magnify your profit with leverage
Convert & Block Trading
0 Fees
Trade any size with no fees and no slippage
Leveraged Tokens
Get exposure to leveraged positions simply
Futures
Futures
Hundreds of contracts settled in USDT or BTC
Options
HOT
Trade European-style vanilla options
Unified Account
Maximize your capital efficiency
Demo Trading
Futures Kickoff
Get prepared for your futures trading
Futures Events
Participate in events to win generous rewards
Demo Trading
Use virtual funds to experience risk-free trading
Earn
Launch
Investment
Simple Earn
VIP
Earn interests with idle tokens
Auto-Invest
Auto-invest on a regular basis
Dual Investment
Buy low and sell high to take profits from price fluctuations
Quant Fund
VIP
Top asset management team helps you profit without hassle
Crypto Loan
0 Fees
Pledge one crypto to borrow another
Lending Center
One-Stop Lending Hub
VIP Wealth Hub
New
Customized wealth management empowers your assets growth
Staking
Stake cryptos to earn in PoS products
BTC Staking
HOT
Stake BTC and earn 10% APR
ETH Staking
HOT
Stake ETH and earn 10% APR
GUSD Minting
New
Use USDT/USDC to mint GUSD for treasury-level yields
Soft Staking
Earn rewards with flexible staking
More


- Trending TopicsView More
3K Popularity
4.7M Popularity
120.2K Popularity
77.6K Popularity
164.7K Popularity
- Pin
- 🍁 Golden Autumn, Big Prizes Await!
Gate Square Growth Points Lucky Draw Carnival Round 1️⃣ 3️⃣ Is Now Live!
🎁 Prize pool over $15,000+, iPhone 17 Pro Max, Gate exclusive Merch and more awaits you!
👉 Draw now: https://www.gate.com/activities/pointprize/?now_period=13&refUid=13129053
💡 How to earn more Growth Points for extra chances?
1️⃣ Go to [Square], tap the icon next to your avatar to enter [Community Center]
2️⃣ Complete daily tasks like posting, commenting, liking, and chatting to rack up points!
🍀 100% win rate — you’ll never walk away empty-handed. Try your luck today!
Details: ht - 💥 Gate Square Event: #Post0GWinUSDT# 💥
Post original content on Gate Square related to 0G or the ongoing campaigns (Earn, CandyDrop, or Contract Trading Competition) for a chance to share 200 USDT rewards!
📅 Event Period: Sept 25, 2025, 18:00 – Oct 2, 2025, 16:00 UTC
📌 Related Campaigns:
Earn: Enjoy stable earnings
👉 https://www.gate.com/announcements/article/47290
CandyDrop: Claim 0G rewards
👉 https://www.gate.com/announcements/article/47286
Contract Trading Competition: Trade to win prizes
👉 https://www.gate.com/announcements/article/47221
📌 How to Participate:
1️⃣ Post original cont - 🚀 #GateNewbieVillageEpisode2# ✖️ @独领风骚必暴富
💰 Share your first profit on Gate | 🎉 Recall your most unexpected gain | 🤝 Grow with the community
⏰ Event Date:Sept 24 04:00 – Sept 30 16:00 UTC+8
How to Join:
1️⃣ Follow Gate_Square + @独领风骚必暴富
2️⃣ Post on Gate Square with the hashtag #GateNewbieVillageEpisode2#
3️⃣ Share your first pot of gold or your most surprising profit on Gate—more detailed and interesting posts have a higher chance to win!
🎁 Rewards
3 lucky winners → Gate X RedBull Tumbler + $20 Futures Trial Voucher
If merchandise cannot be shipped, it will be replaced with a $30 Futures - 🚗 #GateSquareCommunityChallenge# Round 2 — Which coin is not listed on Gate Launchpad❓
Time to prove if you’re a true Gate veteran!
💰 Join the challenge — 5 lucky winners will share $50 in GT!
👉 How to participate:
1️⃣ Follow Gate_Square
2️⃣ Like this post
3️⃣ Comment with your answer
🗓️ Deadline: October 8, 2025, 24:00 (UTC+8) - 🥊 You’ve entered the Trading PK Arena, matching your opponent now...
One click to place an order and jump into the battle! Who will climb the leaderboard and claim the 👑?
Gate’s brand-new Indicators Radar feature is live! Here you can:
📈 Share your trades on the live candlestick chart to [Square] 👉️ https://www.gate.com/post
👀 Watch others’ trading moves in real time;
💬 Go head-to-head with fellow traders in the community!
Don’t just read—follow the tutorial below and get started 👇
📌 Note: This feature is available only on app version 7.20.5 or above.
Uncovering Strategies for Hidden Bearish Divergence Trading Patterns
ETH Market Dynamics: Decoding Short-term Pullbacks and Medium-term Trends
The cryptocurrency market witnessed an intense battle between bulls and bears as ETH experienced a dramatic price swing. After surging to $4736.82, the asset faced a sudden bearish onslaught, plummeting to $4616 within minutes. This intraday volatility of over 2% has triggered short-term pullback signals while leaving medium-term trends in a precarious position.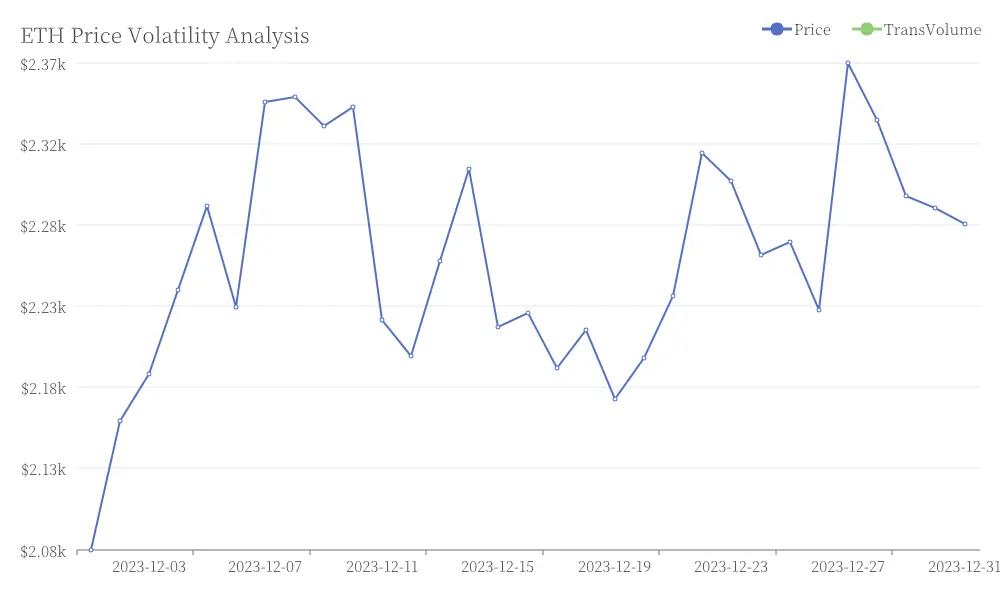 ETH Price Volatility Analysis
Short-term Outlook: Unveiling Pullback Indicators
Analysis of the 15-minute chart shows ETH breaking below the Bollinger middle band ($4681.17), placing it in a weak zone between the middle and lower bands. Consecutive bearish candles indicate weakening bullish support, with $4600 serving as both a psychological and historical consolidation zone. Without swift reclamation of the Bollinger middle band, ETH likely faces further decline toward the $4600 level.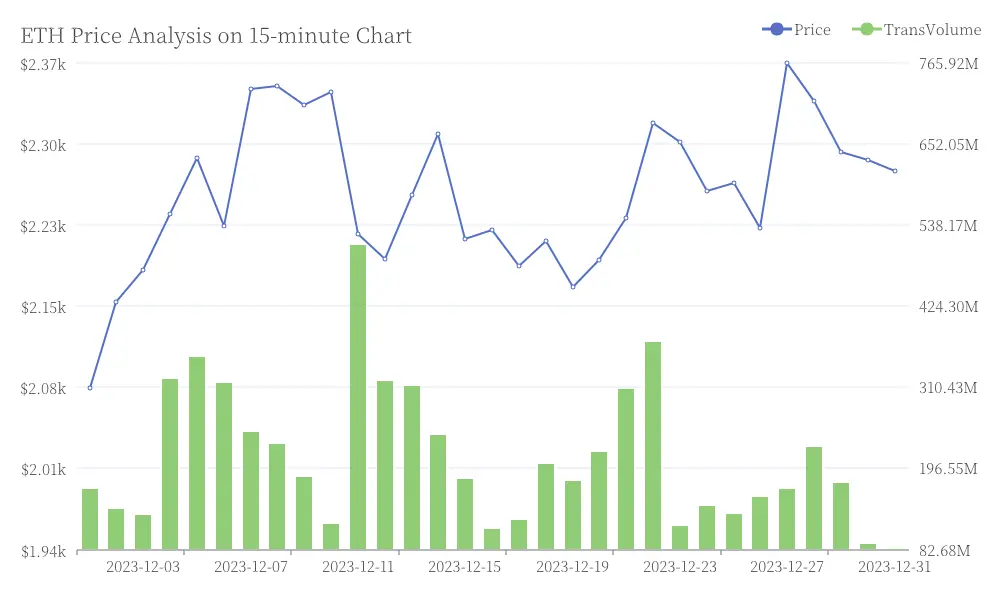 ETH Price Analysis on 15-minute Chart
Medium-term Perspective: Hidden Lifeline on Hourly Chart
The 1-hour timeframe offers more optimism as ETH holds the Bollinger middle band ($4638.24) as potential support. Upward divergence between the middle and lower bands suggests the underlying uptrend remains intact, despite consecutive price declines showing signs of bullish exhaustion. While ETH stays above the hourly Bollinger middle band, the medium-term uptrend persists, but breaking below $4638 could accelerate the pullback toward $4562.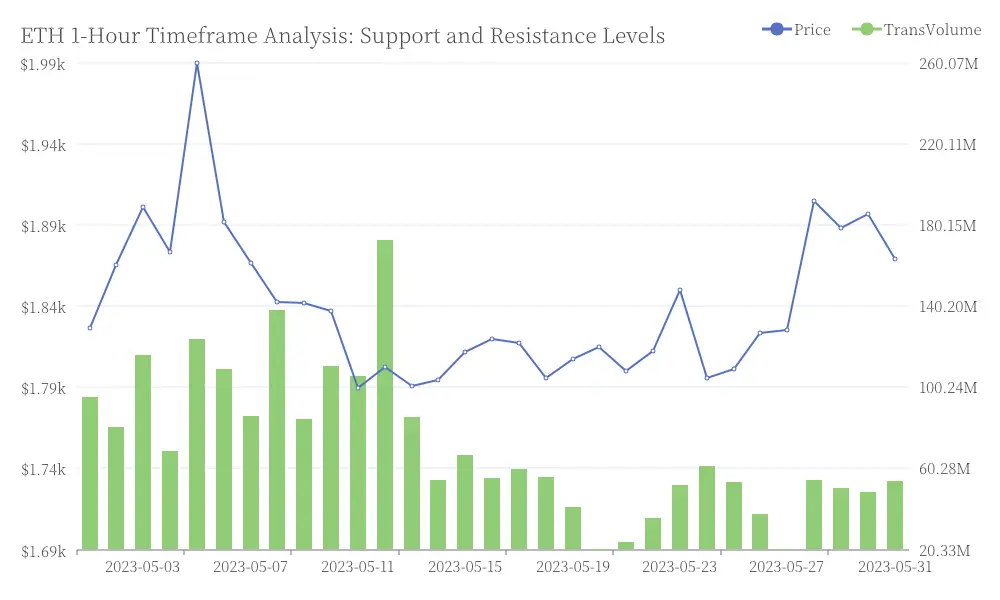 ETH 1-Hour Timeframe Analysis: Support and Resistance Levels
Critical Price Levels: Navigating the Bull-Bear Showdown
Two pivotal price levels define the current market structure: $4700, where a bullish recovery would continue the uptrend targeting previous highs, and $4638, where a bearish breakdown would intensify the pullback toward $4560 support.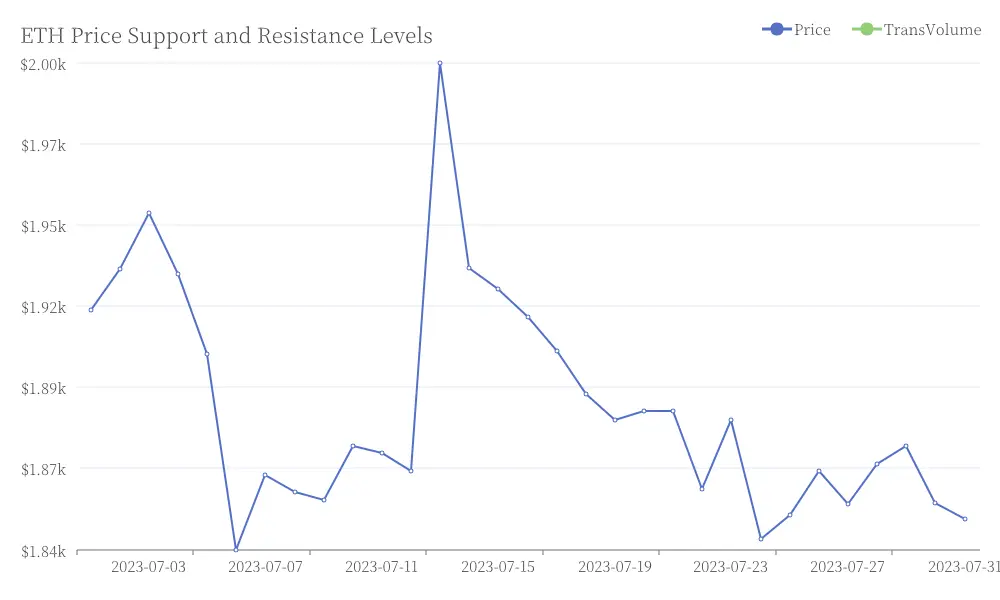 ETH Price Support and Resistance Levels
Strategic Approaches for Different Trading Horizons
Short-term traders should monitor the $4600-$4638 range, considering small long positions on strong reversal signals. Medium-term participants would benefit from reducing exposure near $4700 while accumulating in the $4600-$4560 range. Observers should wait for clear breakouts above $4700 or breakdowns below $4600 before entering positions.
Technical Analysis: Unveiling Hidden Bearish Divergence
Traders should watch for hidden bearish divergence signals where price action forms a lower high while momentum indicators show a higher high, potentially indicating a bearish reversal. This pattern often precedes significant trend reversals and requires careful analysis of price highs alongside momentum indicator readings. Using tools like the Relative Strength Index (RSI) or Moving Average Convergence Divergence (MACD) can help detect these subtle market signals. Confirming such divergence with additional price action analysis enhances trading decision reliability in this volatile environment.