CRG
暗号資産のショートポジションがこの素晴らしい日曜日に勇気を持っている
原文表示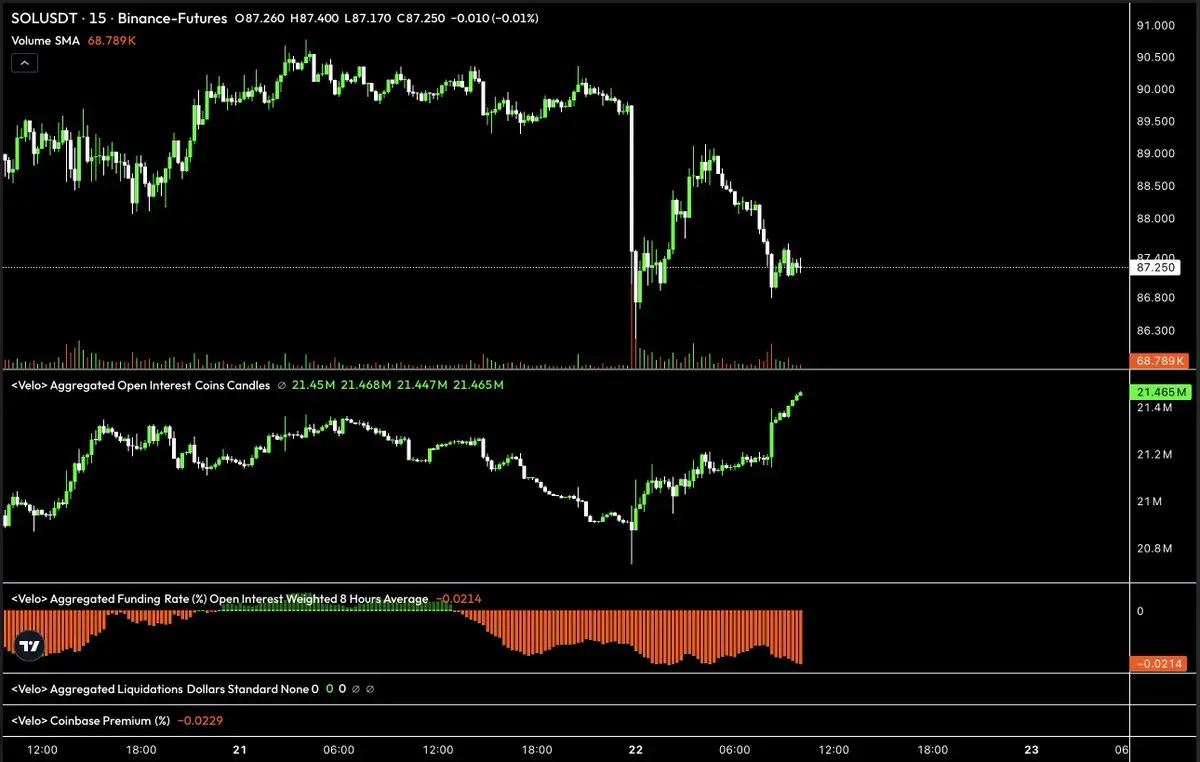
- 報酬
- 1
- コメント
- リポスト
- 共有

クジラ 0xC551 が 8 時間前にさらに 1,979 枚の $ETH($4.14M) を購入しました。
過去 1 ヶ月間、このクジラは合計 8,662 枚の $ETH($18.05M) を購入しています。
過去 1 ヶ月間、このクジラは合計 8,662 枚の $ETH($18.05M) を購入しています。
ETH-3.34%
- 報酬
- 2
- コメント
- リポスト
- 共有
汗血宝马
汗血宝马
作成者@gatefunuser_22b1
上場の進行状況
100.00%
時価総額:
$8.38K
より多くのトークン

- 報酬
- 1
- コメント
- リポスト
- 共有


- 報酬
- 1
- コメント
- リポスト
- 共有
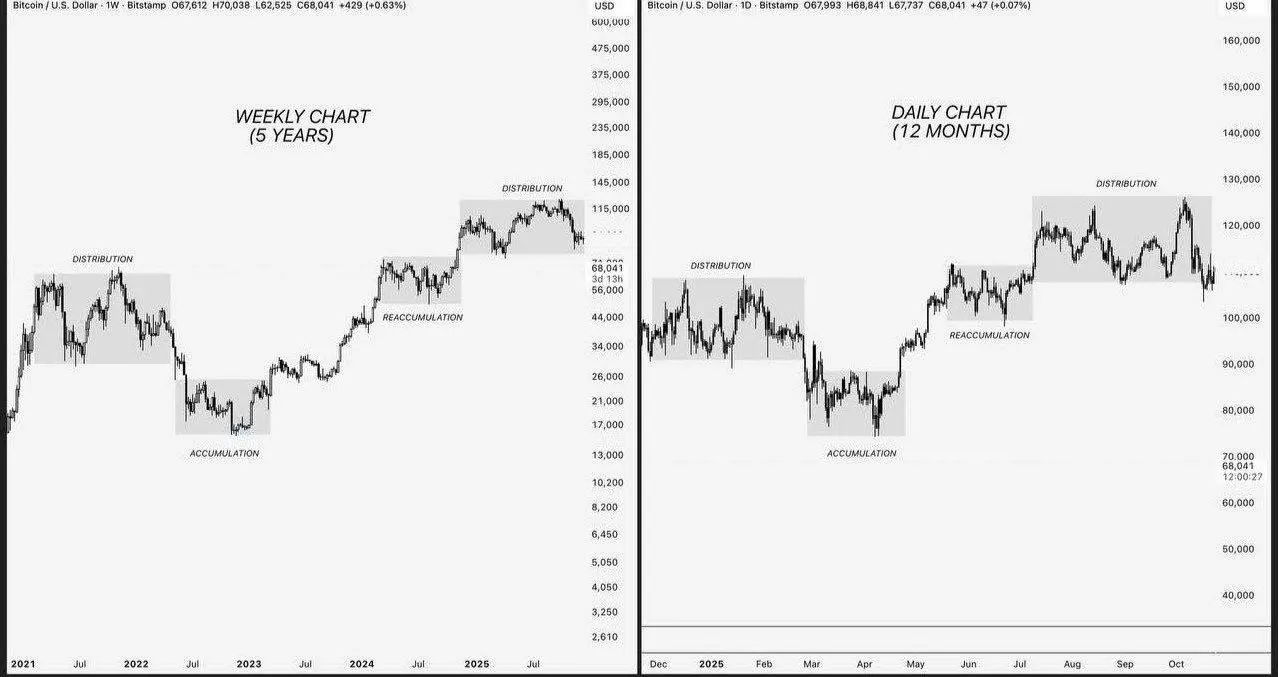
Same cycle, different timeframes.
Today I'm going to show you how to look at charts from a different angle. After you see this, you'll never look at them the same way again.
Left side: 5-year weekly chart.
Right side: 12-month daily chart.
Different time frameworks.
Different price levels.
But the underlying logic is exactly the same.
Distribution → Selling → Accumulation → Rally → Re-accumulation → Re-distribution.
This isn't Bitcoin's "magic."
This is the structural pattern that financial markets have followed for over a hundred years: stocks, commodities, fiat currencies, crypto—without exc
BTC-2.75%
- 報酬
- いいね
- コメント
- リポスト
- 共有
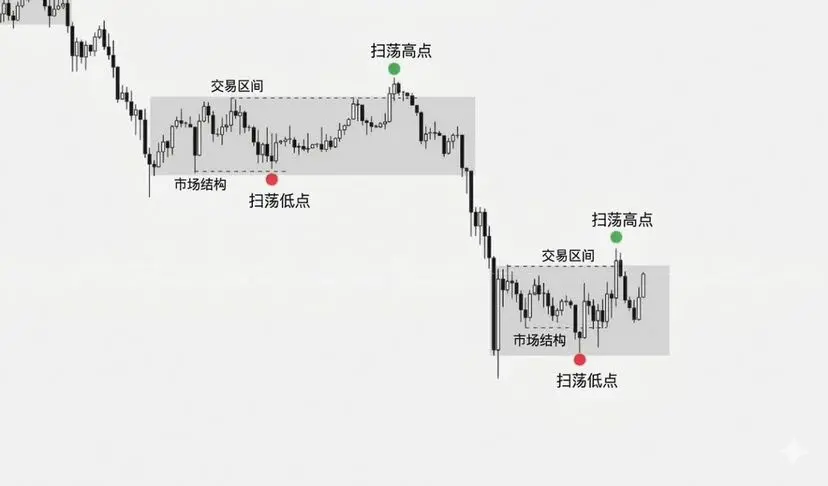
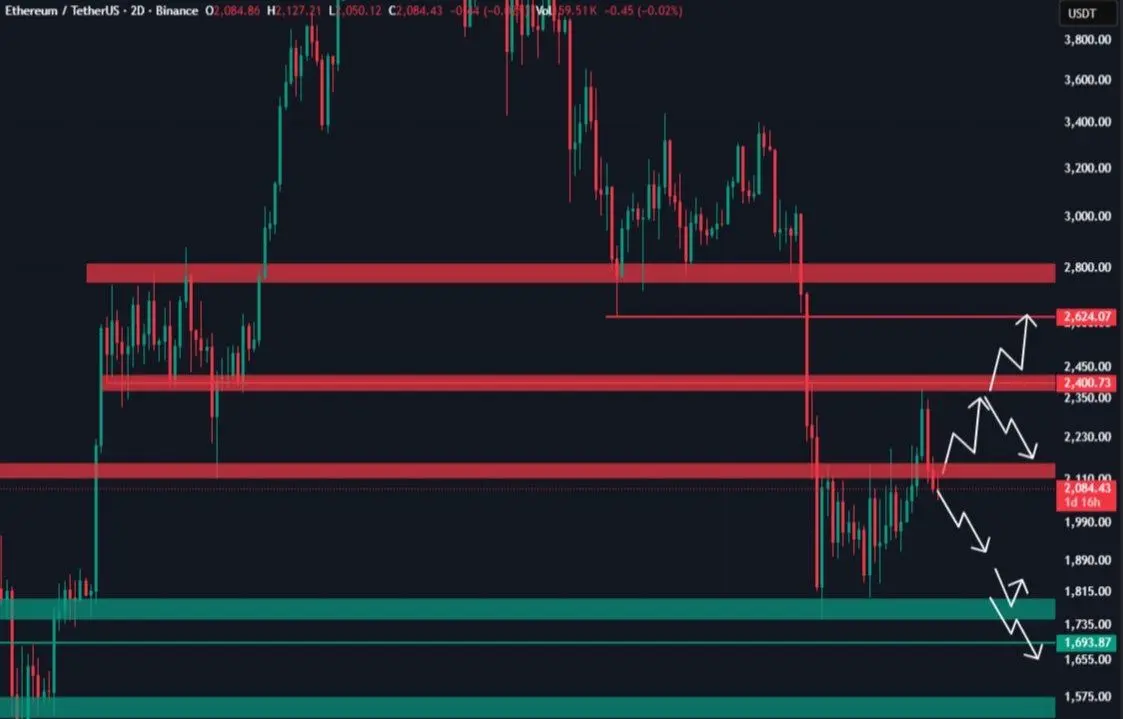
ビットコインの揉み合いは混乱ではありません。これは罠です。
投資家はしばしばBTCの横ばいを見て、市場はただ無意味に揺れているだけだと感じます。ランダムなノイズです。
しかし実際には、すべての揉み合い区間にはそれぞれのライフサイクルがあります。
ある区間はほぼ永遠に終わらず、市場が両側の流動性を集め終えるまで続きます。
この横ばいの内部で何が起きているのか:
まず、市場は一方の流動性をクリアします。
例えば、サポートを下抜ける。
ロングのストップロスが発動します。
ショートはブレイクポイントでエントリーします。
下落が始まるように見えます。
しかし、これは罠の前半にすぎません。
その後、価格は反転し、上昇して流動性をクリアします。
レジスタンスラインを突破します。
追いかけて買うトレーダーが参入します。
ショートは清算されます。
両側の流動性がすべて集まると、その区間は役割を果たし終えます。
その後にこそ、真のトレンドが始まるのです。
チャート上の最初の区間を見てください:
— 約$84K の安値をクリア
— 約$95K の高値をクリア
両側の流動性が枯渇した後、市場は急落します。
次に、今の区間を見てみましょう:
— 約$61K の安値をクリア
— 約$72K の高値をクリア
まったく同じパターンです。
これは何を意味しているのでしょうか?
区間が両端の極値をテストし終えたら、問
BTC-2.75%
- 報酬
- いいね
- コメント
- リポスト
- 共有
#AnimocaBrandsInvestsInAVAX
Animoca Brandsは、Avalanche (AVAX)への重要な戦略的投資を行いました。これはレイヤー1ブロックチェーンが分散型金融、ゲーミング、NFT、メタバース採用を促進する可能性への自信を示しています。この動きは、技術的スケーラビリティ、開発者採用、現実世界のユーティリティを組み合わせたブロックチェーンプロジェクトを支援するAnimocaの広範な戦略の一部です。Avalancheをサポートすることで、Animocaはデジタル資産と分散型アプリケーションのエコシステムを拡大しながら、ブロックチェーン業界内の長期的な成長とイノベーションを促進することを目指しています。
Avalancheは高速で低コストのスマートコントラクトプラットフォームとして認識されており、開発者が分散型アプリケーション、NFTマーケットプレイス、複雑な金融プロトコルを最小限のボトルネックで構築できることを可能にします。そのコンセンサスメカニズムはほぼ瞬時のトランザクション確定を実現し、相互運用可能なサブネットをサポートして、開発者とユーザーの両方に高度に柔軟なインフラストラクチャを提供します。Animoca Brandsの投資は、Avalancheのテクノロジーが大規模採用を維持し、ゲーミング、DeFi、NFTエコシステムに不可欠な信頼性と
AVAX-4.41%

- 報酬
- 1
- コメント
- リポスト
- 共有
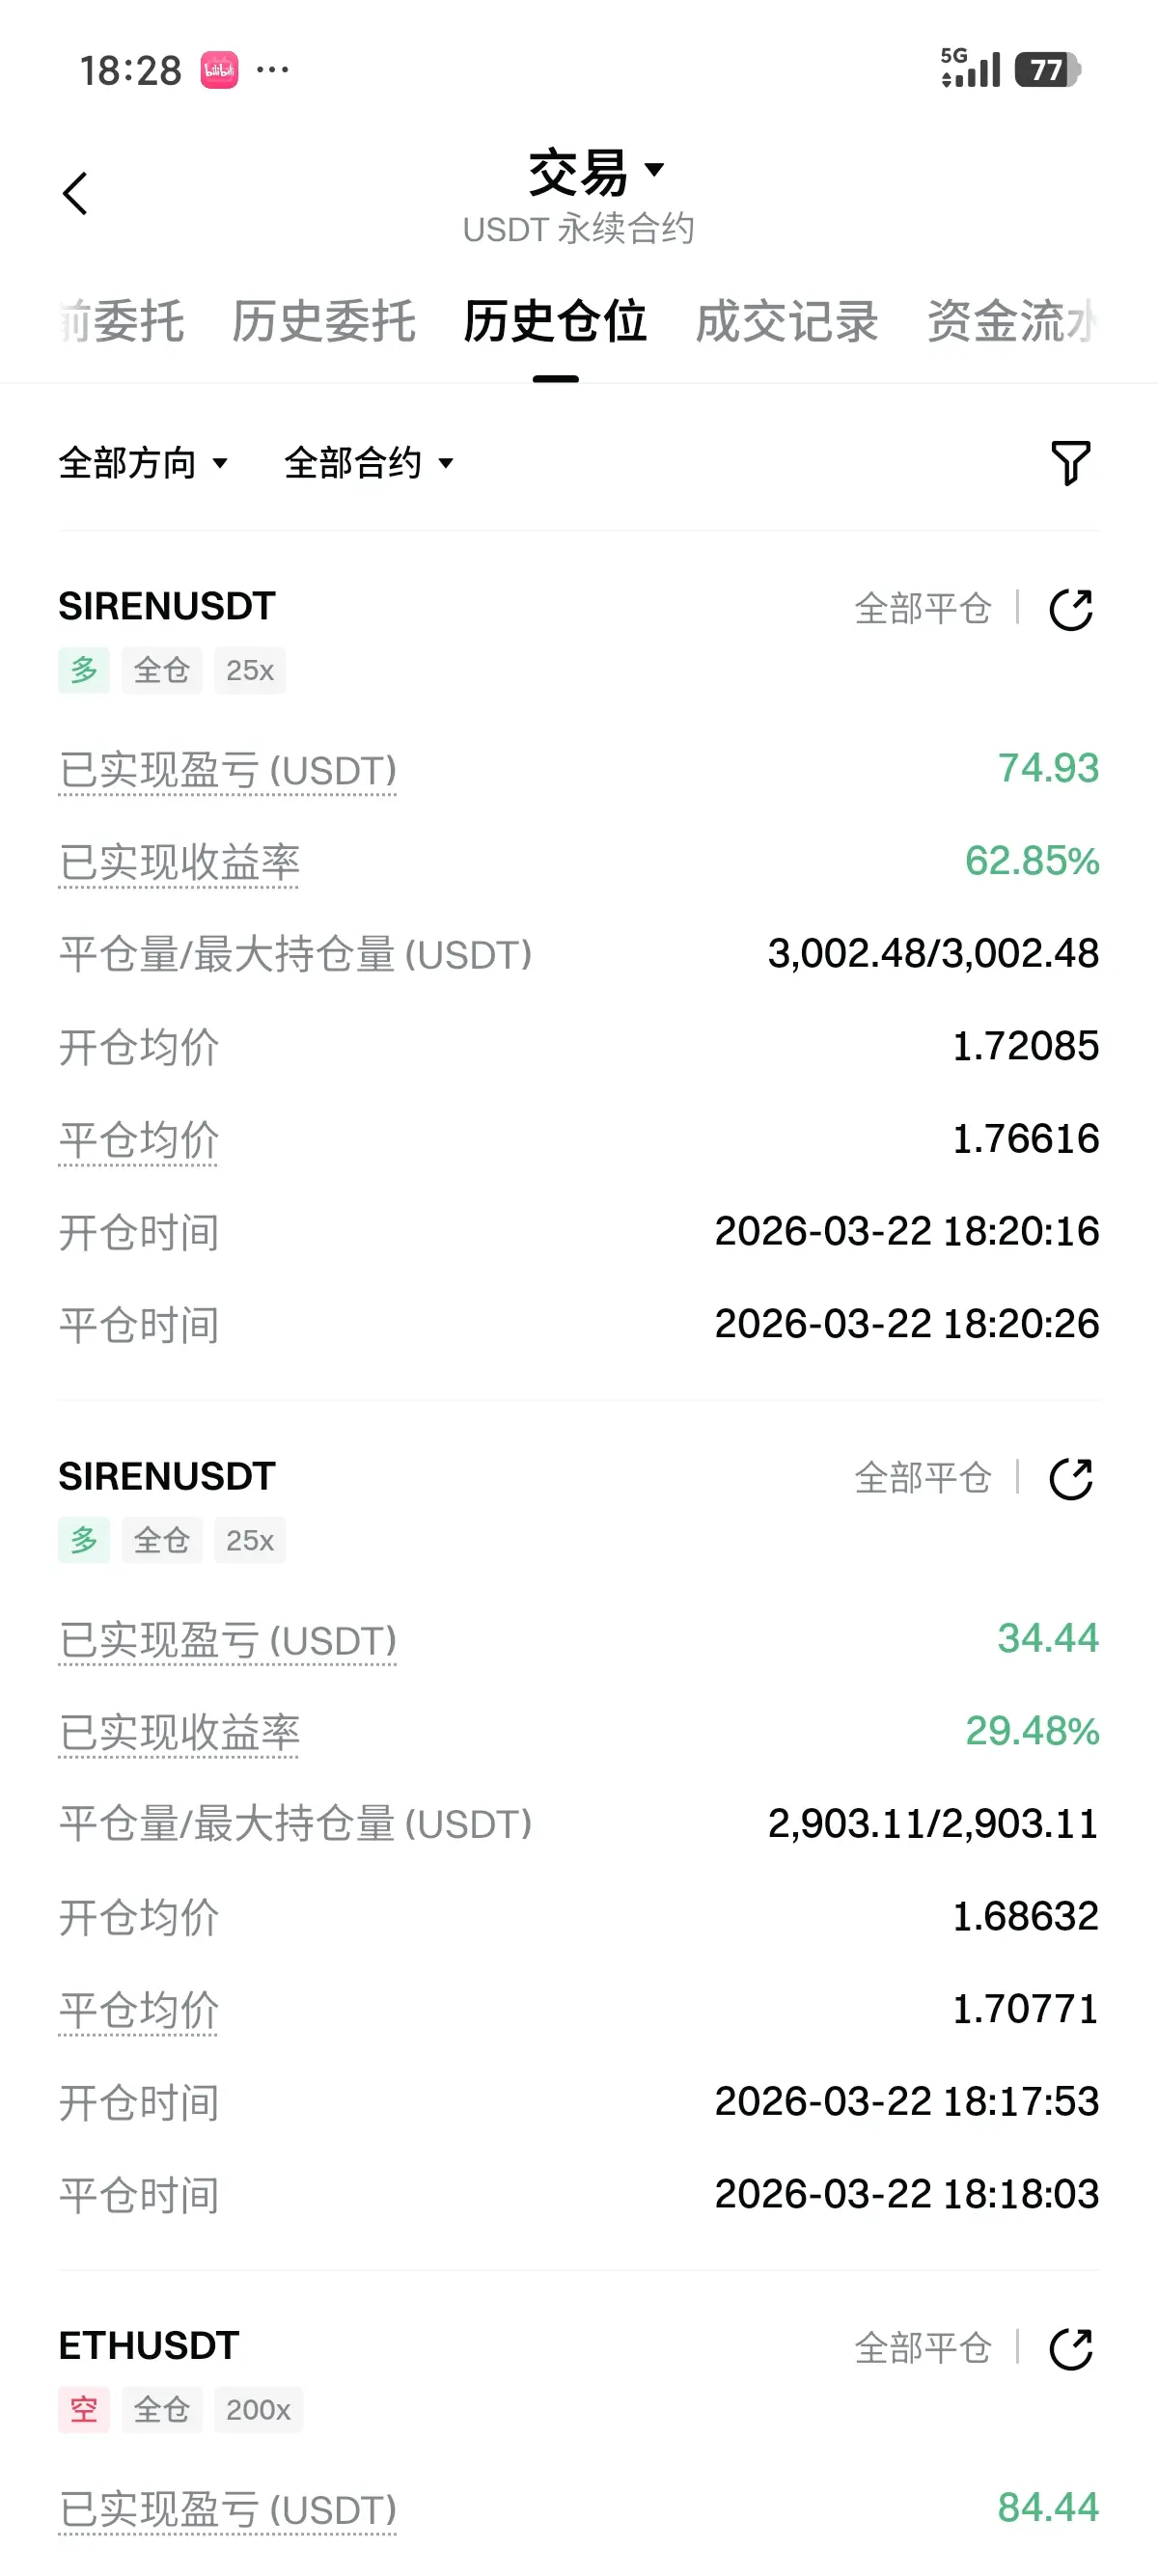
🌈 BTC 🌈
✈️ 週末も楽しく、すでに利益確定30%、この取引はリスクゼロになった!
⛽️ 流れに乗り遅れた?戦略グループに参加して、一緒に利益確定しよう!
🔥 戦略グループで戦略に乗った皆さん、おめでとうございます!
⚠️ 戦略グループの皆さんは静かに自動車之家を開いた!
👧 そして私は静かに宅配サービスを開いた!
#Gate13周年全球庆典 #TradFi首创多倍杠杆 #加密行情震荡 #创作者冲榜 #BTC $BTC
✈️ 週末も楽しく、すでに利益確定30%、この取引はリスクゼロになった!
⛽️ 流れに乗り遅れた?戦略グループに参加して、一緒に利益確定しよう!
🔥 戦略グループで戦略に乗った皆さん、おめでとうございます!
⚠️ 戦略グループの皆さんは静かに自動車之家を開いた!
👧 そして私は静かに宅配サービスを開いた!
#Gate13周年全球庆典 #TradFi首创多倍杠杆 #加密行情震荡 #创作者冲榜 #BTC $BTC
BTC-2.75%

- 報酬
- 1
- 1
- リポスト
- 共有
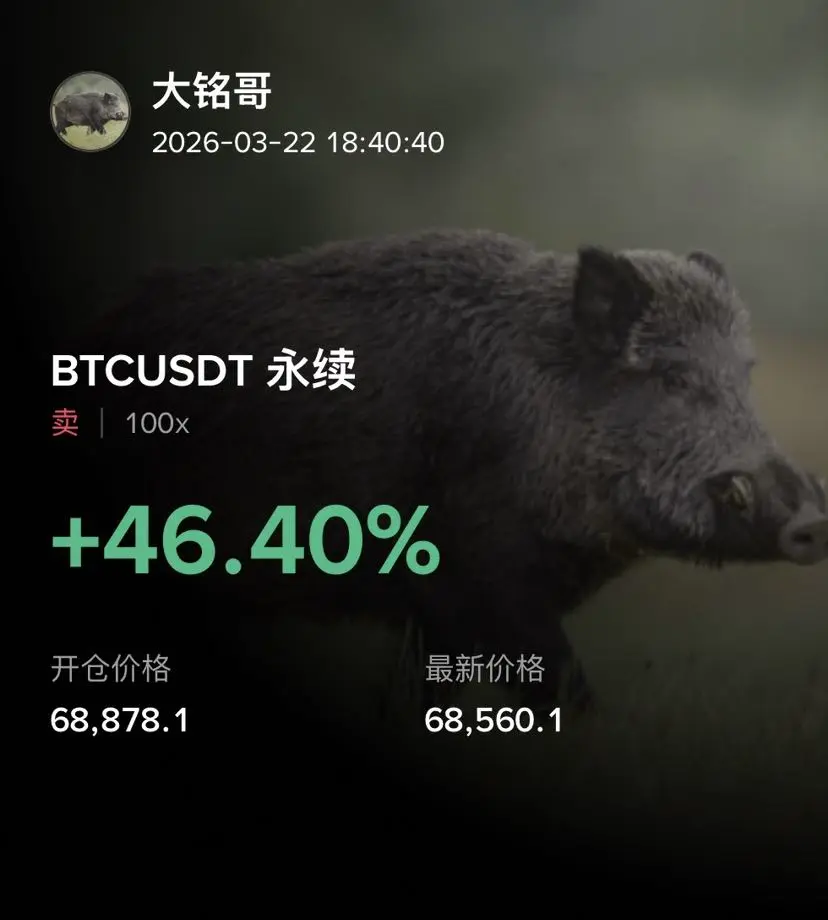
BigMingBrotherInThe :
:
若いうちに成功できるなら、なぜ大器晩成を待つ必要があるのか。花には再び咲く日があるが、人には二度と少年時代は戻らない。秘密のコミュニティに入ろう!

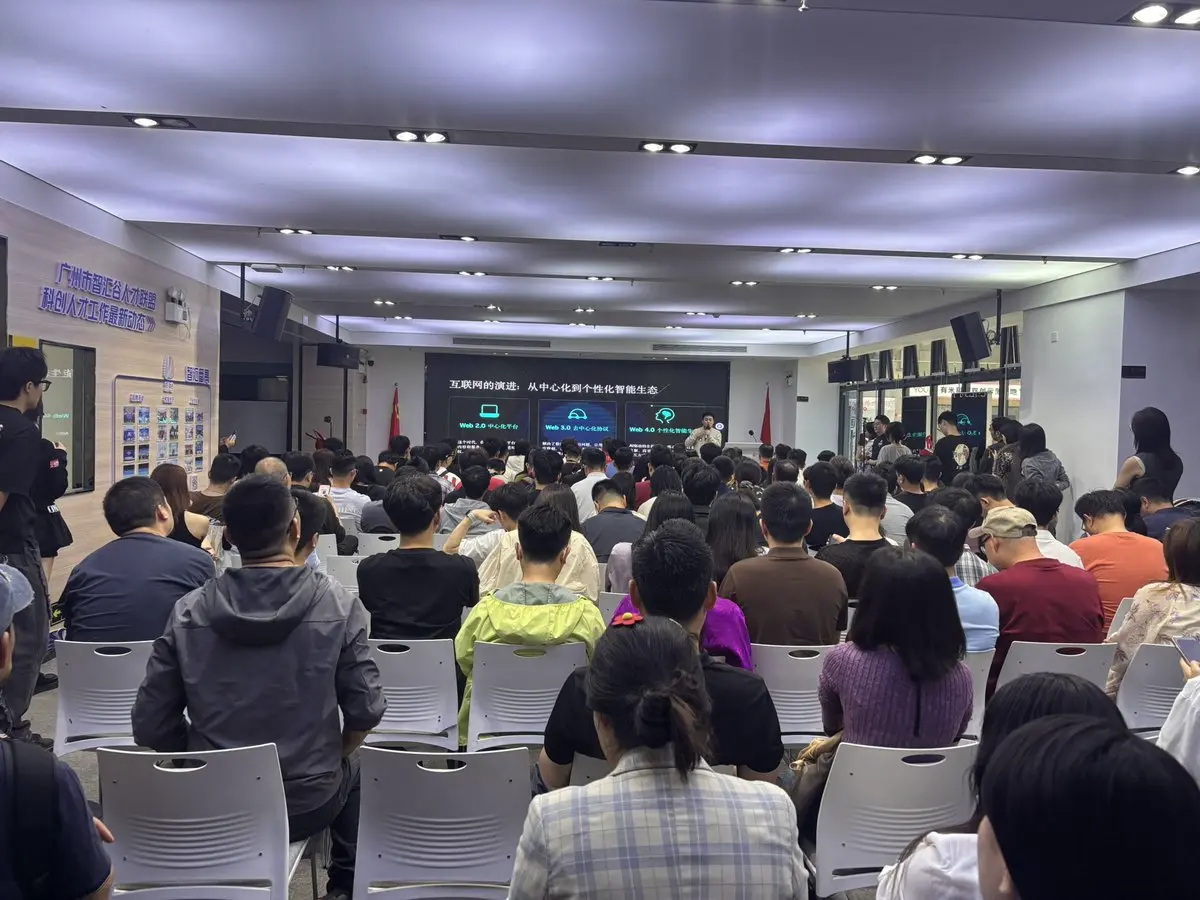
オープンクロー广州駅は明らかに気温が下がっている。
多くのWeb2の友人に尋ねたところ、彼らは毎月数百ドルをトークンに使うことと、毎月数百ドルをテスラ1台の維持に使うことの間で迷っている。
ほとんどの人が後者を選んでいる。
将来的には次のようになるだろう:
一般の人は普通のエージェントを配置する。
トップ層の人は最高級のエージェントを配置する。
原文表示多くのWeb2の友人に尋ねたところ、彼らは毎月数百ドルをトークンに使うことと、毎月数百ドルをテスラ1台の維持に使うことの間で迷っている。
ほとんどの人が後者を選んでいる。
将来的には次のようになるだろう:
一般の人は普通のエージェントを配置する。
トップ層の人は最高級のエージェントを配置する。
- 報酬
- 2
- コメント
- リポスト
- 共有
xundun
XunDun
作成者@LaoBaiContract
上場の進行状況
0.00%
時価総額:
$2.33K
より多くのトークン
Messariが#Solana #x402をSolanaに拡大
BaseおよびSolanaでのUSDC支払いをサポート
#USDC # Messari Crypto #Gate
BaseおよびSolanaでのUSDC支払いをサポート
#USDC # Messari Crypto #Gate
USDC0.01%
- 報酬
- 2
- コメント
- リポスト
- 共有
- 報酬
- 4
- 5
- リポスト
- 共有
LittleSisterWhoStrivesToGet :
:
フレンドを追加もっと見る

暗号資産市場は悪い状態にありますが、私たちは進み続けなければなりません。TNEWSトークンはそうしています。$TNEWSのバーンが続いています。本日も通常の日曜日のバーンを実施します。$BTC とアルトコインは厳しい状況ですが、市場は強気の日々に戻るでしょう。
#Gatefun #MemeGo #CryptoMarketVolatility #Gate13thAnniversaryGlobalCelebration
#Gatefun #MemeGo #CryptoMarketVolatility #Gate13thAnniversaryGlobalCelebration
BTC-2.75%

時価総額:$34.7K保有者数:176
100.00%
- 報酬
- 3
- コメント
- リポスト
- 共有
もっと詳しく
成長中のコミュニティに、40M人のユーザーと一緒に参加しましょう
⚡️ 暗号通貨ブームのディスカッションに、40M人のユーザーと一緒に参加しましょう
💬 お気に入りの人気クリエイターと交流しよう
👍 あなたの興味を見つけよう
人気の話題
もっと見る16.75M 人気度
579.98K 人気度
15.24K 人気度
1.16M 人気度
48.92K 人気度
ニュース
もっと見る中国国家インターネット緊急対応センターなどが「OpenClaw」安全利用実践ガイドを発表
25 分
ハッカーが Google Play ストアの偽ページを作成し、ブラジルのユーザーを対象に暗号通貨のマイニングとウォレットの乗っ取り攻撃を行っています
30 分
GMX Labs is Publicly Recruiting a CEO with an Annual Compensation Package of Up to Approximately $700,000
39 分
イラン議会議長:自国のインフラが攻撃された場合、地域のエネルギー施設を反撃し、油価は長期的に高止まりする可能性
46 分
蔡崇信:AIの発展の最終目標は応用の普及を促進することであり、中国は2030年までに応用普及率を90%以上にすることを掲げている
47 分
ピン